ArcGIS Arcade—an expression language used to evaluate and return data values in pop-ups, labels, and data-driven visualizations securely across the ArcGIS platform—gives you flexibility in the development process without requiring that you make changes to the feature layer.
Similar in syntax and simplicity to spreadsheet formulas, Arcade is a powerful tool that lets you display and visualize information beyond what is immediately available in a dataset by visualizing and displaying new data values. These data values are calculated on the client side and can be formatted the way you want even if you don’t own the layers containing the data.
If you are already familiar with developing custom web applications using the ArcGIS API for JavaScript, you may already know that you can evaluate custom values for visualizations and pop-ups on the client side using JavaScript functions. However, those functions can’t be shared across apps and can’t be saved to layers and portal items. Perhaps a more important point is that doing this with JavaScript would be insecure.
What makes Arcade particularly powerful is that expressions can be persisted on feature layers, portal items, and web maps. Expressions written using Arcade in ArcGIS Pro, ArcGIS Online, ArcGIS Runtime, or even in custom web apps written with the ArcGIS API for JavaScript can be seamlessly used again and again across the ArcGIS platform.
If you’ve been putting off getting started with Arcade, a few minutes reviewing the following examples will show you how Arcade can be useful for some common scenarios.
Normalization
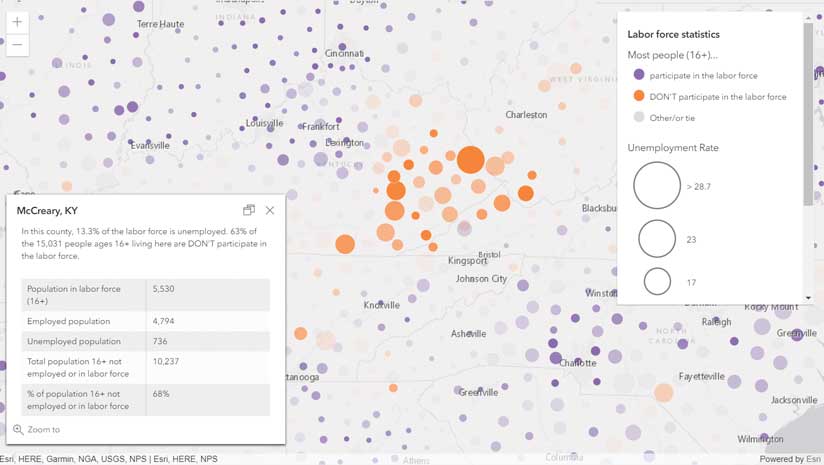
Most geospatial data visualizations use normalization. In normalization, one numeric attribute value is divided by another to minimize the influence of differences in the size of areas or the number of features in each area. For example, if I want to visualize the population for whom a second language is spoken at home for each census tract in the United States, I can use Arcade to perform the normalization using the following expression.
($feature.SECOND_LANGUAGE / $feature.POPULATION) * 100
Arcade is especially useful for accomplishing this if I don’t own the dataset. Since this expression executes on the client, no changes to the service are necessary, and all processing happens at runtime.
Rounding
Note that the previous expression didn’t specify the precision of the returned value, so it may return values containing more significant digits than desired. Modifying the expression using Round, an out-of-the-box Arcade function, will round the value to the nearest tenth.
Round(($feature.SECOND_LANGUAGE / $feature.POPULATION) *\ 100, 1)
// returns 31.8
Casting
One of the frustrations users have with some datasets is that the data isn’t represented properly: numbers stored as strings, strings that aren’t formatted, dates that are broken up and stored in multiple fields, and yes and no values that are stored as ones and zeros. Fortunately, Arcade has Text(), Number(), Date(), and Boolean() functions that (conveniently) let you cast field values as the desired type.
If you have values that have been stored as the incorrect type, you can cast those values as the correct value type so they can be properly visualized as shown in the examples Listing 1.
Number(’28324’)
// returns 28324 as a number, not a string
// e.g. for the value ’39.99%’
Number($feature.PER_ASIAN, ‘#.##%’)
// returns 0.3999 as a number
Text(1234.55, ‘$#,###.00’)
// returns ‘$1,234.55’ as a formatted stringListing 1: Casting data in Arcade
Logical Evaluation
Arcade contains six functions intended to simplify the syntax for logically evaluating values. While the syntax in Listing 2 is correct, it takes several lines of code to determine if a score is high or low based on a field value.
var rank;
if($feature.score >= 50){
rank = “high”;
} else {
rank = “low”;
}
return rank;Listing 2: Logical evaluation without Arcade functions
Arcade conveniently simplifies this common workflow with the IIF() function, which reduces seven to eight lines of code down to just one. The same evaluation in Listing 2 is shown in Listing 3. Be sure to check out When(), Decode(), and the other useful logical functions in the Arcade documentation.
IIF($feature.score >= 50, “high”, “low”);Listing 3: Logical evaluation using the IIF() functions in Arcade
Complex Expressions
Arcade is designed to be lightweight and simple. Once you’re familiar with the syntax, you can write powerful expressions in just one or two lines. However, you can also write longer, more complicated expressions in Arcade that can include custom functions and even geometry operations.
A sample in version 3.23 of the ArcGIS API for JavaScript documentation called Geofence with Arcade details how to create a geofencing app using Arcade on a StreamLayer’s renderer. The ArcGIS Blog website has featured posts that describe how to create predominance visualizations, time visualizations, and weather formulas using Arcade expressions. Search online for these posts by their titles to learn more about using longer Arcade expressions.
“Creating a predominance expression with Arcade”
“Unwinding the clock: Visualizing time with Arcade”
“Thematic point clustering for data exploration”
“Using Arcade expressions in web apps”
When Not to Use Arcade
While Arcade gives you unprecedented flexibility in customizing layer styles and pop-ups, even layers owned by others, it shouldn’t be used in every case even if it is permitted.
If you have full ownership of a layer containing the data you want to visualize in a web app and that data is already stored in a clean, acceptable way, you don’t need to write Arcade expressions. You can store values used for the data-driven visualization, pop-ups, and labels in service fields, so there is no need to write Arcade expressions for formatting or casting values.
The examples in this article use Arcade for normalizing, rounding, and casting when you don’t have privileges for the dataset you want to use and need a quick way to modify field values.
It’s also important to keep in mind that not every function included in the Arcade language should be used in all available profiles or contexts for which they can be used. Arcade provides 32 geometry functions and, in theory, any of them could be used in any profile: visualization, labeling, or pop-ups.
However, remember that Arcade executes on a feature-by-feature basis, so executing multiple geometry operations for each feature may not provide an optimal user experience if used in visualization and labeling profiles. It may be more appropriate to reserve more complex expressions using multiple geometric operations for the pop-up profile, because with that profile, the expression will execute only when a feature is clicked.
The Future
The December 2017 release of Arcade (version 1.3) introduced more than two dozen geometry functions that include measurement operations, overlay operations, and topological testing functions. Many geometry functions, such as the overlay and testing functions, require more than one input geometry. In the current release of Arcade, you can manually construct geometry objects as needed within the expression, such as calculating the distance from one hard-coded point to all points in a layer.
Future releases will provide methods that allow you to access other geometries within the same layer, related tables, and features in other layers. Additional functionality will continually be added to Arcade, but you can take advantage of the out-of-the-box functions right now. You can also go outside the box by writing your own functions.
About the author