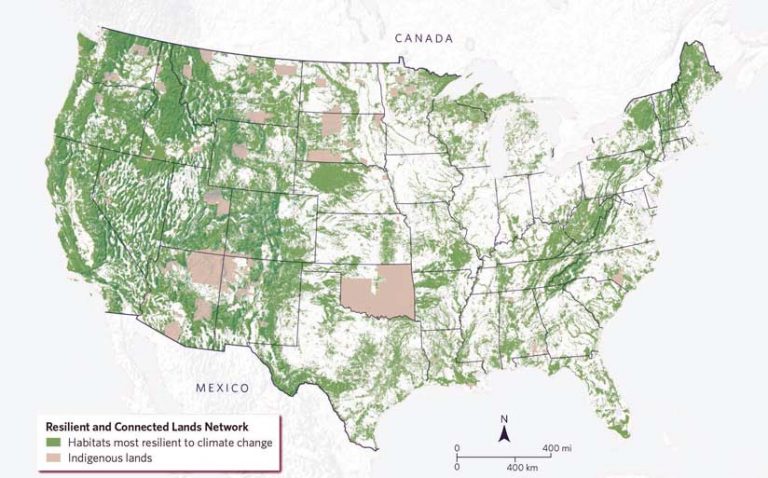
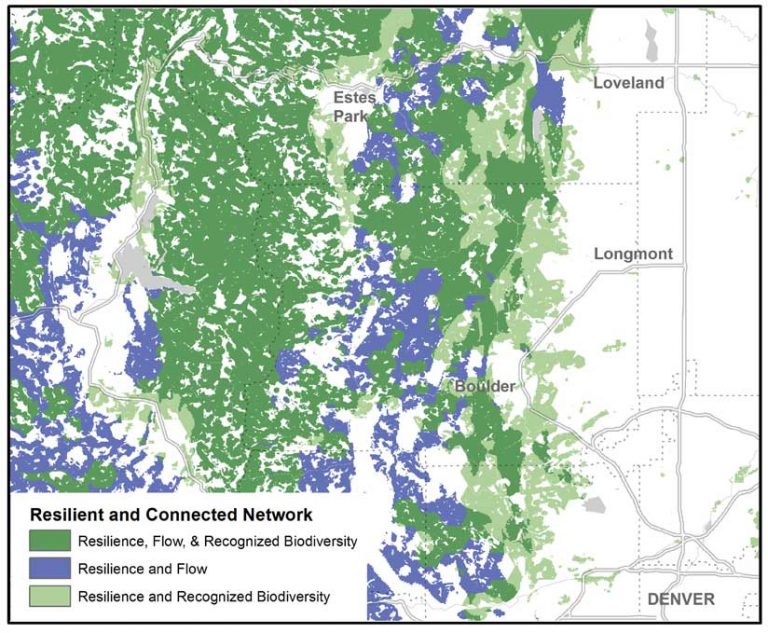
The Resilient and Connected Network, an ambitious GIS mapping tool developed over the past 10 years by more than 270 scientists led by The Nature Conservancy (TNC), gives conservationists a way to save biodiversity for the future. It is now available for land trusts, government agencies, and scientists for conservation planning throughout the contiguous lower 48 US states.
The Resilient and Connected Network, an ambitious GIS mapping tool developed over the past 10 years by more than 270 scientists led by The Nature Conservancy (TNC), gives conservationists a way to save biodiversity for the future. It is now available for land trusts, government agencies, and scientists for conservation planning throughout the contiguous lower 48 US states.
GIS has long been one of conservationists’ main go-to tools to identify and protect land, water, plants, fish, wildlife, and habitat across the globe. Using GIS to identify places with high levels of biodiversity has often played a leading role in those efforts.
Now, climate change is altering biodiversity and habitats. As warmer temperatures, increased flooding, and other climate impacts alter and destroy habitat, species are being forced to find new places to live. Diverse plants and animals that thrive in one landscape today may end up living in a very different landscape in the future.
Scientists have found that globally, species are moving an average of 11 miles north and 36 feet higher in elevation each decade to find more hospitable places to live.
How can conservationists continue to protect biodiversity if the cast of plant and animal species keeps moving to escape growing climate impacts?
Natural Neighborhoods and Highways
The answer, according to Dr. Mark Anderson, is to focus on the future. Anderson is director of science for TNC’s Eastern US Division and, for many years, has been studying the connections between climate change and shifting biodiversity. Anderson is also a GIS junkie who knows well the crucial role that GIS plays for land trusts, state agencies, and other entities planning conservation projects. Conservationists have limited funding and face huge challenges in their work preserving biodiversity and clean water and protecting the health of landscapes. They need GIS to help identify and focus on high-priority projects.
Rich data from scientists, universities, and state and federal agencies provides great insight into current biodiversity, habitat, and other natural features. But Anderson sought to see how GIS could identify places that would have long-term resilience as the climate changes.
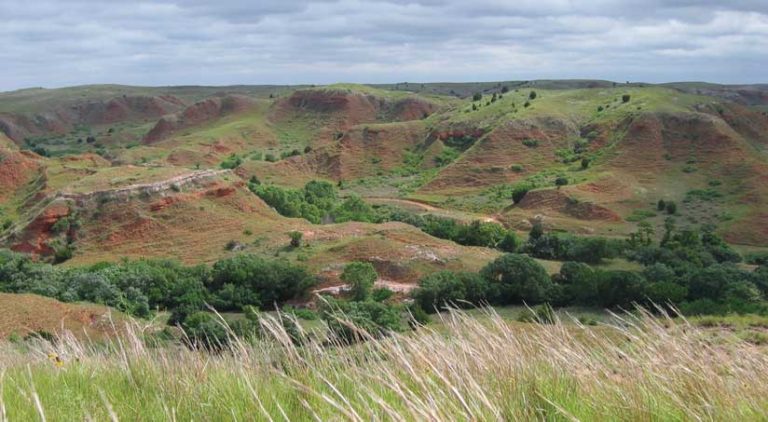
Anderson and his team found that landscapes with diverse physical characteristics—such as steep slopes, tall mountains, deep ravines, and diverse soil types—create numerous microclimates that offer plants and animals the opportunity to move around their local neighborhood to find suitable habitat where they can escape rising temperatures, increased floods, or drought.
Anderson and his colleague Melissa Clark also mapped natural highways across the country—connecting corridors that allow species to move safely within and between these climate-resilient neighborhoods.
While studies show that species are moving to cooler places, nearly 60 percent of US lands and waters are fragmented by human development, blocking species’ movement and preventing them from finding new homes.
“Nature is on the move,” Anderson said. “It’s not enough to have isolated and disconnected landscapes that are resilient to climate impacts. Species also need a way to reach these resilient sites. While some species will be able to relocate to new homes within their local resilient neighborhoods, others will need to move great distances to entirely new landscapes. If these pathways are destroyed, many species could disappear forever.”
A Ton of Data and Essential Esri Tools
To create the Resilient and Connected Network mapping tool, Anderson and his team had to “compress 200 gigabytes of data into a useful tool and make it look and work seamlessly,” said Erik Martin, a TNC spatial ecologist who helped lead the GIS work. “The map reflects a ton of data, pulling from hundreds of datasets from all around the country.”
Using Esri’s advanced spatial analysis and modeling tools and working many long nights over the past 10 years, TNC scientists Clark, Arlene Olivero Sheldon, and Analie Barnett developed, tested, and retested methods to map and measure characteristics of resilient lands. Their analytical and problem-solving skills, coupled with their determination and passion for conservation, took the idea of a network of resilient lands from concept to reality.
One of the big challenges, according to Anderson, was persisting over the 10-year life-span of the project. During that time, the project grew organically region by region, starting with the Northeast. To ensure accuracy as the map was being built, the team had reviews by some 270 scientists, who were looking at localized geography or geography at a nationwide scale, depending on their expertise. Aiding in that process was the ability to share regional versions via ArcGIS StoryMaps.
Many other Esri products and apps were essential for the job. These included ArcGIS Pro, ArcGIS Online for hosting tiled map services, ArcGIS Server for hosting dynamic map services and geoprocessing services that run custom ArcPy-based scripts, and the ArcGIS API for JavaScript to develop the front end of the tool. All those components came together, making the map fast and responsive for users.
The team relied heavily on ArcMap and ArcGIS Pro, using 30-meter scale raster data of the entire country for analysis and mapping. The ArcGIS Spatial Analyst toolsets contained the team’s go-to tools. Python and ModelBuilder were used to test analysis and iterate steps in each region. Getting feedback from regional scientists helped shape the final product. The team used the quick publishing capabilities of ArcGIS Online. ArcGIS StoryMaps stories were key in explaining analysis results and showcasing resilient places across the US.
“Each of these components is like a building block of a house. We used the ArcGIS API for JavaScript to build the frame of the house—the structure of the app. Then [we] connected together all of the electrical and plumbing—the map and geoprocessing services that feed into the app,” Martin said. “The Esri tools integrate all of the parts of this data into one useful app.”
A Paradigm Shift for Large Landscape Conservation
When the nationwide map was completed, one of the big surprises for Anderson was the large number of areas around the country that are resilient to climate change. “When I first envisioned this, I thought there would be a bunch of big, broad areas. It’s really like a web, or a network of connected places.”
Among the many large and small resilient and connected lands in the map are:
- Nevada’s Monsoon Passage, a natural highway of mountain ranges and wet valley bottoms that extends up from Lake Mead through the Great Basin National Park to the Idaho border.
- The Cumberland Forests area, which spans 253,000 acres across Tennessee, Kentucky, and Virginia, that not only safeguards wildlife habitat but also stores millions of tons of carbon.
Wisconsin’s Kettle Moraine region, which was shaped by glaciers during the last ice age and contains diverse features such as large kettle lakes and 300-foot-high ridges. - Bobcat Alley, a 32,000-acre forested corridor in northwestern New Jersey that provides habitat to state-endangered bobcats.
Along with providing safe places where species can thrive, the network of resilient lands also brings benefits to people. The lands mapped in the eastern US, for example, contain 75 percent of the region’s sources of drinking water, generate billions of dollars in outdoor recreation, store 3.9 billion tons of carbon, and mitigate 1.3 million tons of pollution. Taken together, this results in an estimated $913 million in avoided health-care costs.
“To achieve conservation at the scale needed, we must collaborate with people and organizations across both the public and private sectors,” Anderson said. “Keeping these resilient areas safe and healthy will require a wide range of conservation practices including such things as sustainable management, public and private land acquisition, and easements.”
Numerous state and federal agencies and land trusts have already incorporated the map’s data into their conservation planning. Among the growing number of state agencies incorporating the map into their state Wildlife Action Plans are Connecticut, Massachusetts, New Hampshire, New York, and South Carolina.
The urgency of protecting lands and biodiversity given the challenges of climate change is clear and pressing, according to Andrew Bowman, president of the Land Trust Alliance. At Rally 2019: The National Land Conservation Conference, the country’s largest gathering of land trusts, Bowman made a passionate plea for safeguarding biodiversity for the future. The Resilient and Connected Network is an important tool for that urgent task.
“This map provides a new way to look at the landscape for purposes of prioritizing lands for the conservation of biodiversity,” Bowman said. “I’ve watched this work take shape over the last decade, and I truly believe it marks a paradigm shift in how we think about large landscape conservation.”
For more information, contact Eric Aldrich at ealdrich@tnc.org.
See the mapping tool.
More Resources
- For information and data on resilient and connected landscapes, visit nature.org/climateresilience.
- For information on the TNC’s work, visit nature.org/naturalhighways.
- View the ArcGIS StoryMaps stories on resilient and connected landscapes.
About the author