The Saudi Arabian Oil Company (Saudi Aramco) operates and maintains the extensive network of hydrocarbon transmission pipelines that carry oil, natural gas, natural gas liquids (NGL), and even products such as diesel. The total length of these pipelines exceeds by 15 percent the 13,000 miles spanned by the Great Wall of China.
This huge network of buried pipelines connects refining facilities, domestic customers, and export terminals. Pipelines cross the entire Saudi Arabia territory from east to west and north to south, encompassing an area of diverse terrain and harsh environmental conditions. An enormous number of assets of various types are part of this pipeline network.
Operating the network and its related assets poses many challenges, which often necessitate implementing normal and emergency modifications to maintain the safety, reliability, and integrity of the whole transmission pipeline network.
The status of changes to the network and its assets must be tracked to ensure they comply with requirements. The transmission pipeline network, its related assets, and all modifications to the network and assets are maintained as an as-built pipeline network layout that is monitored by a comprehensive GIS application. The data for that GIS application is managed by a dedicated unit within the Pipelines Department of Saudi Aramco called the Pipelines Data Management Unit (PDMU).
Because the pipelines and assets are distributed over a wide area, geographic zones or areas of responsibility were created for the three main subdepartments within the Pipelines Department and for all operating units that report to each department. This ensures project completion and compliance for normal and emergency changes.
Project staff come from different disciplines, such as operations, maintenance, or inspection. They submit change requests, update progress data, and confirm the completion and implementation status of changes in the corporate enterprise resource planning (ERP) system.
PDMU staff are not a permanent part of this process. To obtain information and data related to any changes implemented on the transmission pipeline network, intensive email communication between PDMU and Pipelines Department staff was necessary. These messages provided Pipelines Department management with status updates.
Developing the Pipelines Management of Change Application
To address the challenges of monitoring the pipeline network, a GIS dashboard solution was developed. This solution, the Pipelines Management of Change (MOC), enhances the tracking and monitoring of changes to the network and establishes a complete data update workflow for capturing and maintaining current pipeline asset data.
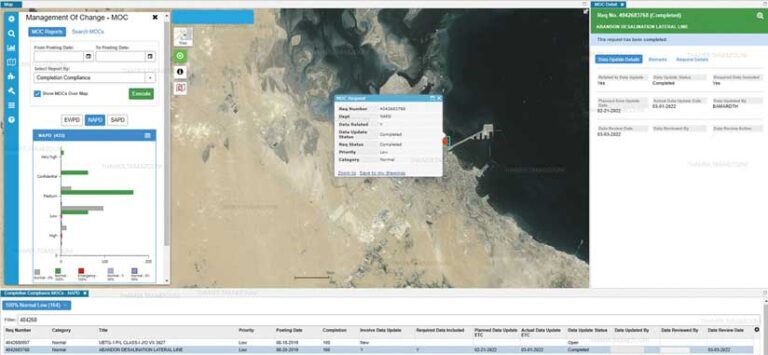
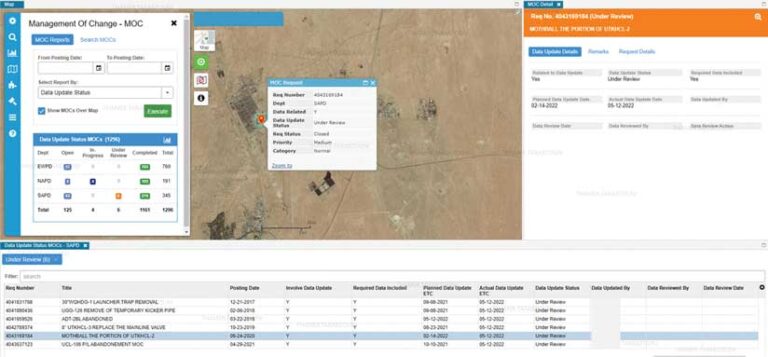
MOC is a GIS dashboard with two main components. The first component displays tabular data and change locations on a map. Selectable analysis charts and tables enable managers and key stakeholders to browse various types of information about normal and emergency changes. Managers can track the progress of changes and their status versus planned changes that have been scheduled.
The dashboard displays status charts or tables on the map georeferenced to its area of responsibility. By browsing charts and tables, changes that have passed the scheduled implementation date can be identified. The distribution of both normal and emergency changes is easily discerned because their locations are georeferenced on the map. This allows staff members to more immediately arrive at conclusions and supports decision-making.
The other main component of the GIS dashboard is a data update workflow. GIS was employed to improve the overall process. Because the ERP system is used by different Pipelines Department staff members for submitting MOC change requests based on geographic areas, this component initially fetches any new normal or emergency changes that have been entered in the ERP system. These changes are entered daily.
PDMU staff, using the analyses implemented in MOC, can focus on submitted requests for changes—classified as either emergency or normal—that will modify transmission pipelines and related asset data. A location tag on the map is created to reference the MOC request in case it can’t be referenced using an existing GIS asset. This is important for locating new assets that have been added or existing assets that have been relocated.
Based on the status of changes or their completion, a data update workflow is triggered. This workflow is monitored by PDMU staff and the PDMU supervisor, who ensure that the data is updated in a timely fashion and passes quality assurance/quality control (QA/QC) processes. The GIS technology employed in this workflow enables users to zoom to asset locations affected by the MOC request and perform QA/QC on updated data by either approving it or rejecting it and redoing the data update action.
With the solution, staff can identify assets that have been removed or reallocated or newly added assets. Innovative GIS editing tools, email notifications, and QA/QC levels with appropriate levels of review and approval maintain up-to-date pipeline GIS data.
Through a dashboard, MOC employs GIS technology to enhance visualization and track the location of normal and emergency changes submitted by staff members who have different areas of responsibility. The app is integrated with the corporate ERP change management system and email gateway. The solution consists of a data synchronization agent that periodically updates the change request data in ArcGIS Enterprise by importing data from the corporate ERP system through a REST endpoint.
MOC was developed using ArcGIS API for JavaScript and other enterprise technologies. It was designed with flexibility in mind. Different user roles have access to specific functionalities such as data updates. There is a designated user role that grants access only to PDMU staff. The supervisor role determines who can approve or reject data updates.
Benefits Realized
The MOC application provides requested functionality and addresses concerns raised by management and technical staff. The GIS dashboard provides management with selectable charts and tables, so the progress of normal and emergency changes can be immediately monitored, and compliance can be ensured. These changes are extracted from the ERP system so that MOC acts as a gateway for browsing information without logging in to the system.
MOC enables the classification of changes that involve data updates to the pipeline as-built network and tracks the completion of changes, ensuring data is updated accordingly. PDMU staff can monitor and track all changes implemented on the pipeline by various operation and maintenance staff. The custom GIS-based workflow greatly assists in keeping GIS data up-to-date. It also eliminates major work related to customizing the corporate ERP system, which directs all pipeline-related changes to PDMU for review. ERP system customization would have delayed the project considerably and imposed major delays in executing changes.
For more information, please contact Thamer Tarabzouni.
About the authors

Thamer Tarabzouni

Nawaf Bakr

Iftikhar Ahmed