The Transportation Department for Cary, North Carolina, leverages GIS to assist with the collection, dissemination, and analysis of the annual street rating data it maintains for more than 500 miles of streets.
Streets are prioritized for improvements based on pavement condition ratings. The town’s staff members apply GIS to analyze, map, and compile street ratings in a central location. The data is used in a dashboard to support internal decision-making and in a map for the public that identifies streets that will be repaved. Cross-departmental coordination provides an opportunity to create efficiencies in many areas and supports residents.
Maintaining Streets
With more than 170,000 residents, Cary is a thriving community in the heart of the Triangle area of North Carolina, between Raleigh and the renowned Research Triangle Park. [Research Triangle Park is home to more than 250 businesses and is the largest research park in North America.]
Cary is committed to keeping the town’s street assets clean, safe, and well maintained. A twofold approach is necessary to make data on these assets available to managers and officials, who use this information to make critical decisions and inform the public.
Part of Cary’s street improvements process seeks to rehabilitate and resurface streets during early stages of deterioration while also looking for cost-effective ways to increase the life of streets. Streets are resurfaced during the early stages of cracking and deterioration or patched, or the asphalt is rejuvenated. The street improvement process also includes replacing or installing new ramps that comply with the Americans with Disabilities Act (ADA), as well as sidewalks, traffic calming devices, and pavement markings.
Pavement Analysis and Selection
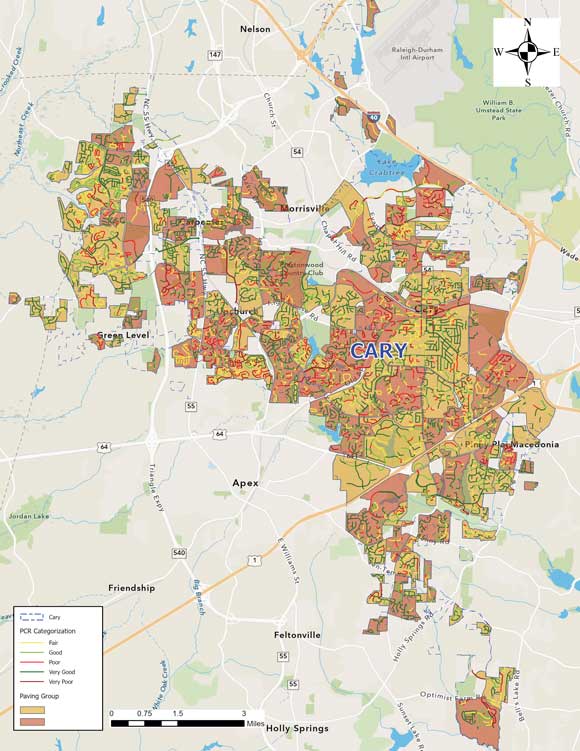
The Transportation Department uses an independent, third-party consultant to survey the condition of public streets. Streets are surveyed by block or segment to collect information, which includes physical characteristics and pavement distress types. Types of pavement distress include alligator cracking, raveling, rutting, block or transverse cracking, patching, bleeding, and any reflective cracking.
The information collected across these distress types supports the calculation of each street segment’s pavement condition rating (PCR). Street segments are assigned to one of five rating categories that range from very good to very poor. All data is compiled into a database to determine which pavement maintenance technique is appropriate for each street.
Within the last five years, Cary created Paving Groups to analyze streets. These 166 Paving Groups consist of neighborhood streets used to support the selection and grouping of poorly rated streets for improvements and to simplify construction. As data continued to be compiled, the Transportation Department needed a way to analyze pavement rating data across multiple years to support better informed decision-making.
History Informs Decision-Making
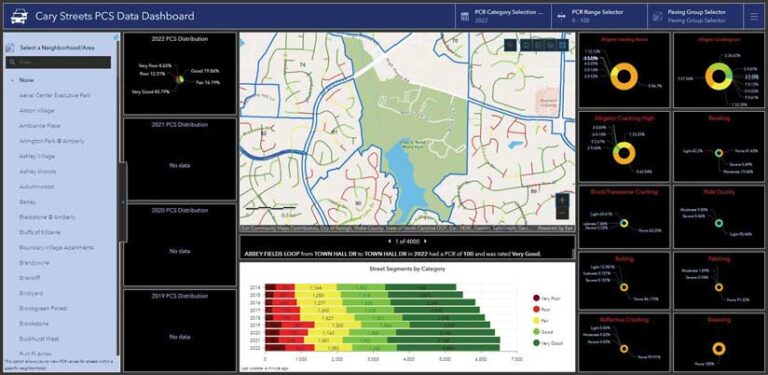
To simplify data management and increase accessibility to data across multiple departments, the Transportation Department used ArcGIS Dashboards to create a pavement condition data dashboard. Once the data was cleaned, validated, and published, the dashboard revealed the condition of streets within each paving group. The dashboard displays pavement condition data collected over nearly 10 years. Stakeholders across multiple departments could perform interactive querying and have access to all attributes originally contained in the database, but now in a more visual format.
The Pavement Conditions Survey (PCS) provides annual data that is used by the PCS Data Dashboard, which enables staff to visualize this information. Statistical values for pavement distresses can be selected for each year and their distribution analyzed geographically.
Queries can be run on multiple years of data and efficiently summarized using the dashboard. The real power of the PCS Data Dashboard is its ability to summarize one attribute based on another. This wasn’t possible previously because multiple layers of annual street rating data were held separately. Spatially accurate, attributed data is now centrally located and updated annually, with the most recent pavement attributes appended to the database.
Sharing Is Caring
The PCS Data Dashboard is a very shareable resource. At any time on any day, departments across Cary are coordinating the delivery of important services at the high standards that residents have come to expect. For example, the PCS Data Dashboard directly supports the street improvements project manager by helping to determine which streets need upgrading while streamlining that list based on budgetary constraints.
The Utilities Department maintains the underground infrastructure of waterlines, sewer lines, and storm drains. The dashboard supports planning utility upgrades and project coordination. In the past, large, printed maps were used to coordinate efforts and identify and manage utility and street improvement conflicts. Although these maps had some advantages, the growth in the number of assets Cary manages required visualizing statistics—such as the demand for a service or demographics—more effectively. With the ArcGIS web-based platform, a user has a wide range of options for designing and incorporating decision-based maps. This has resulted in collaboration between the Utilities and Transportation Departments so that utility upgrades occur prior to street paving in the same area.
The Transportation Department has found the PCS Data Dashboard particularly useful in the analysis of street data. By having all data in one place, users can easily view a particular pavement distress type along a street, across multiple years. Since streets are chosen for improvement efforts by segment, the data now allows for more longitudinal analysis of the entire street’s length. This is valuable when considering distress types, such as alligator cracking, that indicate more structural pavement issues when appearing across longer street extents.
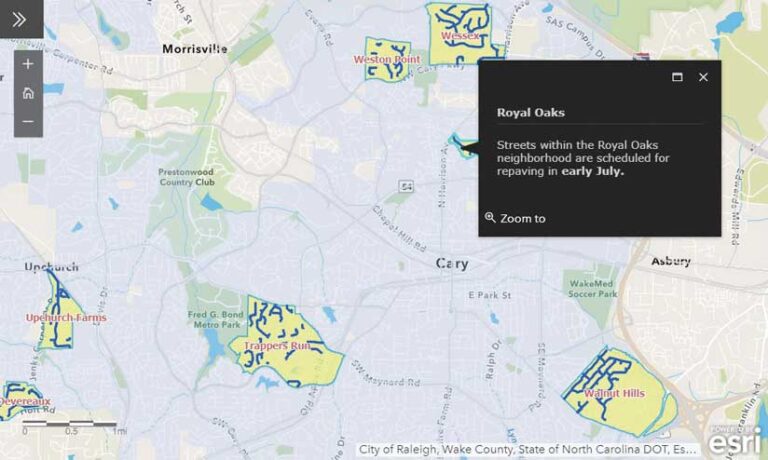
The PCS Data Dashboard helps in disseminating information to concerned residents. Cary’s 311 system lets residents easily make nonemergency requests for service or obtain answers to general questions. Residents can find out if their street is on the current list for improvements or when streets in their neighborhood were last resurfaced. They may also inquire on issues such as parking along streets, garbage pickup, landscaping repair, and weather-related delays. The dashboard lets Cary staff members quickly identify areas of concern and respond to resident queries with current information to address their concerns.
Depending on the query, Cary staff members can click on a particular year to obtain statistical data for streets by paving group and a range of rating values and analyses based on a neighborhood name. The dashboard allows zooming in to view the color-coded street segment ratings. Charted data is displayed by segment, year, and rating. Pavement distress types provide statistical data, indicating the major catalysts of street deterioration. Selecting a specific paving group or neighborhood provides a focused approach to analyzing pavement ratings across multiple street segments. These performance metrics will influence the selection of streets in the future.
Since implementing the dashboard, the Transportation Department has continued to expand the way this data is viewed and used. Every communication with the public can be augmented with geospatial intelligence. The next effort will be to develop additional geospatial intelligence for Cary’s assets, allowing residents to share in the street improvement process for the current year from start to finish.
For more information, contact Coray Davis.
About the author