Imagine that a movie theater chain wants to open a multiplex in a large American suburb. A major real estate development company was hired to scout the five best potential locations in the community for the theater. The suitable locations would depend upon a market feasibility analysis that would answer questions such as:
- Which sites would draw the types of people who frequently see films in the theater?
- Which locations would be near amenities such as restaurants, public transportation, and shopping centers?
- Which sites would have easy access to freeways and other major highways?
The real estate development firm’s in-house team of market research analysts wanted to find areas that fit those parameters. They needed to compile a complete package of demographic, spending, and lifestyle data along with maps and imagery of the areas being considered for the theater. Where can they find all that information? In ArcGIS Content, an integral part of the Esri’s ArcGIS platform.
ArcGIS Content offers maps, layers, and data—such as basemaps, demographics, lifestyles, and imagery—along with geocoding and routing. Compiled from the best available sources, such as commercial vendors, Esri user organizations, and public sources, ArcGIS Content includes global demographics and spending maps, data, and reports for more than 135 countries including the United States, Canada, Chile, France, India, and Germany.
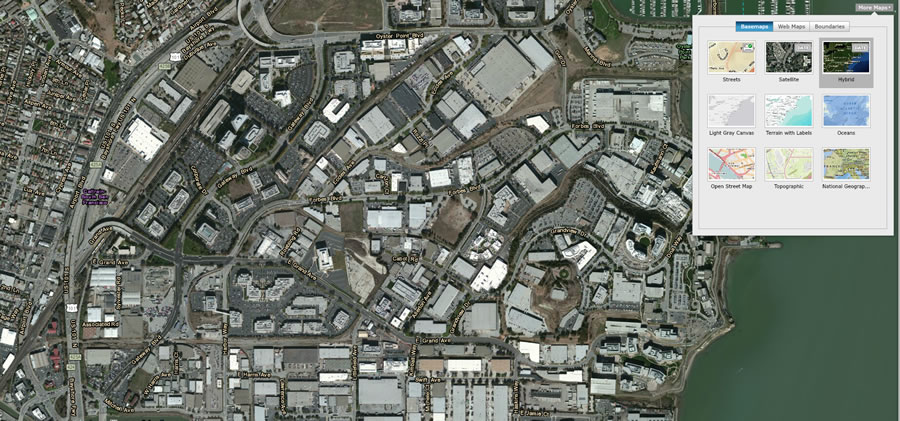
Using Esri’s ArcGIS platform, the market research team geocoded the list of potential locations to visualize them on a map and selected a basemap that provided a geographic context for each location. Available in multiple cartographic styles, the selection of basemaps include the popular World Topographic, Ocean Basemap, Light Gray Canvas, Dark Gray Canvas, World Streets, and World Imagery. The team used a detailed streets basemap to understand if vehicles had easy access and egress from every site. To get an aerial perspective of each proposed theater site, the team selected high-resolution imagery of each site. This collection of imagery enabled the client to see how close the potential theater sties were to shopping centers, landmarks, restaurants and competitors.

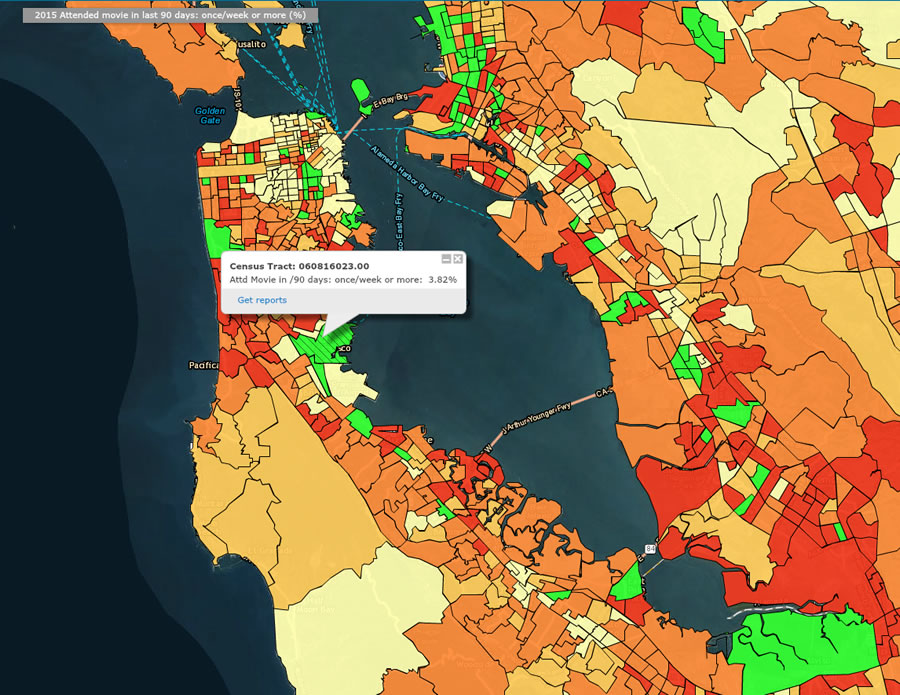
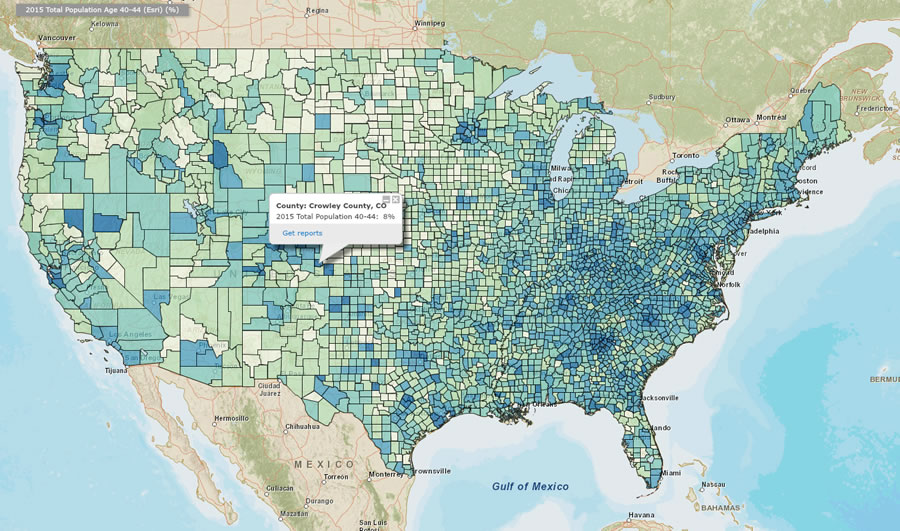
Next, the analysts overlaid data from Esri Demographicson the basemap so they could learn about demographic characteristics such as age, income, and household type of the residents who lived around each potential site. Esri’s updated US demographics includes thousands of population, household, employment, and income variables at multiple geography levels.
The team also brought in information from the Motion Picture Association of America (MPAA). According to the MPAA, the share of tickets sold in 2014 to 40 to 59 year olds was at an all-time high, while the share of tickets sold to senior citizens (people over the age of 60) was 13 percent—its highest level since 2011. From 2013 to 2014, shares from moviegoers from age 15 to 24 remained relatively stable. However, Hispanics continue to buy more tickets proportionally than their population numbers would suggest. Another interesting fact noted by the MPAA was that frequent moviegoers tend to own more key technology products than do members of the general population 18 years of age and older.
The team dug into the data to find out if frequent moviegoers as noted in the criteria above made up much of the population of each area being considered for a theater. Were they children younger than age 18; Millennials (aged 18 to 34); Generation X (aged 35 to 50 years); baby boomers (aged 51 to 69); or the Silent Generation (senior citizens in their 70s and 80s)? And were they single or married? Did they have kids? Did they earn less or more than $40,000 a year? Were they newcomers to the area or longtime residents?
The team combined Tapestry Segmentation lifestyle data with Esri Demographics to learn which types of area residents might be interested in seeing movies in a theater. Tapestry data can provide information about local residents’ product and service preferences and how these people might spend their free time. What types of media would they read, listen to, and watch, and what would they do for fun? Esri’s Tapestry Segmentation data classifies US neighborhoods into 67 unique segments based on socioeconomic and demographic characteristics.
The team analyzed the Tapestry data and learned that single people, married couples with children, and senior citizens showed a high propensity for going to the movies at the theater. Singles could go to the movies anytime, young parents might treat their children occasionally, and elders would probably take advantage of senior discounts and matinees.

Business information about area shopping centers, landmarks, competing theaters, crime, and traffic patterns provided the team with more important details. Maps enabled the team members to easily see the impact of each data type on the proposed theater locations.
After receiving the team’s detailed report with maps and imagery for each site, the theater chain carefully reviewed the information. The results of the research, displayed using maps created with ArcGIS, showed that singles, couples with children, and seniors were the groups most likely to patronize the new theater. Other elements, such as traffic, crime, and proximity to amenities, were also taken into account.
Two sites were eliminated because of traffic congestion and lack of adequate parking. Two others were scrapped because competing theaters were too close. The theater chain finally selected a site that was in a low-crime area adjacent to a popular shopping center with extensive parking, restaurants, and other amenities. Within easy distance were neighborhoods of married couples with kids, a large age 55 and older retirement community, and apartment complexes filled with young singles. Using ArcGIS Content, the theater chain could easily see that this site was the best place to open a new multiplex.
Access ArcGIS Content
You can access ArcGIS Content from the ArcGIS platform through reports, web services, infographics, and data that you can add to your spreadsheets and maps. ArcGIS Content adds context and depth to your research, analyses, and projects. For more information about ArcGIS Content, call 1-800-447-9778 or visit esri.com/data.
