
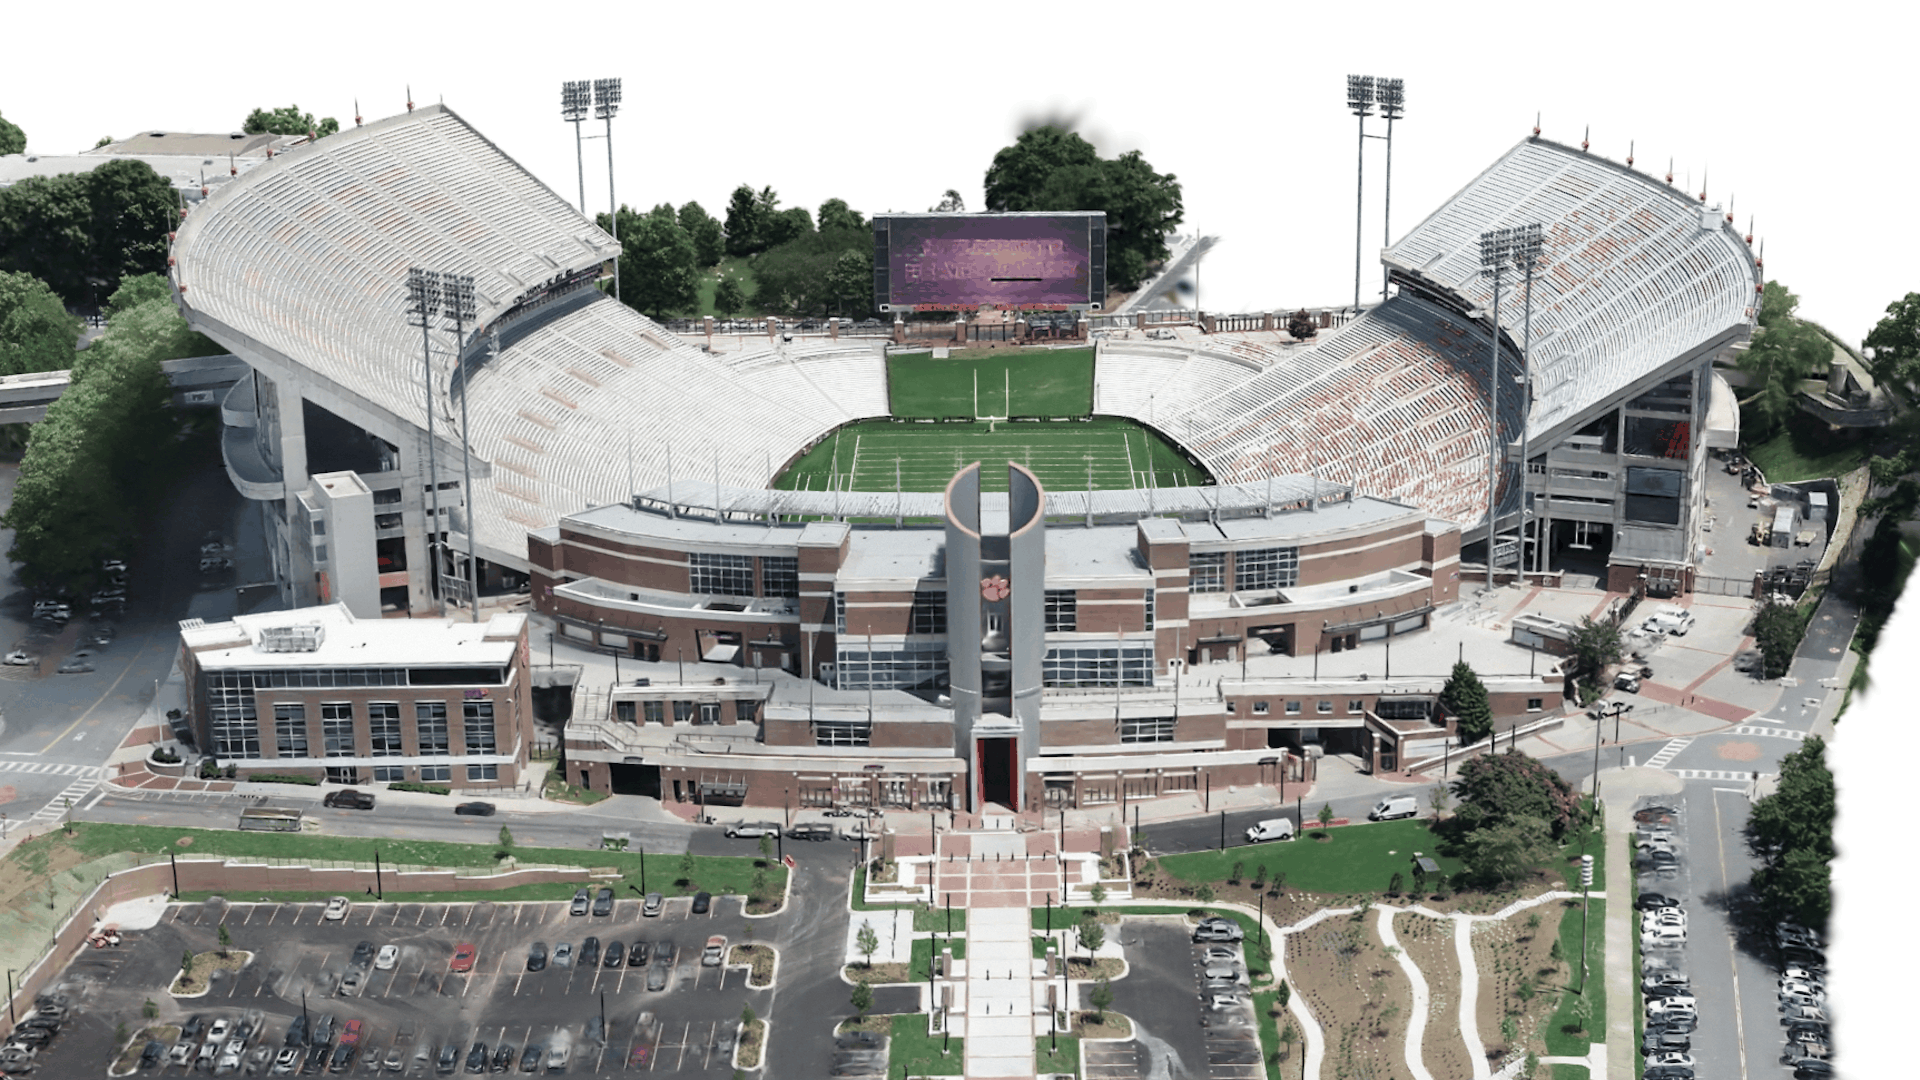
On Saturdays in autumn, more than 80,000 fans crowd into Clemson University’s Memorial Stadium—known to college football fans as Death Valley—to cheer the Clemson Tigers beneath towering light banks and amid rows of flagpoles. Opened in 1942, the stadium is one of the largest on-campus sports venues in the United States and provides a top game-day atmosphere for fans.
Now the stadium has taken on a new role: the proving ground for a photorealistic AI rendering technique called Gaussian splatting. This method turns drone photos into fast-loading, photorealistic 3D environments that Clemson uses to inspect facilities, plan construction, and teach students how to work with 3D data.
A Center Built on Curiosity
Established in 2016 and housed in Cooper Library at the heart of campus, the Clemson Center for Geospatial Technologies (CCGT) provides GIS technology services to the university. The center has been recognized for its use of GIS technologies to drive and expand research at Clemson, earning a 2023 Esri Special Achievement in GIS Award and becoming a member of the Esri Innovation Program. The center is one of only 16 higher-education schools selected nationally for this program.
“We don’t have a research agenda; we’re catalysts,” says Patricia Carbajales-Dale, executive director of CCGT. “Our mission is to support students, faculty, and local South Carolina communities, offering the latest trends and innovation.”
Jared Gingrich, the center’s drone and lidar specialist and a certified remote pilot, manages drone data acquisition, processing, and workflow development for the university. Together, Carbajales-Dale and Gingrich have expanded CCGT’s reach across campus, serving departments well beyond geography and planning.
From a Sunday Experiment to a Campus-Wide Dataset
The path to Gaussian splatting began in 2023 on a Sunday afternoon. Gingrich’s predecessor arrived at the center to test whether drone imagery of Samuel J. Cadden Chapel—a small but recognizable building near the CCGT offices—could be turned into a 3D model. Carbajales-Dale happened to be there that day and, after seeing the result, encouraged him to share the outcome in a post on social media.
The post reached the university’s planning director, who asked if the center could map the entire campus the same way. He recognized the potential to use it for facilities management and campus planning. That inquiry grew into a full 3D mesh model of the Clemson campus. The model was built from more than 70,000 drone images collected across school grounds and delivered to the facilities team.
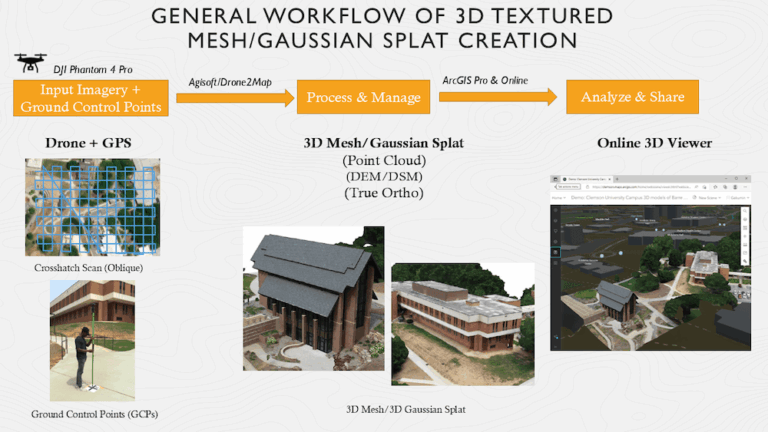
When ArcGIS Drone2Map—a desktop app for processing drone imagery into 2D and 3D spatial products—added Gaussian splat capabilities, Gingrich saw an opportunity to get a higher level of detail in photos while waiting a shorter amount of time for files to process. The center already had the imagery, and the software could generate a 3D mesh and a Gaussian splat from the same camera alignment in a single pass, ensuring a direct, apples-to-apples comparison.
Memorial Stadium, with its instantly recognizable architecture and high-profile structural features, was a natural test case.
Reprocessing Existing Data
Generating the Gaussian splat required no new drone flights. Gingrich reprocessed the existing stadium imagery via the Drone2Map app’s 3D Products template, which produces point clouds, 3D textured meshes, and Gaussian splat layers in a single workflow. Processing the stadium’s 3D mesh and Gaussian splat simultaneously took about 13 hours.
Gaussian splatting uses a form of point cloud made up of small oblong shapes to represent it rather than reconstructing the scene as a solid object. This approach allows for real-time rendering and sharp visual details from 2D images.
“Deep learning tools [also help], so you end up with a scene rendered with a really high level of detail that captures small or delicate features well, and it tends to render pretty quickly,” says Gingrich.
The Gaussian splat capability is covered by the Reality Mapping user extension, which provides all Clemson ArcGIS users access to the same 3D capabilities.
A Sharper View of Clemson’s Death Valley
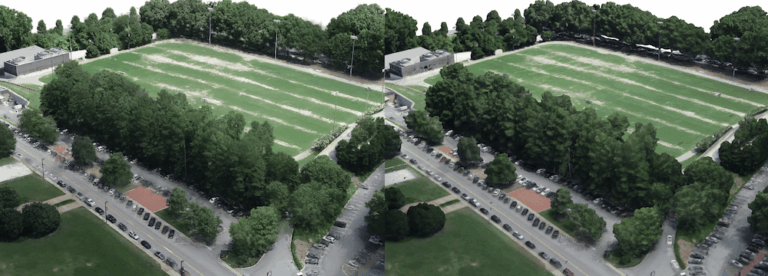
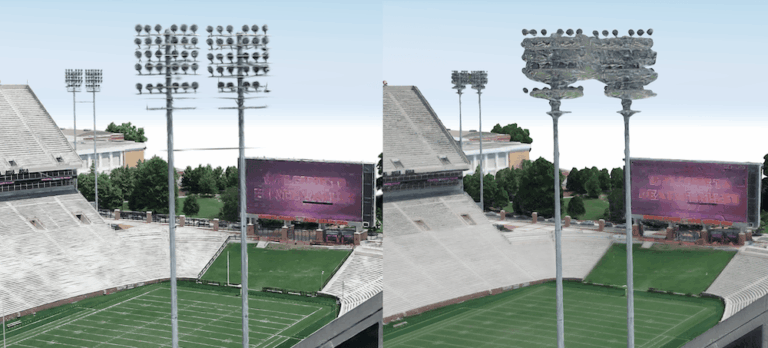
Comparing the two outputs reveals a striking difference. In the original 3D mesh, trees appear as blocky shapes, with features beneath them smeared into indistinct forms. The stadium’s tall light poles, flagpoles, and decorative spires along the upper tier have no definition at all.
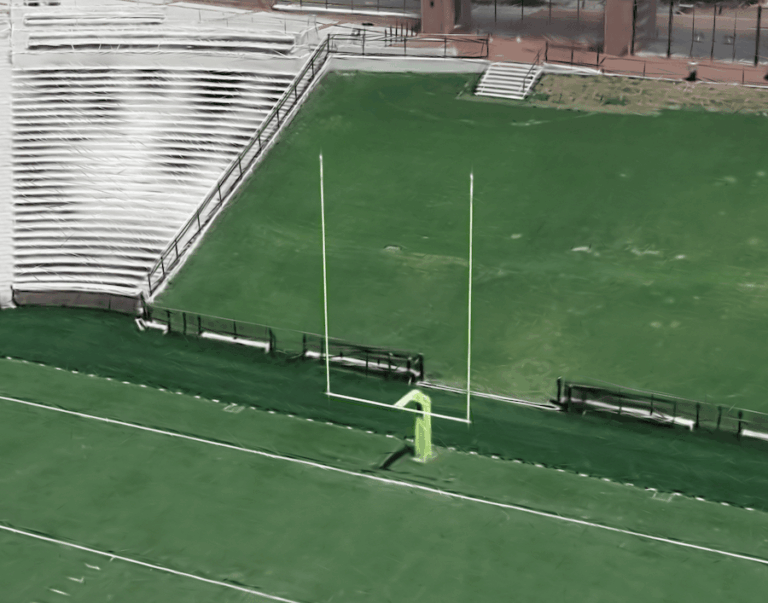
In the Gaussian splat, those same structures come into sharp focus: individual light pole geometry, clean shapes beneath overhangs, and trees with visible trunks and branches. While the campus 3D mesh had to be split into 10 segments to load without lagging, the Gaussian splat renders the stadium and surrounding area as a single segment—and loads much faster than the mesh did.
Opening Doors Across Campus
The side-by-side comparisons found an audience beyond the facilities team. Carbajales-Dale plans to share the splat with the university’s botanical gardens team, noting how the clean rendering of parking lots and tree canopies could support transportation planning and visitor navigation.
Architecture and urban planning researchers also recognized potential for layering proposed construction into the existing scene to evaluate how new buildings might affect things like sightlines or the overall character of campus. Stephanie Cooper, the university’s architect and director of planning, design, and construction, is exploring the splat as a tool for land-use management to visualize how proposed buildings would fit into the existing campus.
However, for Carbajales-Dale, the main advantage is not just the rendering quality—it’s that others on campus can now easily produce high-quality 3D images. Because Esri builds Gaussian splat generation into the same workflow the center already used for meshes and point clouds, no separate software or process is needed.
“This makes our job of teaching and promoting it much easier,” Carbajales-Dale says.
She plans to expand Gaussian splat use aggressively across campus during the fall semester, supported by a publicly available step-by-step workflow on the CCGT website as well as by guest lectures and hands-on training open to any university department. The center is currently generating a complete Gaussian splat of the main campus from its existing 70,000-image archive. It plans to begin collaborating with planning, architecture, and botanical gardens staff in the fall semester as well.
A Practical Road Map
The experience at Clemson offers a helpful plan for other campuses. Carbajales-Dale recommends that GIS technology teams at other institutions start similar programs by identifying a champion—someone in a senior role who can recognize the technology’s potential—and giving them a demonstration to showcase how GIS works and what it can produce.
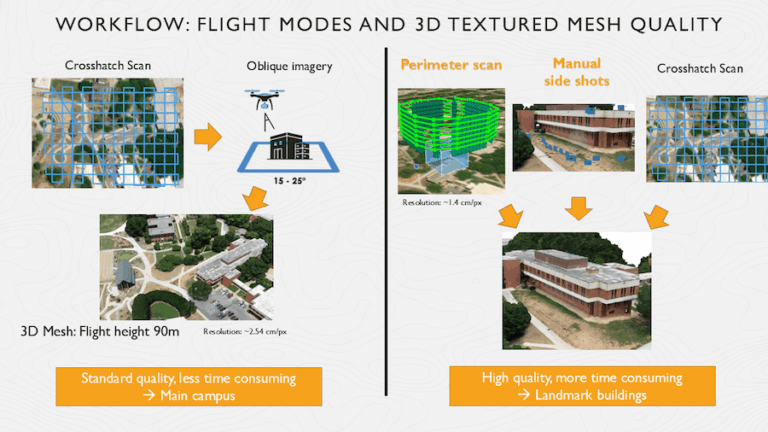
Gingrich adds that beginning with a single well-known building or structure, rather than an entire campus, gives teams room to fine-tune flight parameters, camera angles, and processing settings before scaling up. Testing and retesting is “the best way to learn how to make something that’s truly spectacular,” he notes.
For Clemson, the stadium splat is the first step in a campus-wide 3D strategy that puts photorealistic modeling within reach of every department.
For more information, email Jared Gingrich at gingric@clemson.edu.