Water is coveted in arid Arizona, especially in light of the high demands placed on the resources by a population that has burgeoned from 6.39 million in 2010 to 7.37 million today.
There’s a thirst for knowledge about water topics by both policy makers and Arizona residents, leading the Kyl Center for Water Policy at Arizona State University (ASU) to launch the Arizona Water Blueprint website containing stories and maps on water resources and infrastructure.
“The center’s mission is to promote informed public conversation about water policy that gets us to good water stewardship,” said Sarah Porter, director of the Kyl Center for Water Policy. “We want elected officials at all levels to have access to nonpartisan, science-based, and historically contextualized information about water policy and water resources.”
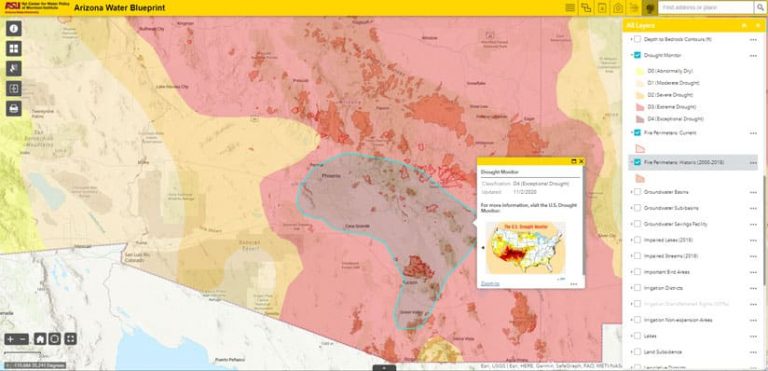
The applications on the site were created using Esri ArcGIS technology. The Kyl Center for Water Policy used ArcGIS Online and its configurable ArcGIS Web AppBuilder, along with ArcGIS Pro, to create the Arizona Water Blueprint Viewer, an interactive web application that provides a detailed picture of close to 50 data layers grouped under hydrography, infrastructure, political and regulatory, augmentation, and habitat tabs. Maps, dashboards, and pop-ups make the data very visual and informative.
Users can, for example, explore the map and see potential water infrastructure projects such as proposed pipelines and dam sites. Viewers can also see the locations of the Central Arizona Project (CAP) canal, rivers, lakes, and streams; watersheds; groundwater basins; underground storage facilities; historic and current fire perimeters; and critical habitat for birds, mammals, reptiles, fish, and amphibians.
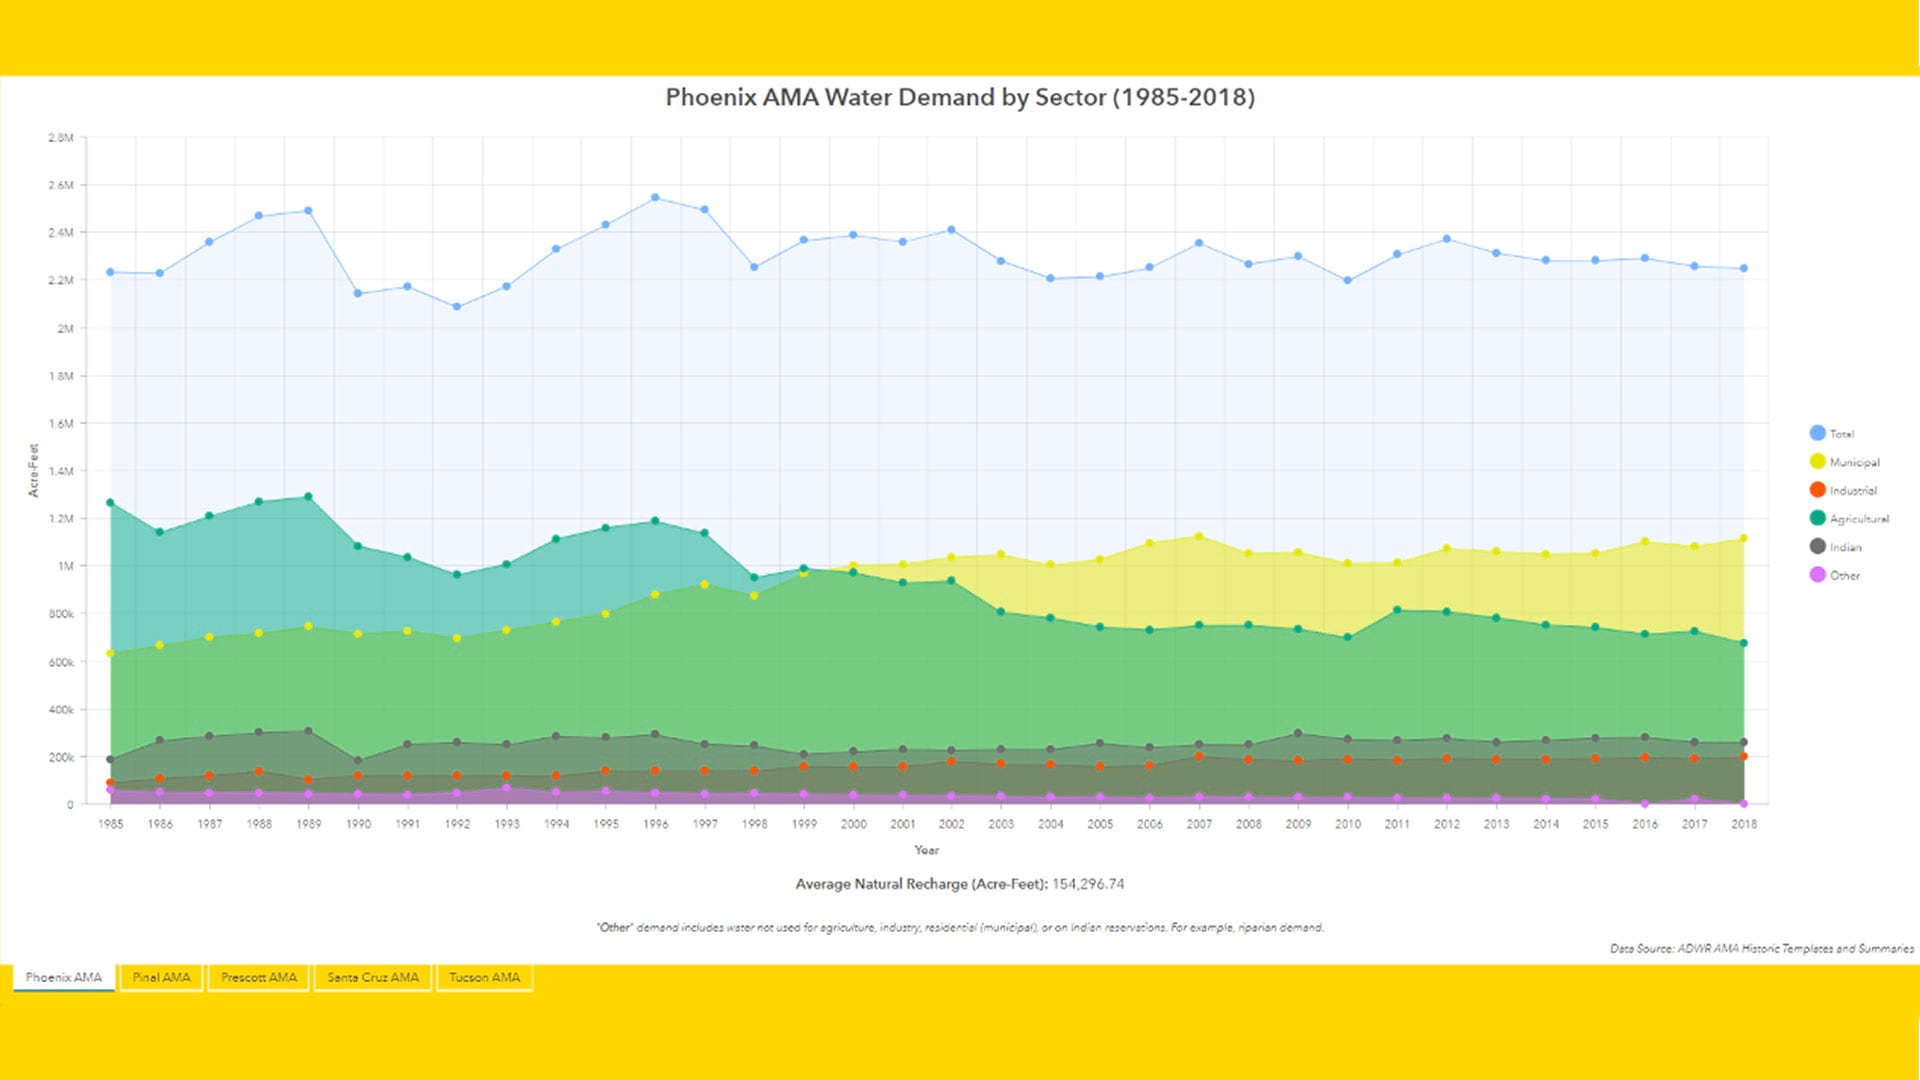
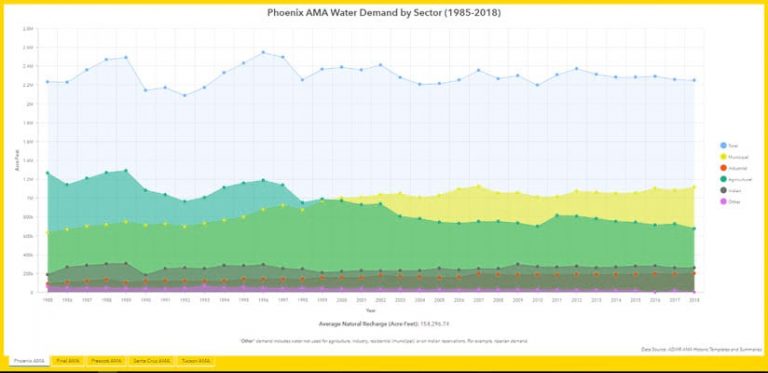
People who use the Arizona Water Blueprint Viewer can also examine other data in greater detail. For example, ArcGIS Dashboards was used to create tables such as this one that displays water demand in the state’s Active Management Areas (AMAs) by sector from 1985 to 2018. AMAs are specially designated areas in the state that faced water overdrafts and must be rigorously managed.
Most of the work on the Arizona Water Blueprint Viewer was done by two ASU graduate students, Jacob Perez and Nick Carroll. Perez earned a bachelor of science degree in political science and a certificate of study in geographic information science. Carroll is working on his master’s degree in urban and environmental planning.
ArcGIS StoryMaps and the classic Esri Story Maps templates are also being used by the Kyl Center for Water Policy to tell stories about water. A gallery of stories, which will soon grow in number, includes Rural Water in Arizona and Arizona’s Most Precious Resource: Arizona’s Water Story, created respectively using a classic Map Journal template and the ArcGIS StoryMaps app.
Susan Craig, the water policy analyst for the Kyl Center for Water Policy, contributed to two of the stories, including Rural Water in Arizona. She said that before starting the Arizona Water Blueprint project, she had never used GIS software. The apps to create the stories were very easy to use, she said.
Craig said she and Porter were deeply impressed by Esri technology when a data expert at Maricopa Association of Governments (MAG) showed them the many ways the organization uses ArcGIS.
“We immediately saw that with Esri we could build the comprehensive water data [site] we had envisioned and that keeping all the data current would be completely feasible,” Porter said.
The Arizona Water Blueprint Viewer connects directly to the services published by other agencies and consumes them using REST service endpoints and APIs.
Many of the Arizona Water Blueprint’s layers are automatically updated whenever a contributing agency responsible for maintaining its dataset updates its own layers, according to Craig.
“I’ve become a huge fan of GIS,” Craig said. “I feel we are coming into this more advanced phase, gathering more data to enable users to do advanced analysis such as determining where groundwater is declining in certain areas and where it has increased.”
To learn more about the Arizona Water Blueprint project, read this user story from the Kyl Center for Water Policy.