Tips for Working with the Terrain Layer from ArcGIS Living Atlas of the World
ArcGIS Living Atlas of the World provides the Terrain layer, a versatile raster elevation data layer you can use in ArcGIS Online, ArcGIS Pro, or ArcGIS Desktop.
The Terrain layer consists of an array or grid of cells. Each cell has an elevation value. The Terrain layer is well suited for doing mapping and analysis tasks such as drawing contours, creating hillshades, and analyzing surface properties like slope and aspect.
Because the Terrain layer is a multiscale layer, the grid cells become smaller and the terrain becomes more detailed as you zoom in. The layer displays quickly at map scales ranging from local to global because lower resolution images of the data (called overviews) are used to display the data rather than drawing every cell in the dataset. The Terrain layer will automatically display data from the source that is best suited to the scale of the current map extent. However, you can choose to work with any source available for that location. To see the sources in the Terrain layer, check out the Elevation Coverage map in ArcGIS Online.
This data at a range of resolutions comes from a variety of providers, including Airbus Defence and Space, the United States Geological Survey (USGS), and the National Aeronautics and Space Administration (NASA).
This tip uses the 24-meter resolution data provided by Airbus Defence and Space. It was added to the Terrain layer in 2018 because it has a greater global extent and higher resolution than the elevation data previously available at medium scales for many areas of the world. The Airbus data is great for use at map scales of about 1:72,000 (zoom level 13) to 1:288,000 (zoom level 11), especially in areas outside the United States where this will often be the best data available for these map scales.
Get Started
This tip teaches you how to work with the Terrain layer in ArcGIS Pro. You will need access to ArcGIS Pro, ArcGIS Online, and the ArcGIS Spatial Analyst extension.
Step 1. Ensure Spatial Analyst is enabled for ArcGIS Pro by checking your ArcGIS Online account. Start ArcGIS Pro and create a new Blank project. Add a new map to the project.
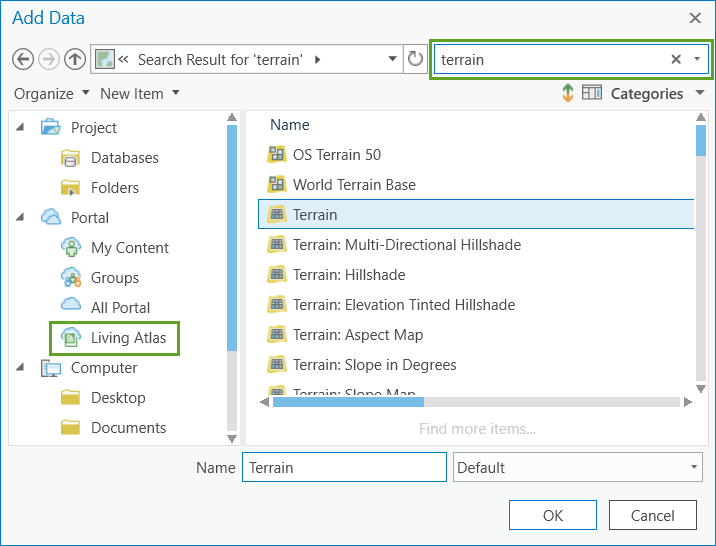
Step 2. In the Layer group on the Map tab, click the Add Data icon. In the left pane of the Add Data dialog box, select Living Atlas under Portal. If necessary, use Search at the upper right to locate the Terrain layer (choose the layer that is simply named Terrain, not other layers with Terrain as part of the name) and add it.
Step 3. In the Contents pane, uncheck the box to the left of the Terrain layer to toggle off visibility for the layer.
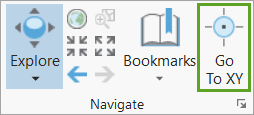
Step 4. In the Navigate group on the Map tab, click the Go To XY icon.
Step 5. In the tool near the bottom of the map view, type in -60.9 for the longitude and 8.8 for the latitude and click the Pan icon.

A green point symbol will flash in northeastern South America.
Step 6. Type 288,000 into the map scale box at the bottom left of the map view.

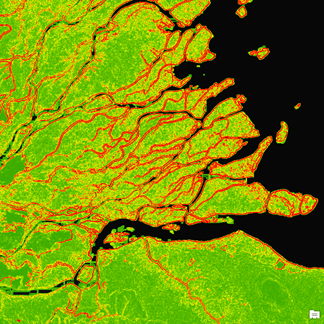
The map will zoom to the Delta Amacuro, an area in northeastern Venezuela that has an interesting and complex, fan-shaped delta.
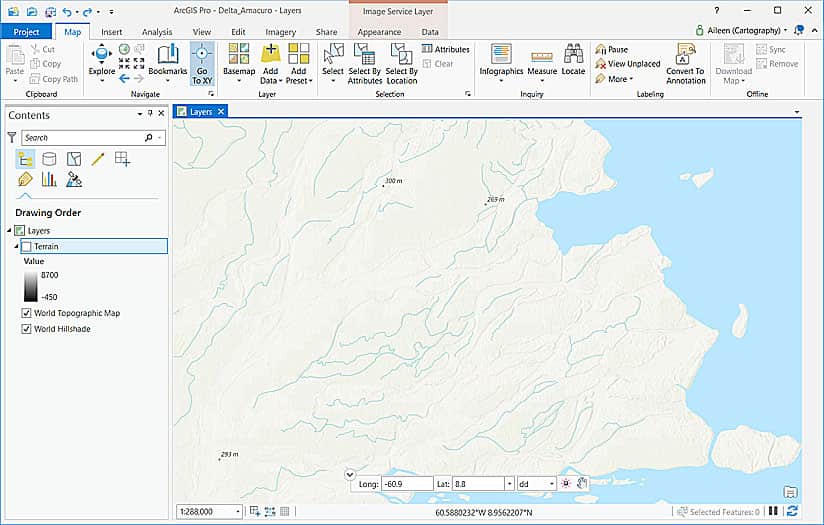
Step 7. Click the Go To XY icon to close the tool.
Specify the Data Source to Use
Specify that ArcGIS Pro uses a specific data source in the Terrain layer by setting a definition query as a property of the Terrain layer.
Step 1. In the Contents pane, right-click the Terrain layer and click Properties.
Step 2. In the left pane of the Layer Properties: Terrain dialog box, click Definition Query. In the right pane, click the SQL button at the top and type in the following clause: ProductName = ‘Airbus_WorldDEM4Ortho_24m’. Click the green check mark to validate the expression and click OK to apply it.
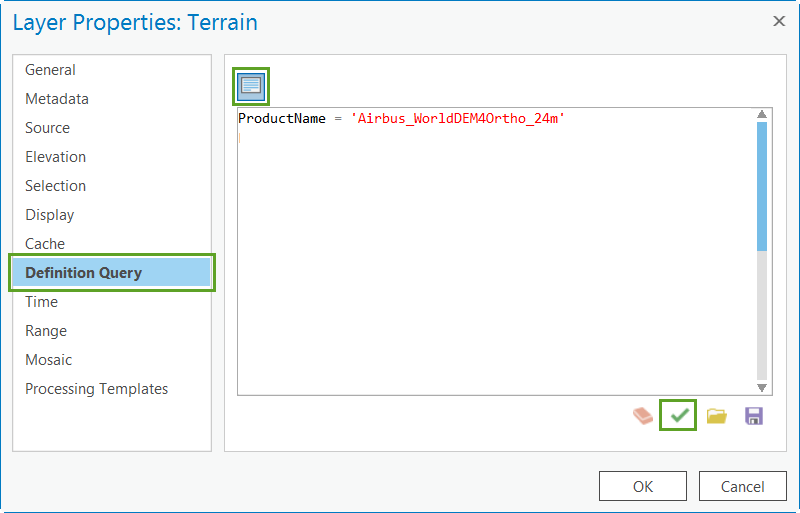
Step 3. In the Contents pane, toggle on visibility for the Terrain layer.
Display the Terrain Data
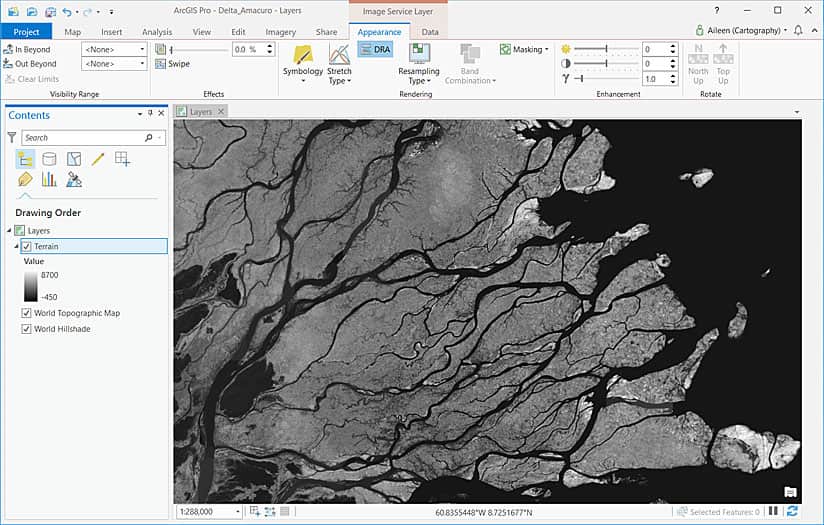
The Terrain layer will appear black because ArcGIS Pro is trying to display the layer using information about all the data in the dataset. Instead, you want to display the layer using information about the data in the current view.
You can use the dynamic range adjustment (DRA) feature to do that. DRA will automatically adjust the display based on only the pixel values for the data in the current view. As you pan and zoom, the display will update automatically to use information about the pixels in the new view.
Note: It is best to use the DRA feature in ArcGIS Pro 2.1 or later versions.
To use the DRA feature, click the Appearance tab and click the DRA icon.
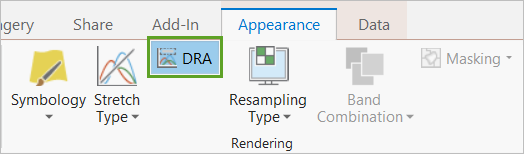
Note: The DRA feature is also available on the Symbology pane, which will be explained later in this tip.
The map display will update to show the data.
Analyze the Terrain Data
You can now analyze the terrain data using a variety of methods in ArcGIS. A great way to do this is to use raster functions, for which the ArcGIS Spatial Analyst extension must be enabled.
Raster functions are operations applied on the fly directly to the pixels of imagery and raster datasets. Only the pixels in the current view are processed, and the output is a virtual raster layer. This can save storage space and processing time, especially if either the map extent or raster dataset is large. This is often the case for the terrain data. In addition, ArcGIS Pro makes it easy to find and use raster functions that are designed specifically for the kind of elevation data that is in the Terrain layer.
To analyze the Terrain layer data using a raster function, follow the steps below:
Step 1. In the Contents pane, select the Terrain layer.
Step 2. Click either the Analysis or Imagery tab and click the Raster Functions icon.
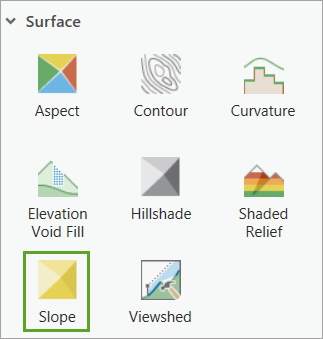
Step 3. Expand the Surface category and click the Slope function.
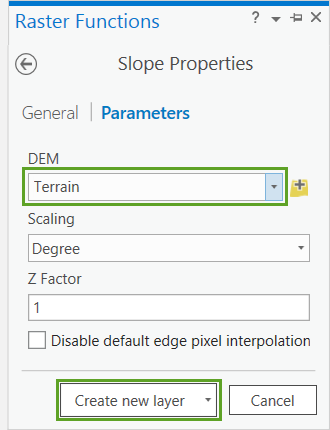
Step 4. Select Terrain from the DEM drop-down menu and click Create new layer.
The Slope_Terrain layer is added to the map and displayed in the Contents pane. The layer will appear black because the map is again being displayed using information about the entire dataset rather than the current view.
Symbolize the Slope Layer
Follow the steps below to change the map display using the DRA feature on the Symbology pane and other symbology options.
Step 1. In the Contents pane, select the Slope_Terrain layer, click the Appearance tab, and click the Symbology icon.
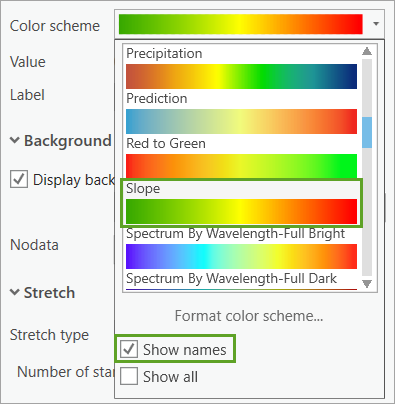
Step 2. In the Symbology pane for the Slope_Terrain layer, click the arrow to the right of the color scheme, check the Show names check box, and select the Slope color scheme.
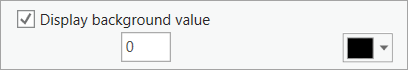
Step 3. Check the Display background value check box and change the color to black. This will change the cells with a value of 0 to black.
Step 4. Select Standard Deviation from the Stretch type drop-down menu.

Step 5. Select DRA from the Statistics drop-down menu.

Step 6. Close the Symbology pane.
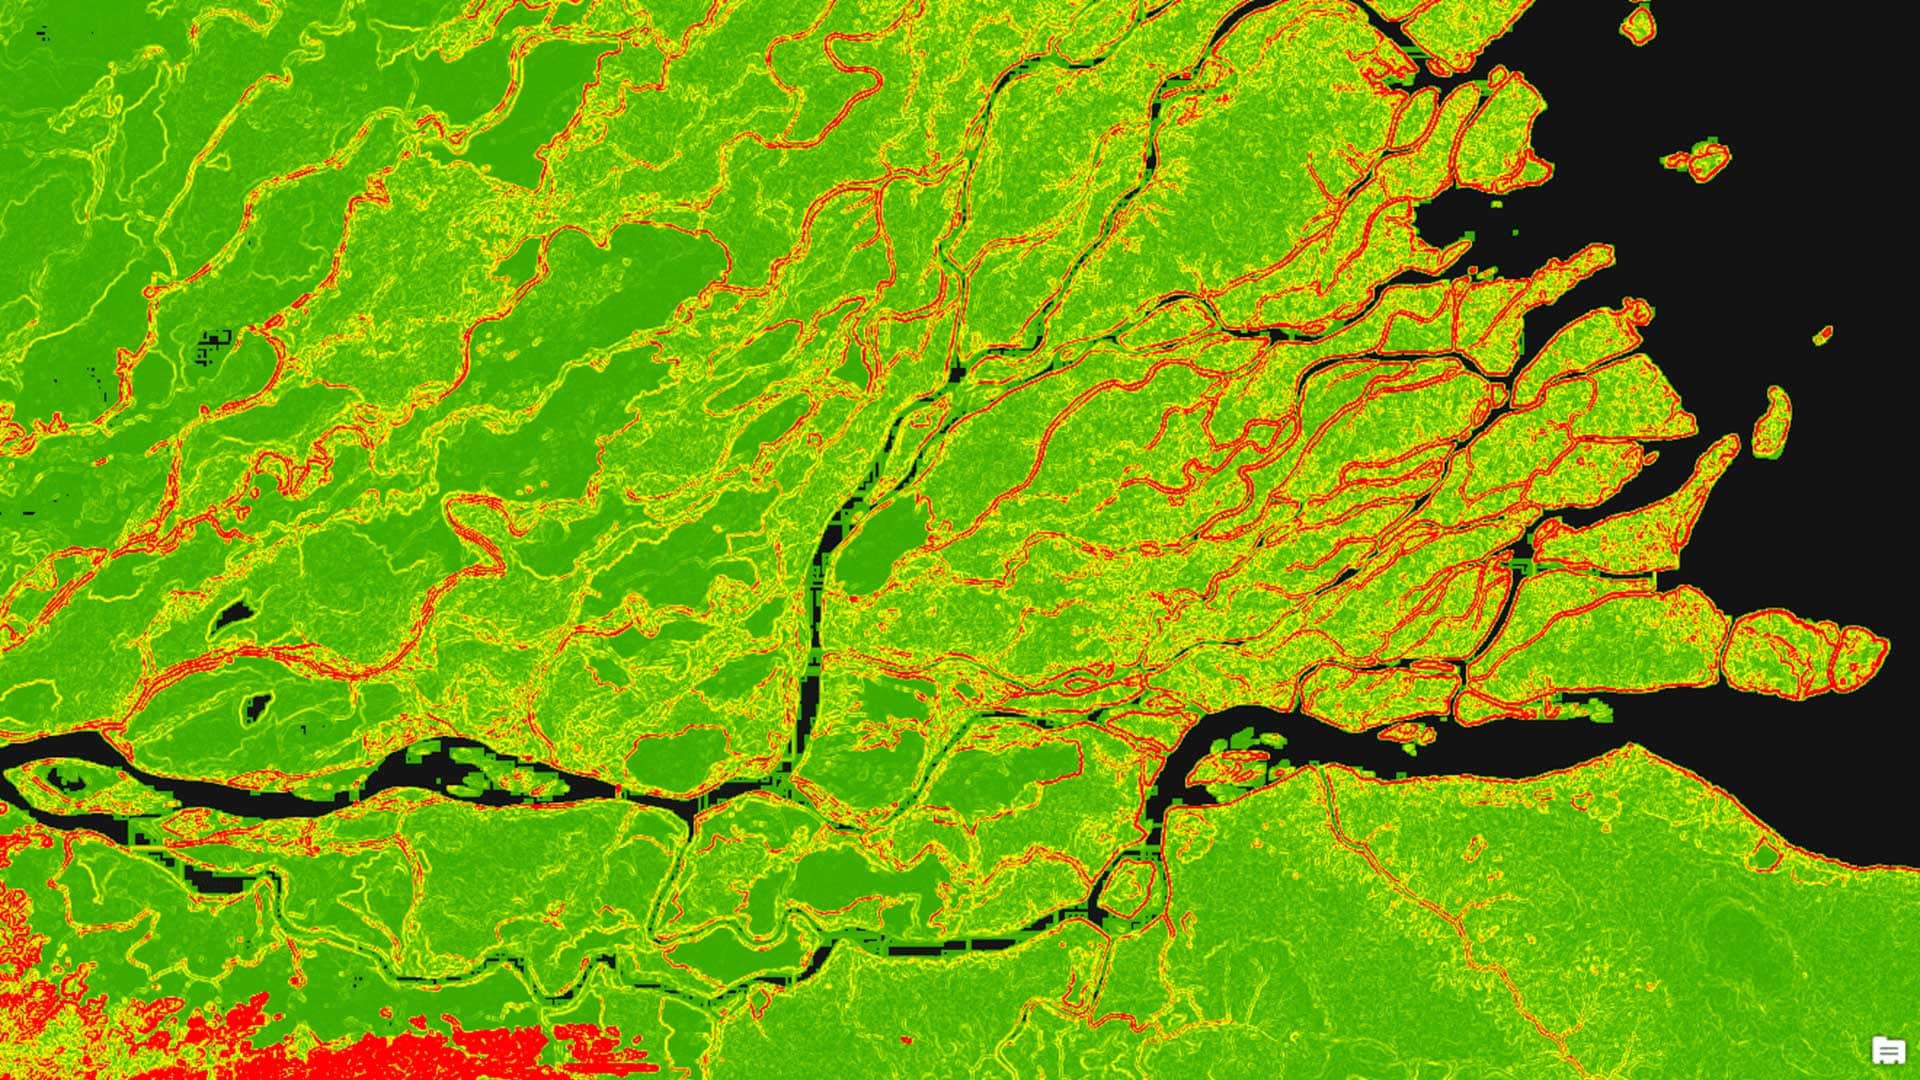
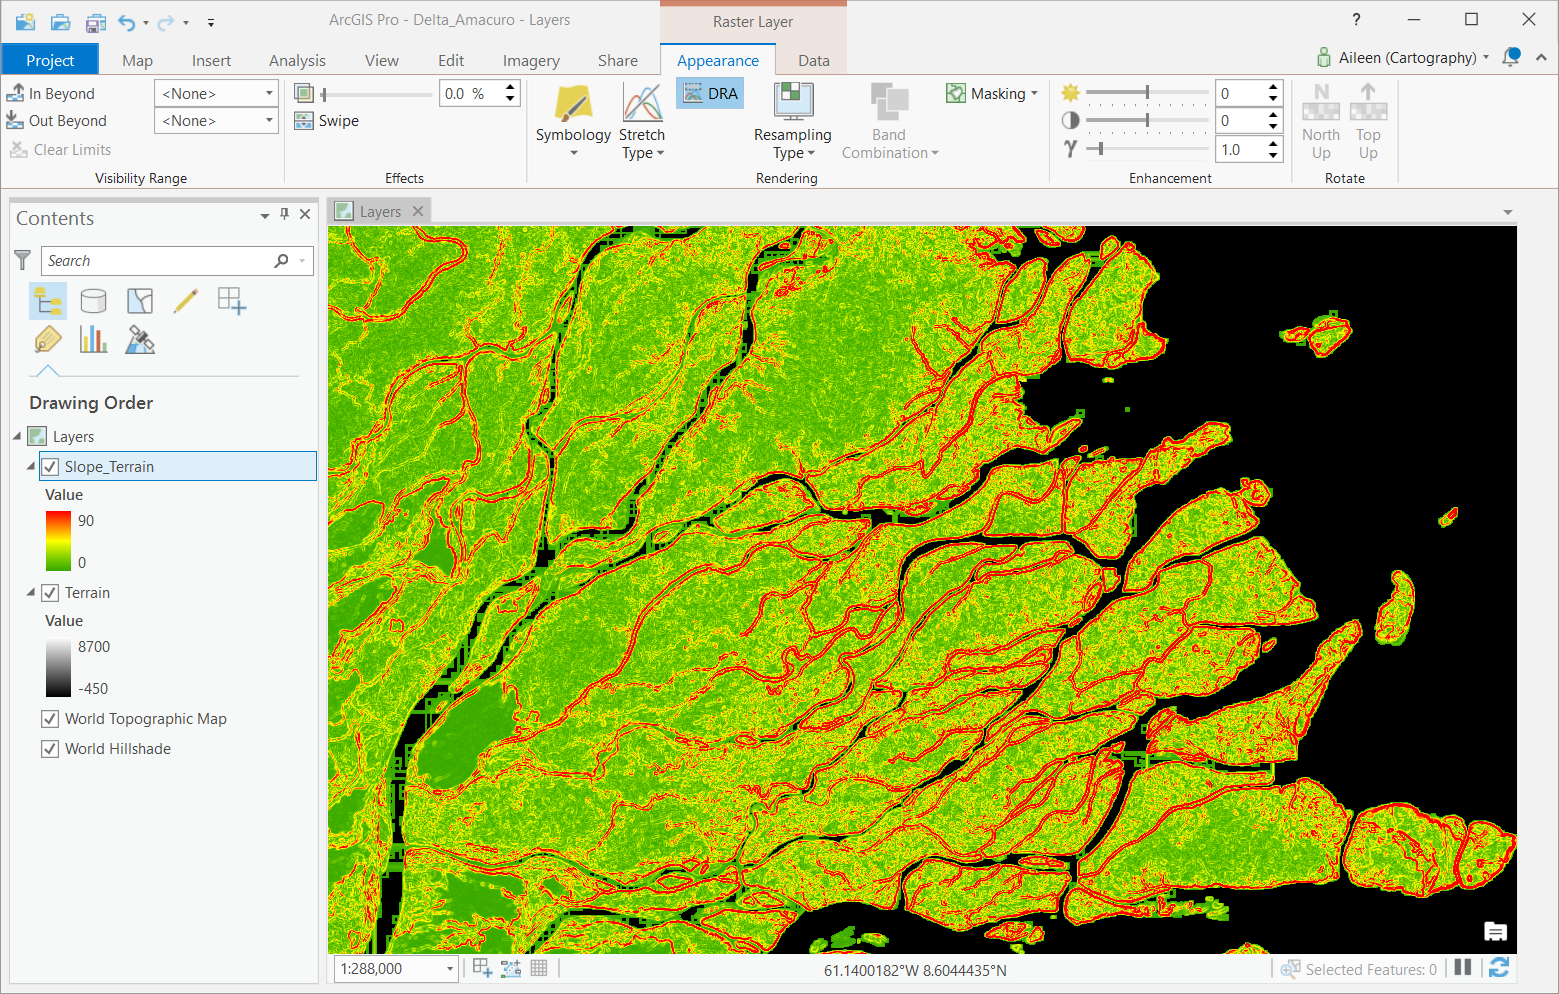
The map will update as shown below.
Evaluate the Results
The slope layer reveals some interesting characteristics of the low-lying river delta that are not apparent on the topographic basemap. You can use the Swipe tool to compare features on the topographic basemap with those on the final map.
Step 1. In the Contents pane, toggle off visibility for the Terrain layer and make sure the Slope_Terrain layer is selected.
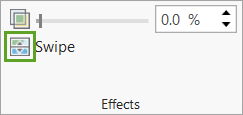
Step 2. On the Appearance tab, click the Swipe icon in the Effects group.
Step 3. Place the cursor in the map view near one of the edges to see the arrow for the Swipe tool.
Step 4. Drag the cursor toward the opposite side of the map view to see the underlying topographic map.
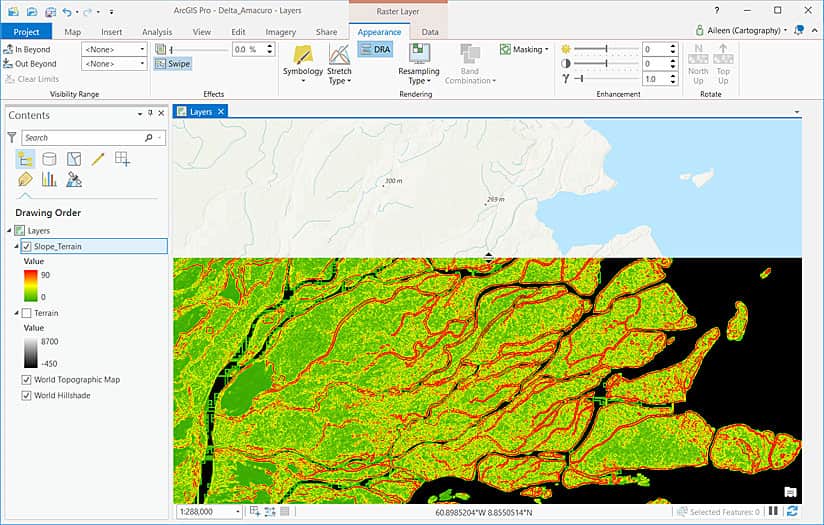
On the final map, areas with higher slopes (in red) help to clearly distinguish the river channels from the lower slope areas (in green). Intermittent or historical channels (in yellow) can also be identified.
Take some time to experiment with different areas of interest, Terrain layer data sources, raster functions, color schemes, and symbology options. You may be surprised at what you find!
To learn more about the Airbus data, read these two blog posts:
- Airbus WorldDEM4Ortho in ArcGIS Living Atlas of the World
- Airbus WorldDEM4Ortho in Esri 3D elevation services
To learn more about raster functions, see this online help topic.
