
“Geodesign is a big tent!” exclaimed Harvard University’s Stephen Ervin during the closing remarks of the 2019 Geodesign Summit.
In that moment, Ervin—assistant dean for information technology at Harvard University Graduate School of Design—summed up one of the most unique and powerful aspects of geodesign: its inherently inclusionary nature. As a collaborative design process that’s systematically informed by geographic data and analysis, the geodesign framework and supporting GIS technology are being increasingly leveraged by diverse industries and professions seeking to create a better future. One such area of recent growth comprises the architecture, engineering, and construction (AEC) professions, which will be a highlight of the next Geodesign Summit, to be held February 24–27, 2020.
This year’s summit—which was held in February at Esri headquarters in Redlands, California—celebrated its 10th anniversary in concurrence with Esri’s 50th anniversary. Over the past decade, the summit has attracted growing numbers of geodesign practitioners from a wide variety of fields including conservation, urban planning, agriculture, economics, and environmental science. This proves that geodesign can be applied to address all manner of challenges.
As the geodesign community has grown, the Geodesign Summit has provided an atmosphere of inclusion to showcase the diversity of geodesign applications across sectors. The breadth of topics discussed by presenters this year demonstrated the reach of geodesign into new domains, like urban economic policy and seaport management, while providing new angles on more familiar topics like community planning and design.
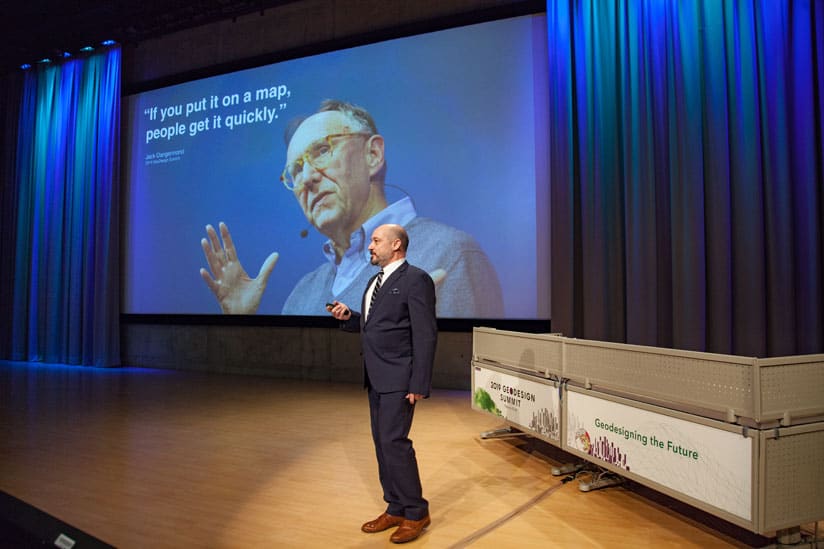
At the 2019 summit, Joe Minicozzi, a principal at the planning firm Urban3, provided a fascinating look at how geospatial technology can be used to analyze the economic value of land. His presentation, Mapping Dollars and Sense of Land Use, highlighted the biases toward suburban growth that are baked into public policy systems in many American cities. Using GIS to model where the highest tax revenues are generated, versus where tax dollars are spent, Minicozzi revealed how suburban development is driving many cities into debt. In essence, these cities subsidize suburban development by dipping into downtown building revenue to pay for parking and roads that support the suburbs. His firm uses ArcGIS Pro to generate an “economic MRI,” a 3D visualization of economic value across a city. This visualization helps communities understand—in a spatial context—disparities in tax revenue and spending. Minicozzi quoted Esri president Jack Dangermond to emphasize the importance of conveying this information spatially: “‘When you put it on a map, people get it,’ Dangermond would say. So we do the map.”
Minicozzi’s lecture had clear ties to keynote speaker Carlton Ward Jr.’s call for a referendum on suburban sprawl to conserve what remains of what Ward refers to as “wild Florida,” the home range of the iconic and endangered Florida panther. Ward asserts that mapping the path of the panther shows us where and what to protect to support environmental sustainability. If Ward’s assertion is correct, then Minicozzi’s mapping of tax revenue shows us where and how to develop to support economic sustainability. These visions go hand in hand, showing us how to create thriving communities nestled within vibrant, connected landscapes.
In the Netherlands, the Dutch are using geodesign to address economic sustainability and growth. Marten Hogeweg of Esri Professional Services presented a project that was conducted with the Port of Rotterdam, entitled PortOptimizer: Planning for Growth without Growing. Hogeweg explained that six years ago, the Port of Rotterdam had no GIS. Since then, Esri has assisted port staff in implementing GIS to optimize their business processes, one of which is strategic planning. The port is faced with maintaining its status as a major hub in Europe, but without the space to physically grow.
“The saying goes that God created Earth, but the Dutch created the Netherlands,” Hogeweg said. “When the Dutch run out of land, they reclaim it.”
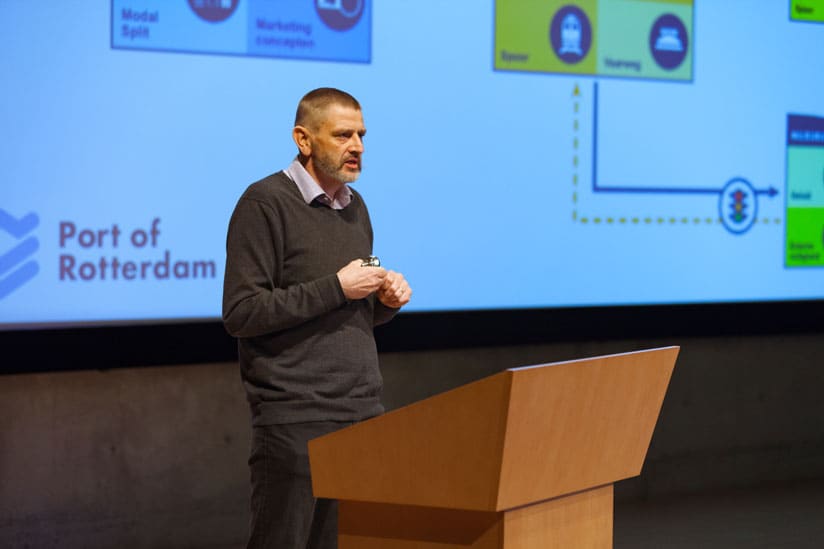
Since the 1970s, the port land area has expanded west, but it has reached the limits of that trajectory. It was important for the port to understand how its scarce space was being used and how different spatial arrangements of container storage and uses could be leveraged to maximize growth and productivity. Several alternatives were designed in ArcGIS Pro to test ideas for optimizing the use of space. Insights for ArcGIS and dashboards were then used to compare performance across those alternatives. In this way, the Port of Rotterdam was able to see a path to economic growth, without growing in physical size.
Innovation in measurement, modeling, and visualization was a notable trend among presentations this year. Ronald Kellett, from the School of Architecture and Landscape Architecture at the University of British Columbia, Canada, and Jon Salter, associate director of education and research with Esri Canada, gave a presentation called Energy, Emissions, and Urban Form—A Cross-Scale Simulation Approach. They demonstrated how mapping and modeling energy demand in cities can help decision-makers understand the connection between the underlying zoning that governs the density and type of development in a city, and environmental and economic sustainability in the long term.
Kellett and Salter’s research used Esri CityEngine to generate different zoning and build-out scenarios, illustrating how variations influence factors like energy use, emission rates, mobility, and livability in a city. This marriage of GIS technology and geodesign methods illustrates the power of data-driven policy and design.
Presentations at the 2019 summit also included case studies of geodesign in action, demonstrating how data driven-design has supported smart growth in communities around the globe.
The County of San Bernardino in California used geodesign tools and technology to create its Countywide Plan. San Bernardino County partnered with PlaceWorks, an Esri partner, to develop the Countywide Plan as a comprehensive guide to future growth and decision-making. One crucial element of the plan is land use. Colin Drukker from PlaceWorks explained how geodesign and GIS helped staff determine the optimal land-use balance to accommodate future growth under current development constraints.
San Bernardino County is the largest county in the United States geographically, but only 18 percent of the land can be developed because the rest is under federal control. That puts a strain on planning for future housing needs. The county estimates the population, now estimated at 2.1 million, will increase by 35 percent by 2035. Plus, there are competing land uses. San Bernardino County is one of the few places where rare earth minerals used in cell phones and other consumer electronics and hybrid and electric cars, are mined outside Australia and China. Balancing the need to accommodate future population growth with the necessity to expand crucial mining operations within the same area presented a challenge.
The county used GIS to evaluate potential areas to expand mining operations and housing development, working with local communities to determine opportunities for alignment. In collaboration with Placeworks, the County used geodesign to understand the most suitable locations for each land use within the constraints of existing infrastructure, land ownership and other factors.
While many of the same zones for mining were also prime locations for housing, one area stood out as an ideal location for population growth and community development that fell outside potential resource extraction zones. The town of Apple Valley, located in the high desert in San Bernardino County, happened have a growth plan that aligned with San Bernardino County’s need to allocate forecasted population growth.
Ultimately, by aligning the growth plans of San Bernardino County and the town of Apple Valley, the county was able to accommodate growth in an area suitable for development, while allocating valuable mineral resource zones for future mining operations.
The Countywide Plan will be unique in its delivery. Rather than a voluminous printed PDF the entire Countywide Plan is presented in a web-based story map, making it easier to access, update, and link to useful resources pertaining to key issues. The county’s 20,000 employees across 42 departments, as well as the state, federal, and regional agencies that work with the county, now have universal access to this living document. This online format allows greater transparency and quicker updates, while fostering an atmosphere of sharing and collaboration that makes the country’s largest county feel like one of its smallest communities.

While the diversity of topics at this year’s summit is something to celebrate, next year’s event is slated to expand the reach of geodesign even further. The geodesign work being undertaken by AEC firms worldwide is one such area of expansion anticipated for next year’s Geodesign Summit.
The meeting of the International Geodesign Collaboration (IGC)—an organization of more than 90 universities conducting geodesign projects around the world—will take place February 22–24, 2020, just prior to the summit.
Each year that passes, the force of geodesign in our communities reminds us that traditional concepts of design have changed. Designers are no longer limited to the design of autonomous objects like buildings, cars, or furniture. Rather, the advent of geodesign and GIS have allowed us to imagine and test whole ecologies of design experiences that touch on many disciplines, industries, scales, and technologies—a big tent indeed.
Learn more about geodesign.