The 2020 Esri Developer Summit (DevSummit) went virtual this year, drawing an online audience of more than 6,000 viewers via the livestream on esri.com and the Esri Facebook page. The event was held online due to concerns about the global coronavirus disease 2019 (COVID-19) pandemic.
App developers and others who livestreamed the event heard about the latest innovations in ArcGIS from a team of more than two dozen Esri developers, product engineers, and product managers. Over the past year, the development team has added new or improved capabilities to ArcGIS in areas such as mapping and visualization, spatial analysis and data science, deep learning and 3D mapping, custom web app development, and natural language processing. A new project to integrate ArcGIS with the capabilities of the gaming engines Unity and Unreal Engine is also underway.

According to Euan Cameron, chief technology officer for developer technology at Esri, game engines bring developers a physics engine, animation, and particle systems to the app development environment. As a developer himself, Cameron said he was excited about what these capabilities can do. “[These] allow you to build experiences that come alive,” he said.
Jim McKinney, chief technology officer for ArcGIS Desktop, opened the DevSummit Plenary session thanking the developer community and welcoming them to the event, now in its 15th year.
“Our goal is to share with you new technology, which you can do amazing things with—technology that is going to make your [work] more effective,” said McKinney in his introduction to the three-hour event.
Esri president Jack Dangermond lauded the developers for what they do to help organizations create what he called “a digital transformation using geographic science.”
Dangermond said that the digital transformation, with the support of geospatial app developers, is driving advances in precision agriculture, conservation, public safety, public health, and forestry and water resource management.
“This doesn’t happen by chance. It’s not out of the box,” Dangermond said. “It requires the creativity of you who are here and online around the world, engineering and thinking.”

What the ArcGIS Platform Can Do for Developers
Esri director of software development Sud Menon gave a high-level overview of the Esri ArcGIS platform, which integrates many data types including imagery, vector features, real-time, multidimensional, unstructured, tabular, 3D, lidar, and CAD/building information modeling (BIM) and other data types.
“It extracts all this data into layers to create a common language of maps, scenes, models, and tools that can be used by creators and analysts as well as to power applications,” Menon said.
He highlighted the capabilities of ArcGIS Online, a cloud-based mapping and analysis solution, to deliver important information to an audience. “ArcGIS Online is a platform that allows you to create and share mapping applications that communicate important information at scale,” Menon said. “A single trending mapping application such as the live coronavirus dashboard from Johns Hopkins [University] may receive many thousands of requests per second and have millions of concurrent users.”
The COVID-19 dashboard from Johns Hopkins University, maintained at the Center for Systems Science and Engineering at the Whiting School of Engineering, was built using ArcGIS Dashboards from Esri.
Visualizing Information in a New Way
The product presentations kicked off with a focus on mapping, the foundation of GIS technology, and ArcGIS API for JavaScript, which powers the web mapping capabilities for both 2D and 3D visualizations.
“Mapping is at the heart of what we do,” said Jeremy Bartley, group development lead for ArcGIS Online and ArcGIS API for JavaScript. “We want to enable everyone to make amazing maps though dynamic and data-driven styling.”
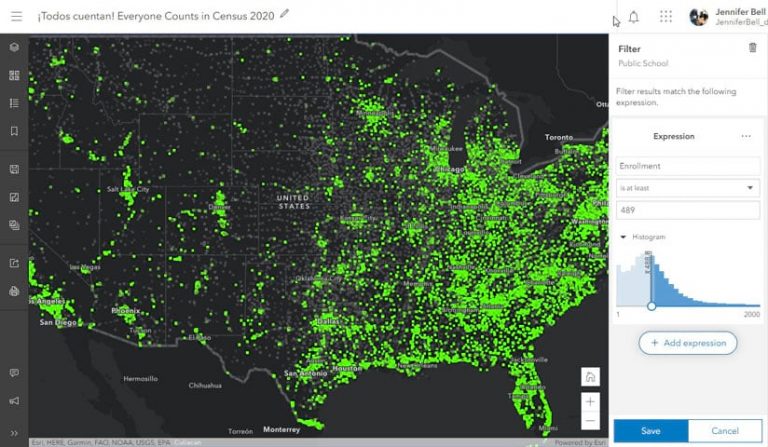
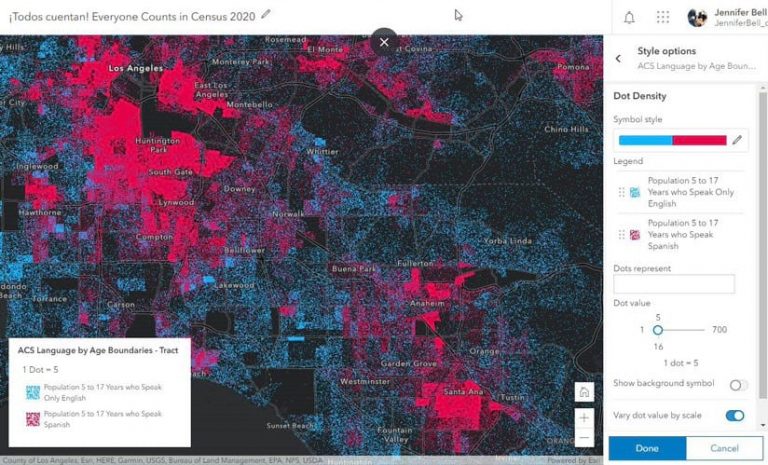
Jennifer Bell, senior product engineer from the ArcGIS Living Atlas of the World team, then demonstrated how capabilities in the new Map Viewer in ArcGIS Online, including fast filtering, enhanced labeling, and a dot density tool, make it easier to author useful and beautiful maps.
In her scenario, volunteers who visit Los Angeles area schools to encourage hard-to-reach Spanish speakers to participate in the US Census could use the Map Viewer in ArcGIS Online to better focus their efforts. They could create a map to locate where Spanish-speaking children aged 5 to 17 attend school.
Bell showed how to create such a map using tools such as filtering, dot density, and ArcGIS Arcade, customizing it to find exactly which schools in the Los Angeles area have 1,500 or more students who are Spanish speakers.
“These new updates [to ArcGIS Online] are all about exploring and understanding your data so quickly that you have the time to experiment, be creative, and ask deeper questions,” she said.
To see the presentation by Bartley and Bell in its entirety, watch this video.
Get the Most out of Your Data
Around the world, organizations are increasingly using dashboards to communicate a wide range of information clearly, including data on crime, public health, elections, and the environment.
“Dashboards unlock information hidden in your data and allow it to reach its full potential,” said David Nyenhuis, product engineer on the ArcGIS Dashboards team. “They are interactive and engaging. Charts, indicators, and gauges summarize complex datasets and help inspire smarter decisions.”
In his presentation, Nyenhuis said that users can author expressions in ArcGIS Arcade to modify how data is displayed in ArcGIS Dashboards. Arcade is a scripting language for creating custom visualizations and labeling.
He demonstrated a dashboard created for a fire department chief monitoring calls for service in real time. The dashboard includes information such as the call volume; an incident feed with a brief description of the problem and a time stamp; a map displaying the incident locations; and the 30-day average dispatch, turnout, and response time.
Nyenhuis then showed how, right inside ArcGIS Dashboards, an ArcGIS Arcade editor can be used to write a simple expression to convey and display how long an incident has been opened and when it was cleared. “[With an ArcGIS Arcade expression], we can even reveal whether an incident is meeting or exceeding department guidelines for response time,” he said.
To watch the full presentation by Nyenhuis, view this video.

New Developments
Although support for ArcObjects for building custom GIS solutions will continue for years, McKinney encouraged the developer community to shift its focus.
“If you are doing new development work, we strongly encourage you to use our latest developer technologies for ArcGIS Enterprise and ArcGIS Pro and to build stand-alone apps using ArcGIS Runtime,” he said.
ArcGIS Pro SDK for the Microsoft .NET Framework, which now uses Visual Studio 2017/2019, supports customization for ArcGIS Pro.
McKinney said you can extend ArcGIS Pro using ArcGIS Pro SDK for .NET in three ways: using add-ins, solution configurations, and plug-in data sources. In this presentation, Wolfgang Kaiser, senior project engineer on the ArcGIS Desktop team, shows how he created a custom solution with the ArcGIS Pro SDK for .NET add-in and its StreamLayer API to create an add-in for streaming live location data from tour helicopters in Hawaii and then visualize them in a 3D environment.
New in ArcPy
McKinney also strongly encouraged the audience to start using ArcPy and its Python modules for doing geoprocessing tasks in ArcGIS such as conducting geospatial analysis.
Besides adding new geoprocessing tools in ArcPy, Esri is simplifying the use of the tools. “[This results] in fewer lines of code you have to write to get your work done,” said McKinney. In this video, you can watch Rachel Applebaum, a product engineer on the ArcGIS Network Analyst team, using ArcPy.nax, a new ArcGIS Network Analyst ArcPy module, to quickly and more easily access network analysis functionality.

Custom Web Apps Get a Boost
Major improvements to ArcGIS API for JavaScript are driving some big changes in custom web application development. Case in point: Developers can now build highly interactive web apps for visualization and analysis of large datasets.
Kristian Ekenes, a senior product engineer on the ArcGIS API for JavaScript team, demonstrated a custom web app called One Ocean, developed with ArcGIS API for JavaScript, which uses a global layer that includes attributes on ocean temperature, salinity, and the speed and direction of ocean currents at various depth levels. This data was derived from the Ecological Marine Unit dataset from Esri.
“I’ve configured this application so as the user hovers a mouse over a point [on the map], it executes a query for the salinity attribute at all of the levels of depth throughout the ocean available on the client,” Ekenes said. The salinity numbers quickly appear in a scatterplot to the left of the map.
“I get that fast performance because I’m taking advantage of the very fast client-side query engine of JavaScript API,” he said. Watch Ekenes’s presentation in its entirety.
ArcGIS: A Spatial Analysis and Data Science Platform
Jay Theodore, chief technical officer of ArcGIS Enterprise at Esri, walked the audience through how ArcGIS supports a complete workflow process: data preparation/engineering, visualization and exploration, spatial analysis, artificial intelligence integration, and big data analytics using modeling and scripting.
Esri staff highlighted the work done this past year with multidimensional raster data collected by satellites, along with advances in mapping and analyzing unstructured data, lidar, and full-motion video. Watch this video to see Theodore’s presentation, along with a demonstration that uses ArcGIS API for Python and ArcPy in ArcGIS Notebooks.

The DevSummit audience also got to see an interesting demonstration of how ArcGIS can be used in the process of extracting geospatial data from unstructured text and then mapping that information.
Lauren Bennett, lead product engineer for spatial analysis at Esri, showed how she used the arcgis.learn module in ArcGIS API for Python to help extract and map data from 1,500 text files of crime reports.
“Each of these reports is unstructured text that has a description of the crime, including things like the address, the date and time, and other details,” Bennett said. “Traditionally, turning this kind of unstructured text into useful data would be really time-consuming.”
Bennett created training data for deep learning (DL) by labeling certain aspects of the reports, including the type of crime, the weapon reportedly used, the address, date and time of the crime, and the name of the reporting officer.
She then used the training data and the natural language processing built into the arcgis.learn module of the ArcGIS API for Python to train an EntityRecognizer model. After making sure the model could identify entities, such as the crime and the date, time, and address of the incidents, she used it to extract the information from each of the text files. Now that the data was structured, Bennett used ArcGIS API for Python to geocode the locations and create a point feature layer. A crime location was represented by each point.
View this web map that Bennett then created of the crimes in Madison, Wisconsin. You can see her presentation in its entirety by watching this video.
App Building Options with Little or No Code
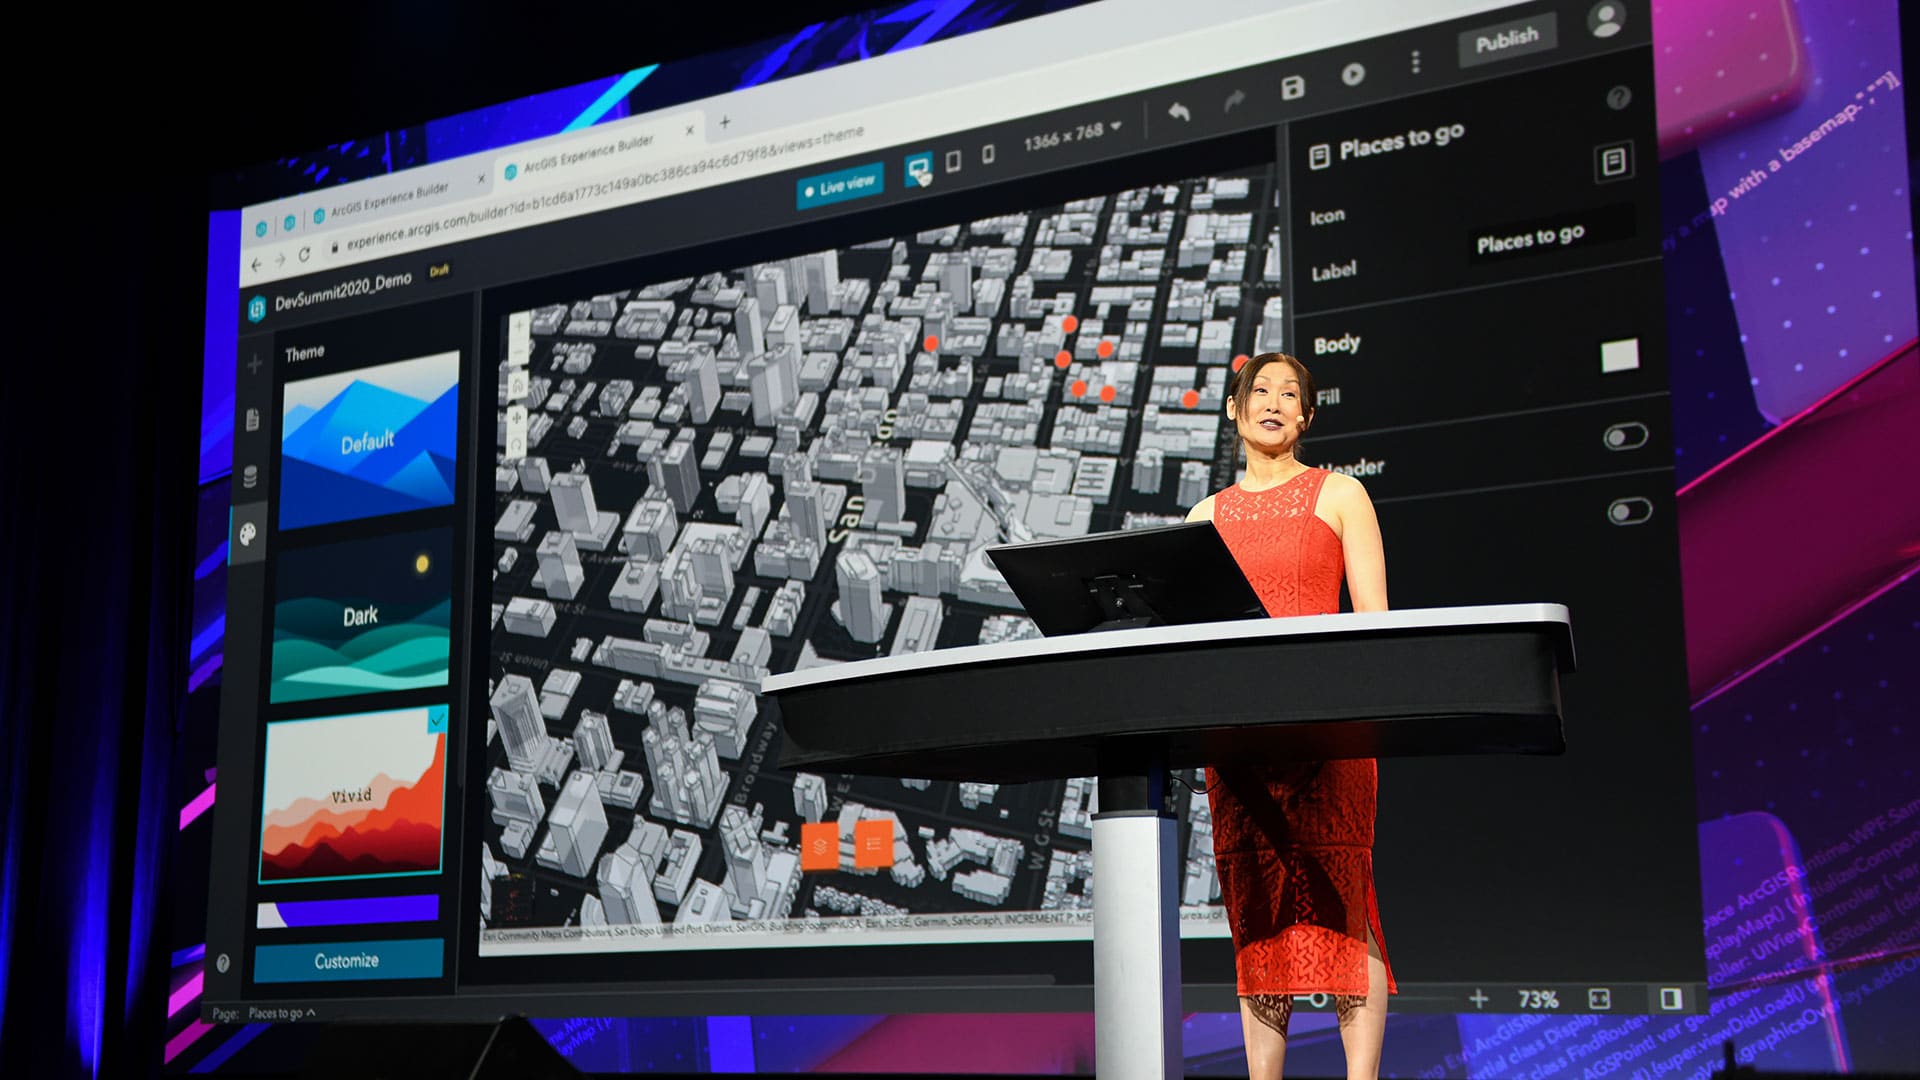
Esri staff demonstrated how to get apps into the hands of users easily with AppStudio for ArcGIS and the new ArcGIS Experience Builder.
For example, Chris LeSueur, the product manager for AppStudio for ArcGIS, walked the audience through a workflow for sharing native mobile apps. The apps built with AppStudio templates can be shared to an ArcGIS Online organization and put into groups with named users and then shared with those users via AppStudio Player for ArcGIS, an app that can be downloaded from app stores.
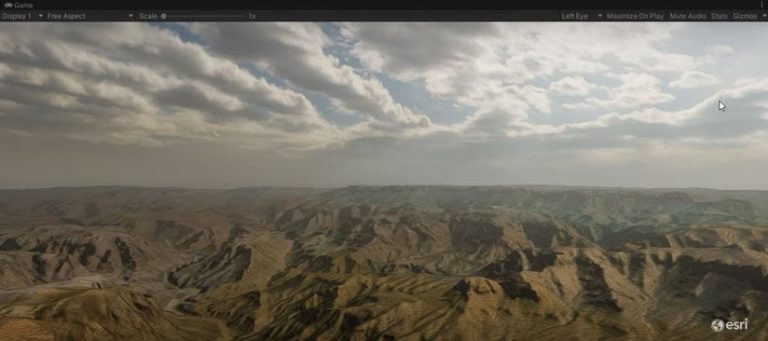
LeSueur also demonstrated an offline 3D mapping application that displays the beautiful terrain of the Angeles National Forest in California. He developed this sophisticated application with AppStudio, which is built on top of ArcGIS Runtime SDK for Qt.
Watch the entire presentation on AppStudio.
Esri also just introduced a new way to build web apps. Called ArcGIS Experience Builder, it gives people the ability to build web experiences using one of a series of templates, which come with widgets. Watch this demonstration of how Experience Builder works, including on mobile apps, with Jianxia Song, product manager for ArcGIS Experience Builder and Web AppBuilder for ArcGIS.
Game On!
Cameron, the chief technology officer for developer technology at Esri, announced that an effort is under way to integrate ArcGIS with Unity and Unreal Engine, two popular game engines.
According to Cameron, game engines are a great development environment because it provides a premium rendering experience and cross-platform hardware support. There’s also an opportunity to build connections with game engine developers.
“There’s an extremely large developer community and we’ve been hearing from that developer community that they want to get ArcGIS content into their game engines to improve the applications that they are building,” Cameron said.
Esri will build plug-ins for Unity and Unreal Engine that will provide the following:
- APIs to access ArcGIS services and local data
- Capability to display and honor real-world/geographic coordinate space
- Integration with the game engine developer experience
- Software developer kit resources such as samples and demonstrations
“In terms of ArcGIS functionality, you will be able to work with raster tiles, imagery, elevation, scene layers with 3D objects, and integrated meshes and point clouds,” he said. “Feature layers will be supported with points, lines, and polygons, and you will be able to get access to some of the other services that are available from ArcGIS like geocoding and networking.”
To see how GIS applications can be created using ArcGIS with Unity and Unreal Engine, watch this video demonstration.
Another Opportunity to Meet and Additional Resources
McKinney said that although DevSummit was virtual, there will be another opportunity to gather this year in person. The Esri European Developer Summit is currently scheduled for November 2020 in Berlin, Germany, but continue to check the website for any schedule changes.
“For the past few years, we’ve tried to keep DevSummit going all year long with our GeoDev webinars,” McKinney said during the close of the Plenary Session. “Each month, we host a DevSummit-style tech workshop as a webinar including a live Q and A [session]. If you haven’t tuned in to one of these, check it out. They’re really valuable and fun.”
All the DevSummit presentations are available on the Esri YouTube Channel. Also, stay on the lookout for technical sessions, which will be added in the coming weeks.
To dig even deeper into some of the DevSummit Plenary Session presentations, read the following blog posts:
- Use AI to Extract Data from Lidar Point Clouds
- Extract and Map Data from Unstructured Text
- Use Raster Analytics and Python API to Monitor Coral Bleaching
- Use Deep Learning Tools with Full-Motion Video
- Big Data Analysis Using GeoAnalytics Tools