GeoAnalytics Tools in ArcGIS leverage spatiotemporal analysis to identify relationships and patterns across a large amount of data.
Using Apache Spark, GeoAnalytics performs parallel analysis to analyze vector and tabular datasets.
With GeoAnalytics Server, organizations can perform distributed analysis across multiple machines, while GeoAnalytics Desktop Tools use ArcGIS Pro to perform parallel analysis with local data on your desktop machine.
At this year’s Developer Summit plenary, Sarah built upon this functionality and demonstrated two different ways that Spark, and new enhancements to GeoAnalytics tools, can be used to improve your big data analysis.
Spatiotemporal Cluster Analysis in ArcGIS Pro
To kick off her demonstration, Sarah showcased the new spatiotemporal clustering algorithm introduced with ArcGIS Pro 2.5 in the Find Point Clusters tool included in the GeoAnalytics Desktop toolbox.
Sarah’s dataset contains 4.5 million points of Uber pickup locations in New York City collected over the span of 5 months.
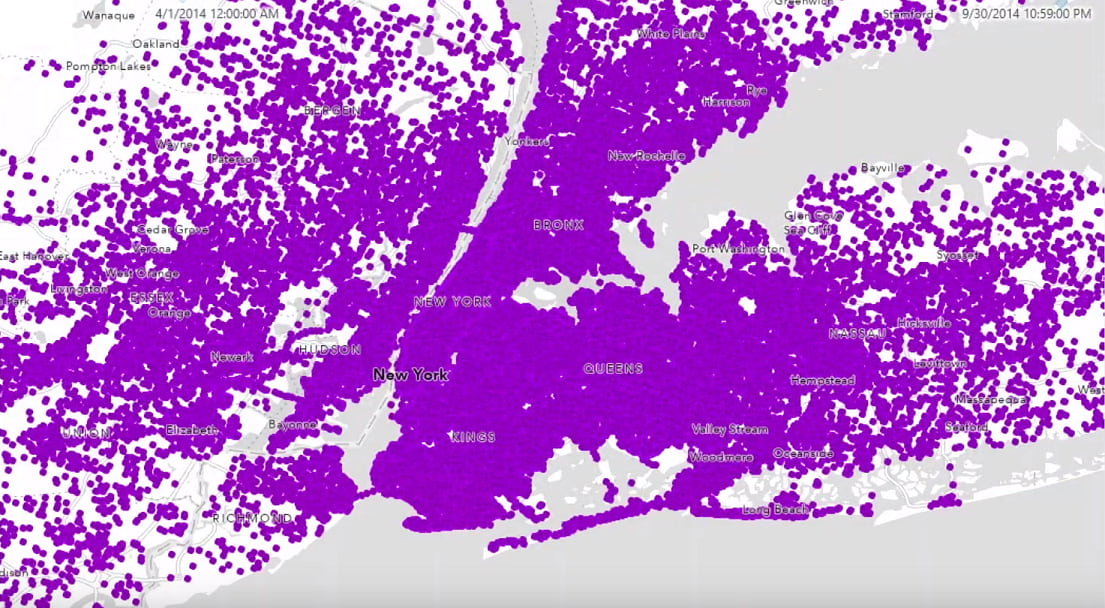
Spatiotemporal clustering discovers clusters of points based on proximity in time and location. To identify areas of interest within the Uber pickup events, like a surge of customer pickups or a large event being let out, Sarah ran the Find Point Cluster tool to find clusters that had a minimum of 20 pickups within 50 meters and 10 minutes of each other.

The result shows distinct clusters of Uber pickups that centered around airports, cruises, the US Open, and fashion events.

While the Find Point Cluster tool was running, Spark was processing on Sarah’s desktop machine and running parallel analysis across all 32 cores within her geoprocessing environment. Parallel analysis allows for computationally expensive operations, such as Find Point Clusters, to be performed across multiple cores to speed up analysis and improve overall performance.

See this blog on spatiotemporal clustering with GeoAnalytics to learn more about how clustering can be used with GeoAnalytics Server and GeoAnalytics Desktop tools.
Summarize Large Data Using a Spark Pipeline
For the second half of her demonstration, Sarah showed a custom notebook she had created to analyze 2.8 billion GPS points of AIS shipping data from Marine Cadastre using her own custom Spark using the tool run_python_script method.

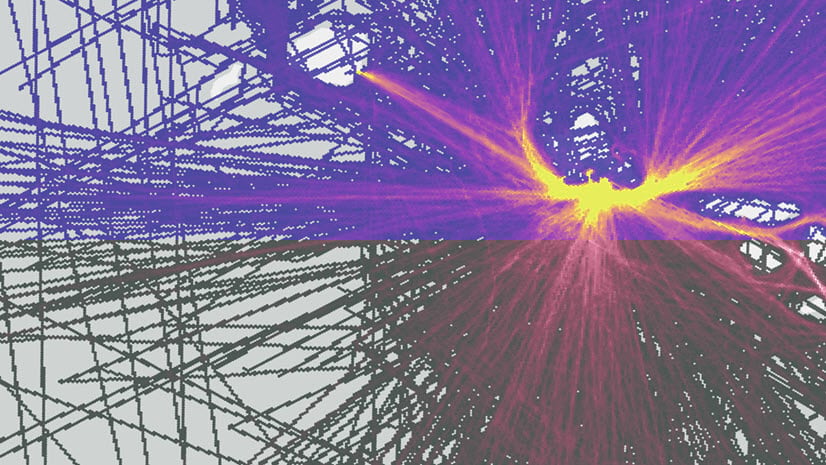
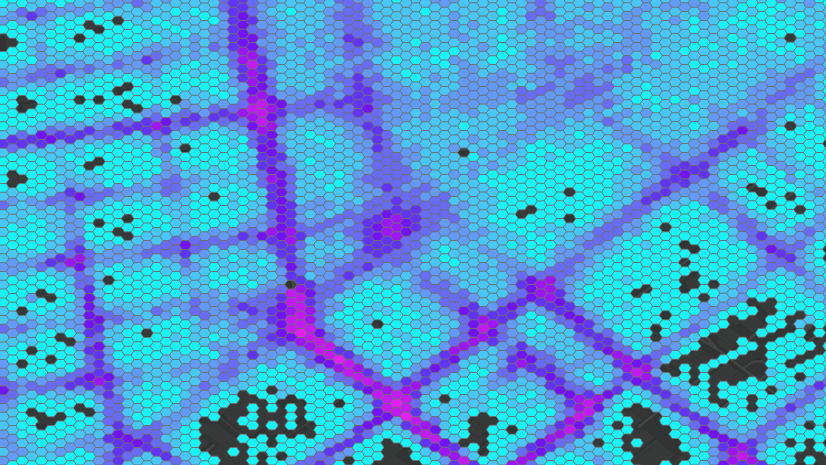
In order to visualize ship travel data, Sarah will need to use three tools to get the final result she’s interested in. The first tool, Reconstruct Tracks, is used to create ship paths from the GPS points. The second, Summarize Within, is used to summarize the paths into bins for visualization. The final tool, Clip Layer, is used to clip the bins to the shoreline boundaries.

Without running Spark though the Run Python Script tool, Sarah would have to execute each tool separately, creating intermediate layers that would take up unnecessary space and time. However, because Spark offers the ability to pipeline tools Sarah is able to write a function that chains the three tools together. With the run_python_script tool, Sarah’s custom code is executed on the Spark cluster set up with the GeoAnalytics Server, and runs across all the cores on her server.

The result layer was produced in 57 minutes and clearly shows the shipping lanes and where boats are traveling off the West Coast. By chaining together these tools, Sarah was able to eliminate unnecessary intermediate results and reduce the amount of time spent completing her analysis.
Conclusion
When it comes to big data analysis using GeoAnalytics, you have multiple options available to help you discover your own data. New tools and enhancements have been added to the GeoAnalytics Desktop toolbox with ArcGIS Pro 2.5 that continue to utilize Spark-powered analysis.
For custom code & implementing pipelines into your workflows, a combination of more than 20 GeoAnalytics tools, the entire pyspark API library—including spark.ml and spark.SQL—allows for flexibility and creativity when it comes to quickly analyzing large datasets and streamlining your workflows with GeoAnalytics Server.


Article Discussion: