NatureServe Releases the Map of Biodiversity Importance, a Map Collection Supported by Esri and Microsoft
For close to half a century, a network of boots-on-the-ground botanists and zoologists have ventured into forests, deserts, and swamps to gather data on animals and plants that are in danger of going extinct.
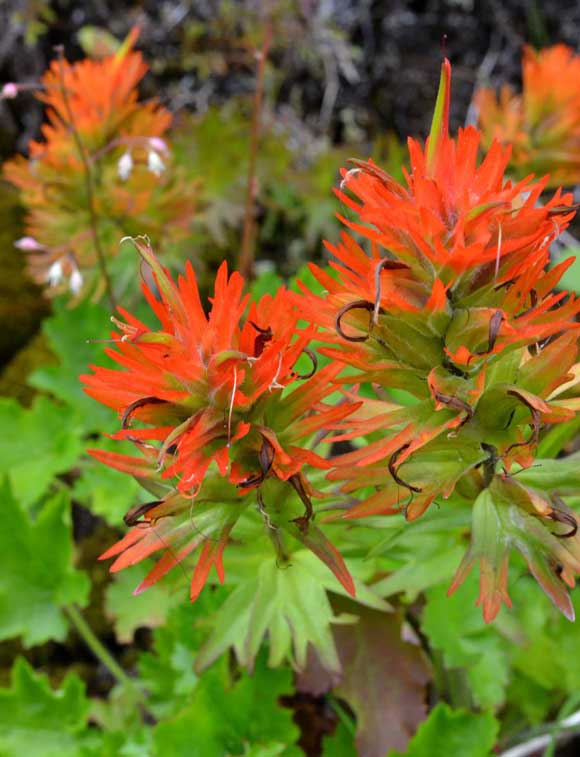
These scientists have recorded information about thousands of rare species, from the threatened Jollyville Plateau salamander in Texas to the imperiled little purple monkey flower in California.
The scientists‘ findings are compiled by NatureServe, a nonprofit organization. NatureServe works with nearly 100 NatureServe Network programs in the United States, Canada, and Latin America to provide conservation-related data, software tools, and services to government agencies, conservation groups, academia, and private companies.
To make that data even more useful for users who make critical conservation and land–use decisions, NatureServe just launched the Map of Biodiversity Importance, developed with help from the NatureServe Network programs, Esri, Microsoft, and The Nature Conservancy.
Finding out where the habitats for rare plants and animals exist in the United States is one of the first steps in keeping them from going extinct. The mission of the Map of Biodiversity Importance project is to harness artificial intelligence (AI) and location technology to determine where our country‘s most at-risk species occur in order to help protect them. The project‘s top 10 findings currently show, for example, that California is a highly biodiverse state with hundreds of imperiled species, and that climate change is threatening some of the most biodiverse areas in the country.
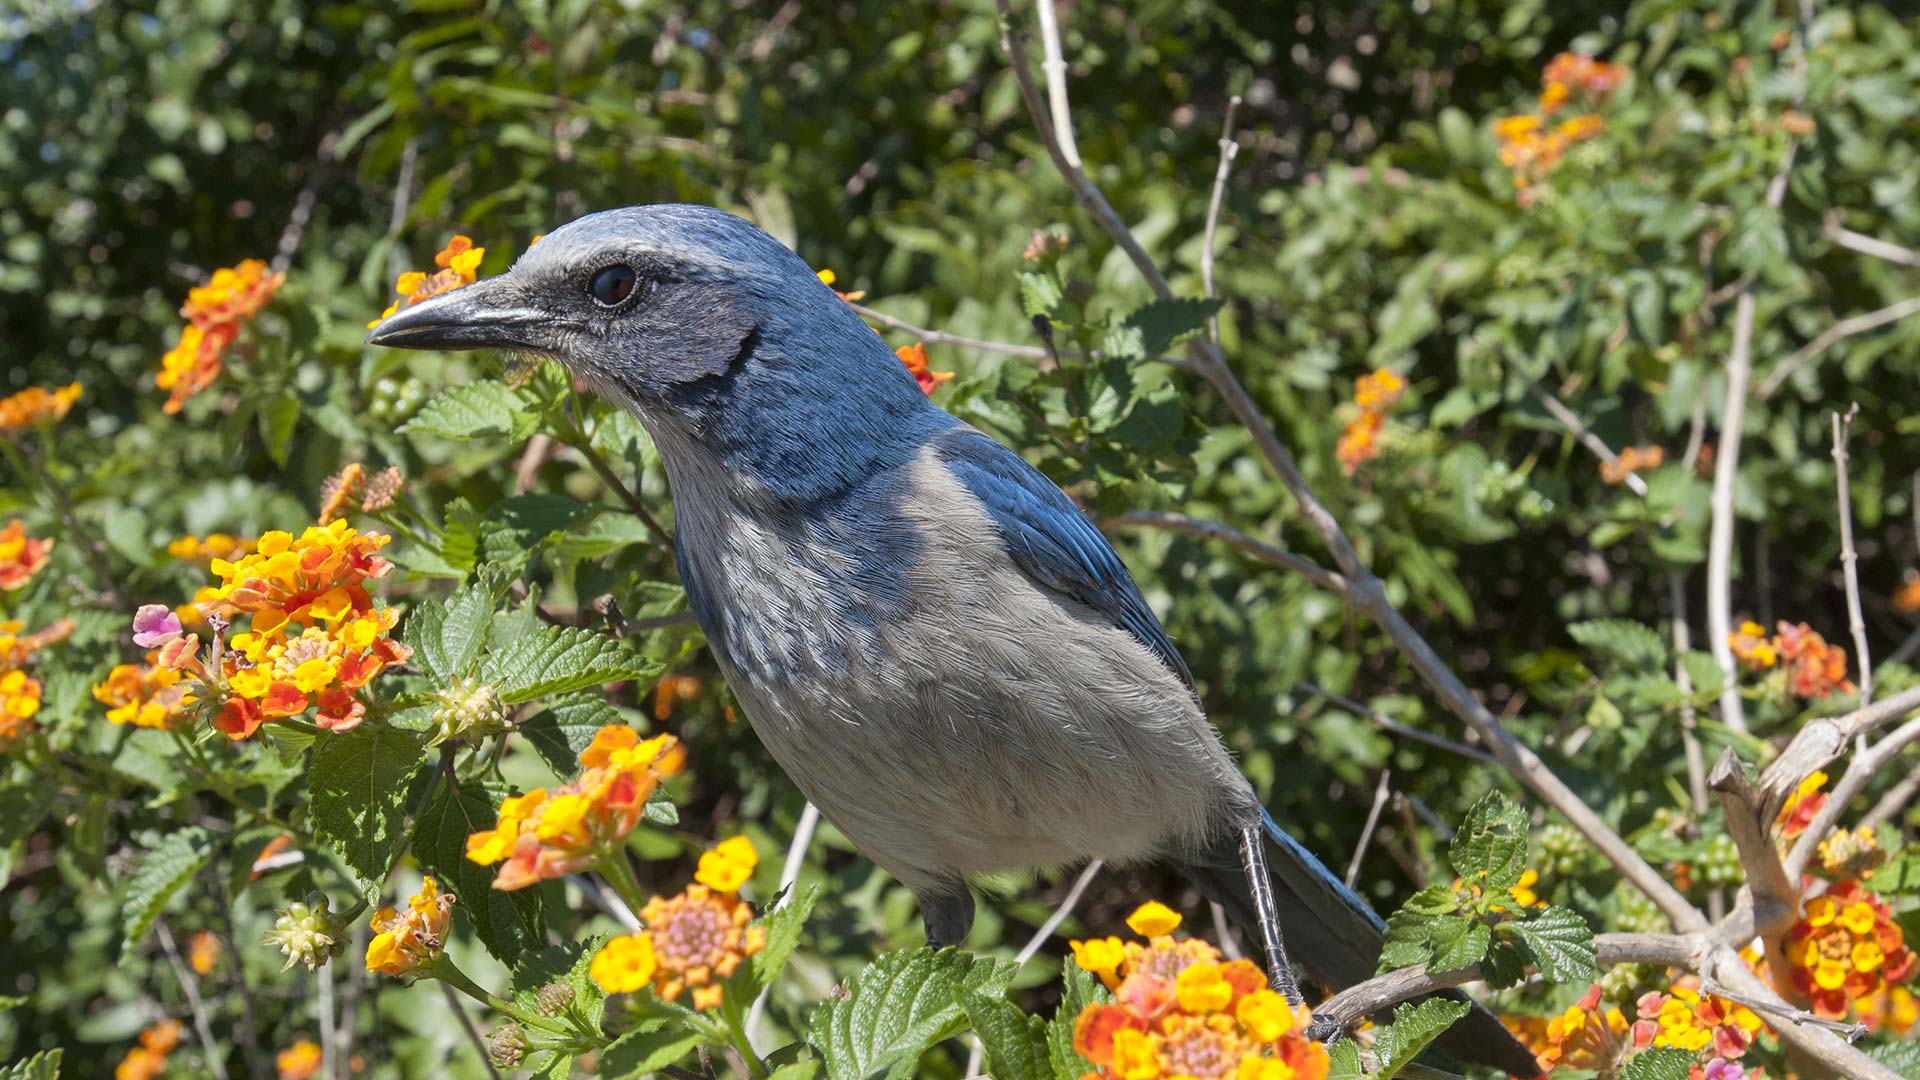
“We value nature‘s diversity,“ Healy Hamilton, chief scientist at NatureServe, said in unveiling the Map of Biodiversity Importance to the public at the Esri Federal GIS Conference in Washington, DC, in February. “We have passed federal and state laws to safeguard species from extinction and we have protected lands and waters to sustain their habitat. When we think of biodiversity, we may reflect on tropical rain forests or coral reefs, where the richness of life is indeed staggering. But our own country harbors globally significant biodiversity.“
AI Meets ArcGIS
NatureServe combined machine learning and GIS to produce this map collection, using Esri ArcGIS technology and Microsoft AI for Earth to model and map habitats where conditions are favorable for more than 2,000 imperiled species across the nation.
The Map of Biodiversity Importance collection consists of raster map layers that identify important areas for imperiled and critically imperiled plant and animal species in the contiguous United States. This includes 15 layers that depict the following:
- Species richness (the count of species)
- Range-size rarity (a measure that takes into account range size—and thus how many opportunities there are for protection)
- Protection-weighted range-size rarity (a measure considering both range and the degree to which species occur outside protected areas and reserves) for all imperiled species and for taxonomic subgroups (e.g., plants or pollinators).
You can access these resources on NatureServe‘s Hub site or via Esri‘s ArcGIS Living Atlas of the World. Item descriptions in Living Atlas provide additional details on what the data represents.
The map collection aggregates data for 2,216 of the nation‘s most imperiled species: 1,636 species of vascular plants, 309 species of vertebrates (mammals, birds, amphibians, reptiles, and freshwater fishes), 228 species of freshwater invertebrates (mussels and crayfish), and 43 species of pollinators (bumblebees, butterflies, and skippers), according to NatureServe.
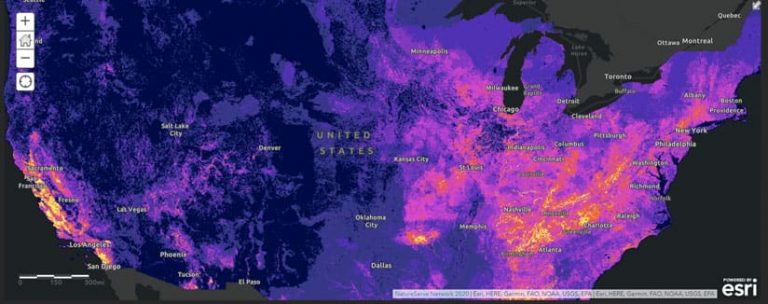
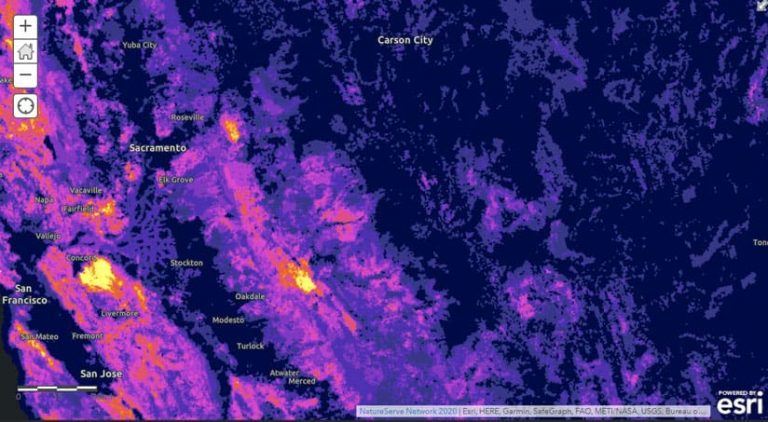
As Hamilton gave the audience a first look at the Map of Biodiversity Importance Richness of Imperiled Species in the United States map, she explained where to find the habitats of the most imperiled plants and animals. Shades of yellow and orange in states like California, Tennessee, and North Carolina lit up the map.
“These bright colors on this [Richness of Imperiled Species in the United States map] indicate areas where multiple imperiled species have habitats that coexist,“ Hamilton said. “By stacking habitat maps for 2,000-plus species, we can see what we‘ve never seen before; with unprecedented resolution, we can now identify the places that matter most for sustaining our nation‘s biodiversity.“
For example, the map shows—with the highest values and the brightest colors such as yellow and orange—the hot spots of biodiversity in California and the Southeast.
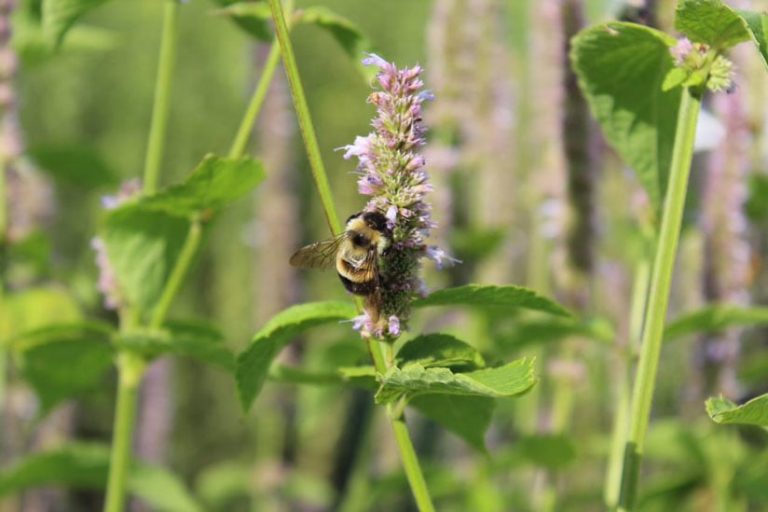
Coastal California from San Diego to just north of Santa Rosa is a hot spot for imperiled pollinators in the United States. This means that in those areas, you‘re most likely to find the highest numbers of bumblebees, butterflies, and other imperiled pollinators. Explore the Richness of Imperiled Pollinators in the United States map.
The picture is a little different when conservation need is factored into the equation. The Protection-weighted Range-size Rarity of Imperiled Species in the United States map weights the species-richness results by the inverse of the range size of each species and the degree to which it is already protected in parks and reserves.
The resultant map identifies areas where conservation actions can have greatest impact. States with the greatest acreage of areas of high conservation need include California, Texas, Georgia, Florida, Arizona, and Utah. However, high-importance areas are found throughout the country; over 90 percent of the population of the lower 48 states lives within 30 miles of an area of high biodiversity importance identified on this map.
NatureServe works closely with the Bureau of Land Management (BLM), the US Forest Service, and The Nature Conservancy. These organizations and others, including private companies, can use the maps to help guide land–use and land management decisions such as prioritizing where to purchase land for conservation or weighing options about where to locate a new highway to avoid highly biodiverse habitats.
“We are all now stewards of our nation‘s national heritage,“ Hamilton said, addressing the audience of federal employees. “Every day, decisions must be made about real estate development, transportation, energy infrastructure, military readiness, forestry, agriculture, and recreation. These decisions have implications for sustaining imperiled species today and preventing vulnerable species from further decline.“
Filling In the Maps
NatureServe tracks data on more than 100,000 plant and animal species—including many that aren‘t imperiled—relying on field surveys conducted by 1,000 scientists working for NatureServe Network programs throughout the United States and Canada. For example, Christopher Tracey, the conservation planning manager for the Pennsylvania Natural Heritage Program, has conducted many field surveys.
“The typical heritage biologist is tasked with two main things,“ he said in an interview last summer at the Esri User Conference. “One is going out and finding new records and new places for at-risk species, and [the other] is updating existing species records. Both of these are key to maintaining up-to-date biodiversity data for decision-makers.“
The scientists don‘t only record the location of the species. “We actually go out and count the population and what the threats and stresses to it might be,“ Tracey said.
However, sending out scientists to cover every corner of the country to collect data on plants and animals is impossible. That‘s where data science and location intelligence come in.
“We can‘t look everywhere, and so with modern computational approaches, there‘s a real opportunity to fill in the map now,“ said Regan Smyth, director of spatial analysis at NatureServe.
NatureServe has used the ArcGIS platform for many years to analyze, manage, and share information on the locations and habitats of plants and animals in the United States, Canada, and some parts of South America. For example, Pennsylvania Natural Heritage Program created a Collector for ArcGIS app, called Field Information Network Database (FIND), that scientists can use when collecting field information about various species.
“We have all of our plant and animal field records in FIND on, so we can go and navigate to the site and record changes in the population,“ Tracey said. “And if we discover a new location for a rare species, we can collect baseline information on the occurrence, which is then processed into our Biotics database.“
The Map of Biodiversity Importance took the use of GIS, cloud computing, and AI at NatureServe to a new level.
Smyth and a team of scientists from around the country used Esri ArcGIS technology and computational support from the Microsoft AI for Earth program to create sophisticated predictive habitat models for thousands of at-risk species.
To do this, Smyth said, the team analyzed the documented locations of each species along with spatial environmental data on soils, land cover, hydrology, and climate. The project team assembled a library of over 250 national environmental predictor variables to characterize both terrestrial and aquatic environments.
At the Federal GIS Conference, Smyth used an example of the threatened Jollyville Plateau salamander, which lives in springs and streams in central Texas, to walk the audience through the predictive analysis process.
“Using open science tools like R together with ArcGIS, we can run a machine learning algorithm called Random Forests and explore the relationship between the salamander and those environmental variables,“ she said. “We can [then] see which variables are most important for predicting habitat and generate a map of habitat suitability.“
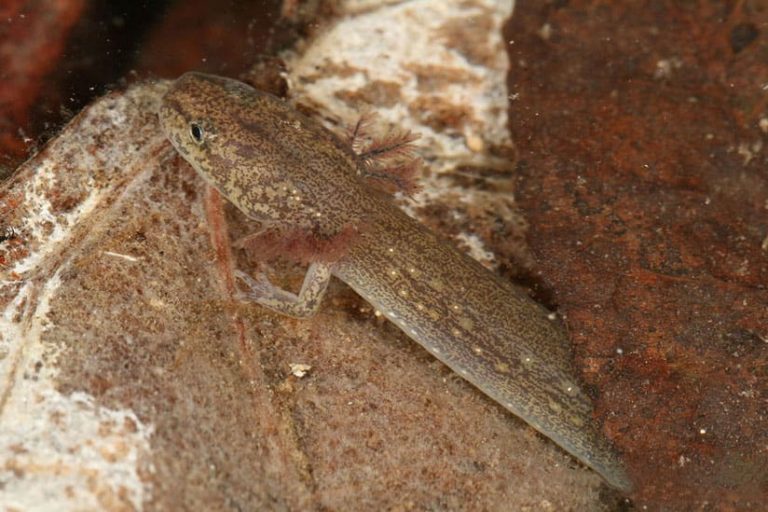
Smyth said the models NatureServe created can be used to author new maps like the one she showed the audience. It identified the documented locations of Jollyville Plateau salamanders in Texas, along with the habitats that were the most suitable to support the amphibian.
NatureServe also developed an online model review web application that‘s hosted in ArcGIS Online.
“We upload our models into the web app,“ she said. “Then species experts from across our different programs can view the results and provide feedback on how well the model performed. This process allows field biologists [to gain] a better understanding of how these spatial modeling techniques work and provides the modeling team the information we need to make the end products better. The ability to collaborate in this way has been very exciting and speaks to the power of ArcGIS Online.“
To see the Map of Biodiversity Importance presentation by Hamilton and Smyth, watch this video.
Listen to this podcast featuring with Sean O‘Brien, president and CEO of NatureServe. He discusses how data and analytics can help guide conservation efforts.