
Dublin Airport is fast becoming a digitally smart organization, with GIS being one of the technologies at the heart of the transformation.
In 2019, the airport won a coveted Special Achievement in GIS award from Esri for using the company’s location technology to do things such as manage assets, collect and analyze health and safety data, maintain runways, and monitor and analyze wildlife incursions. The technology strides will continue in 2020 as one of Europe’s fastest growing airports plans to launch an indoor mapping system to serve both passengers and staff. The airport’s indoor mapping system will serve dual purposes: help passengers locate everything from restaurants to retail outlets and provide useful information for airport staff.
“Our aim was to think big, start small, and work fast,” said Neil Moran, Dublin Airport’s head of digital asset management & transformation. “[Esri] ArcGIS gave us the platform we needed to connect systems, give all our employees a single view of the truth, and empower them to work more efficiently and flexibly all around the airport.”

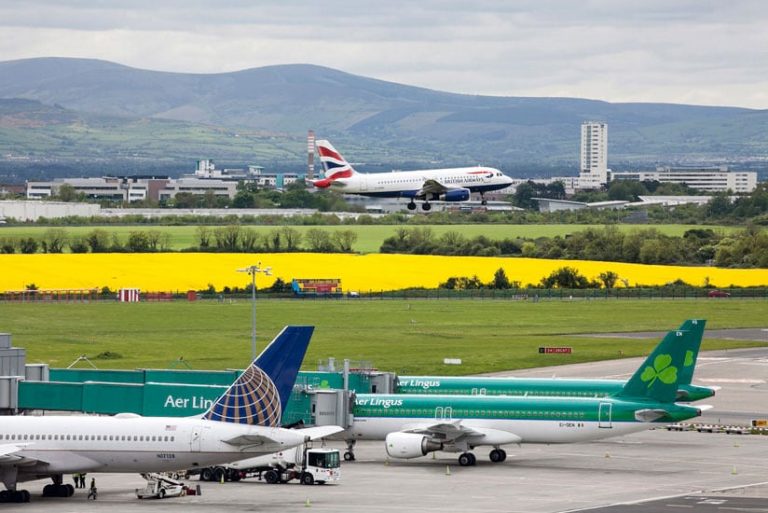
daa owns and operates Dublin Airport, which is the busiest airport in Ireland. More than 31.5 million people passed through the airport in 2018, which was a 6 percent increase from the previous year. daa decided to digitally transform the facility so it could serve its customers better and operate more efficiently. As part of this sweeping digital transformation, daa implemented the Esri ArcGIS platform, including products such as ArcGIS Pro, ArcGIS Dashboards (formerly Operations Dashboard for ArcGIS) mobile apps such as Survey123 for ArcGIS and Collector for ArcGIS, and soon—for part of the indoor mapping system—ArcGIS Indoors.
Location is the linchpin of this project. Every asset located within and every action happening within Dublin Airport’s perimeter has a location. On this premise, airport managers who want to transform their facilities into smart airports can do so by using location technology.
ArcGIS connects daa’s data systems, creating a single view of enterprise asset information and providing insight into the airport’s operational costs, risks, and performance. The digital transformation is good news for passengers, who now move from parking lots to terminal gates more quickly and smoothly. Staff can easily track reports of incidents such as a fall on an escalator or an injury to a baggage handler. Crews can instantly capture information about airfield conditions, such as a problem with the pavement, so repairs can be made before the issue becomes hazardous.

Location technology gives airport staff a better understanding of how passengers interact with the facility and assets. It pinpoints exact locations where issues need to be addressed. It tracks and monitors many of the facility’s business assets such as lifts, escalators, car park, security and baggage systems, and boarding gates.
“We need to understand how passengers are interacting with us as they are traveling through the airport,” said Vincent Harrison, Dublin Airport’s managing director. “This information is increasingly important as we move more passengers through the airport. GIS shows us where issues need to be addressed and how we can respond to them very quickly.”
Mapping the Airport
daa is currently working with Apple to map the Wi-Fi signal patterns in Dublin Airport, laying the groundwork to deliver up-to-date information relevant to passengers using mapping apps on their Apple devices. In the project’s second phase, which will be rolled out later in 2020, daa will leverage the Apple Maps “blue dot” indoor positioning system (IPS) data and integrate it with ArcGIS Indoors. ArcGIS Indoors will be used to power the mapping and location capabilities in the Dublin Airport App, the mobile app that daa will create for passengers. The Dublin Airport app will be available on both Android and iOS devices.
ArcGIS Indoors also will be used to power the interfaces of the map kiosks that will be set up in the airport, as well as kiosk interfaces that will be available on desktops and mobile mapping apps for staff.
Passengers will be able to navigate the airport using either their Apple devices or the Dublin Airport App. Like a car’s navigation system, the app drops a pin on the destination, shows the visitor’s current location, and then creates a route. If the visitor is on the way to a boarding gate, the app’s indoor navigation shows the route between floors and estimates the time it will take to get there.
Dublin Airport’s GIS also consumes data from the airport’s asset management system and design files, the Internet of Things (IoT), weather services, and other resources. It creates operation visualizations of the data and applies analytics to generate airport intelligence.
Improved Maintenance Performance
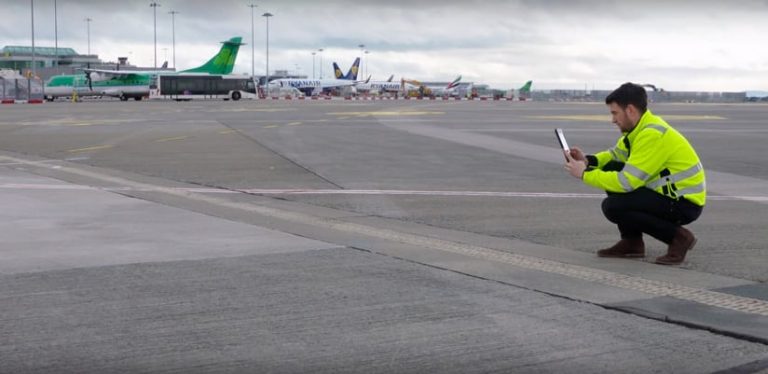
Maintenance crews use ArcGIS to collect information about and monitor facility repairs. Airport workers use Esri mobile apps, such as Collector for ArcGIS and Survey123 for ArcGIS, to capture detailed information and photos about problems, accessing the ArcGIS platform via the airport network. Instantly, the incident appears on a web browser-based dashboard that was configured using ArcGIS Dashboards. The dashboard processes the information and displays it in maps, graphs, and charts, giving managers immediate information about what is happening and which repairs to prioritize, schedule, and assign to technicians to complete.
The dashboard also tracks a task’s status. The maintenance technician receives an assignment, sees its location, and clicks the map to access the initial notes and photos. The technician can also use the app to access repair manuals. Upon completion, the technician touches an icon on the app that says Complete. The app instantly updates the task’s status on the operations dashboard—turning the incident location from red—meaning work that’s planned—to green—meaning work that’s completed. Maintenance reports, which are digital from beginning to end, are stored in the location database. The record of an asset’s maintenance history is accessible at any time and can be used for analyzing asset performance.
“[The] dashboards put real-time information into managers’ hands and provide valuable insight into the airport’s operations, risks, and performance, which we can use to make faster, well-informed decisions,” said Morgan Crumlish, Dublin Airport’s spatial data manager.
Improved Health and Safety
daa collects detailed incident information and uses it to speed response and drive health and safety improvements. For instance, if a passenger is injured on an escalator, staff members use Survey123 for ArcGIS on their mobile devices to access and complete an accident report. The same app provides a form to gather witness statements. The app also helps staff capture relevant environment conditions via notes, photos, and recordings. It automatically stamps all data with time and place and streams the record to the database.
Safety managers use ArcGIS Dashboards to analyze escalator-related accidents. By comparing them to historical data about similar, previous incidents, heat maps can be created to identify high-risk areas in the airport. The dashboard also can create bar charts that show the numbers and types of injuries for each escalator over a two-year period. The dashboard also shows ratios of types of escalator-related injuries such as collisions and cuts.
The analysis that can be conducted using ArcGIS highlights safety improvement opportunities and produces reports that protect the airport against erroneous claims. It also demonstrates daa’s compliance with European Union Aviation Safety Agency aerodrome licensing regulations by showing that asset management standards have been met.
Better Airfield Management
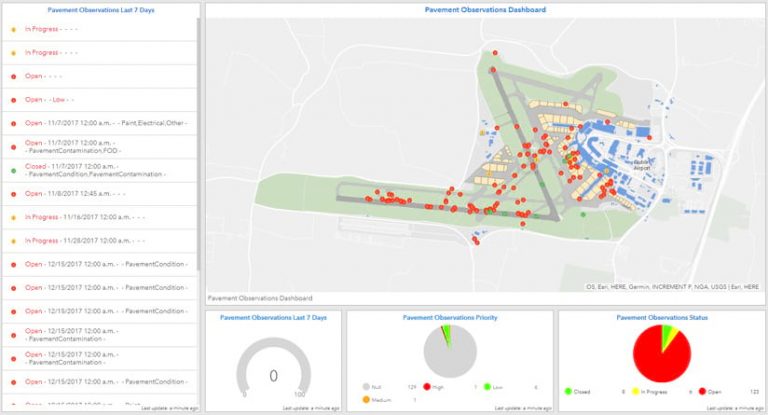
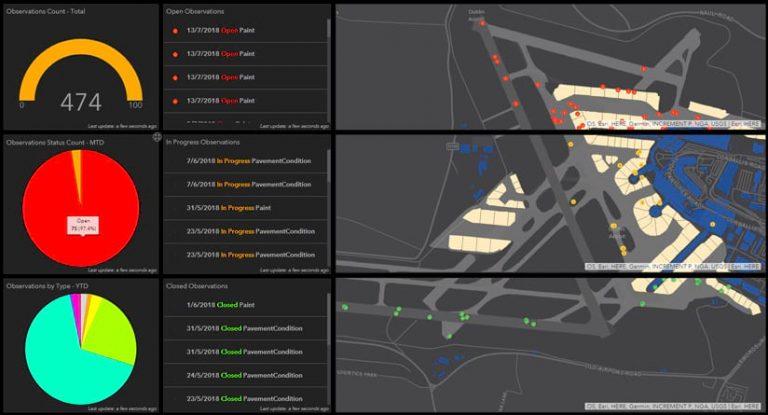
Because the GIS is an enterprise system, daa also uses it for other operations such as maintaining the airfield. For example, inspectors use Collector for ArcGIS to collect information, including photographs, on issues such as the condition of the pavement on the airfield. The data can then be visualized in the pavement observations dashboard. One dashboard displays pavement condition reports on the airfield in a map and pie charts, with colors in the map and charts indicating the priority level of the issue: green for low priority, yellow for medium priority, and red for high priority.
Another dashboard shows the progress made toward painting lines on the tarmac. A maintenance dashboard shows the status of tarmac tasks completed year to date. Whatever the operations team needs to track, it can configure it as a dashboard. As before, the system uses the same data to verify compliance with aviation industry regulations.
Increased Awareness of Airfield Hazards
Wildlife incursions at airports can pose significant safety issues, including when migrating birds cross flight paths. daa airfield managers have used ArcGIS to analyze recorded incidents of bird incursions over the airfield at Dublin Airport over a five-year period. The maps that were created revealed patterns to the sightings and instances when birds strike aircraft. This helps staff with wildlife management plans—including the installation of hawk kites or decoys—to keep birds away from the airfields.
The staff at Cork Airport, which daa also manages, uses ArcGIS Dashboards to monitor drone sightings and reported incidents of illegal laser activity, which helps the airport take the appropriate steps to ensure passenger safety.
To learn more, watch the video from Esri Ireland.