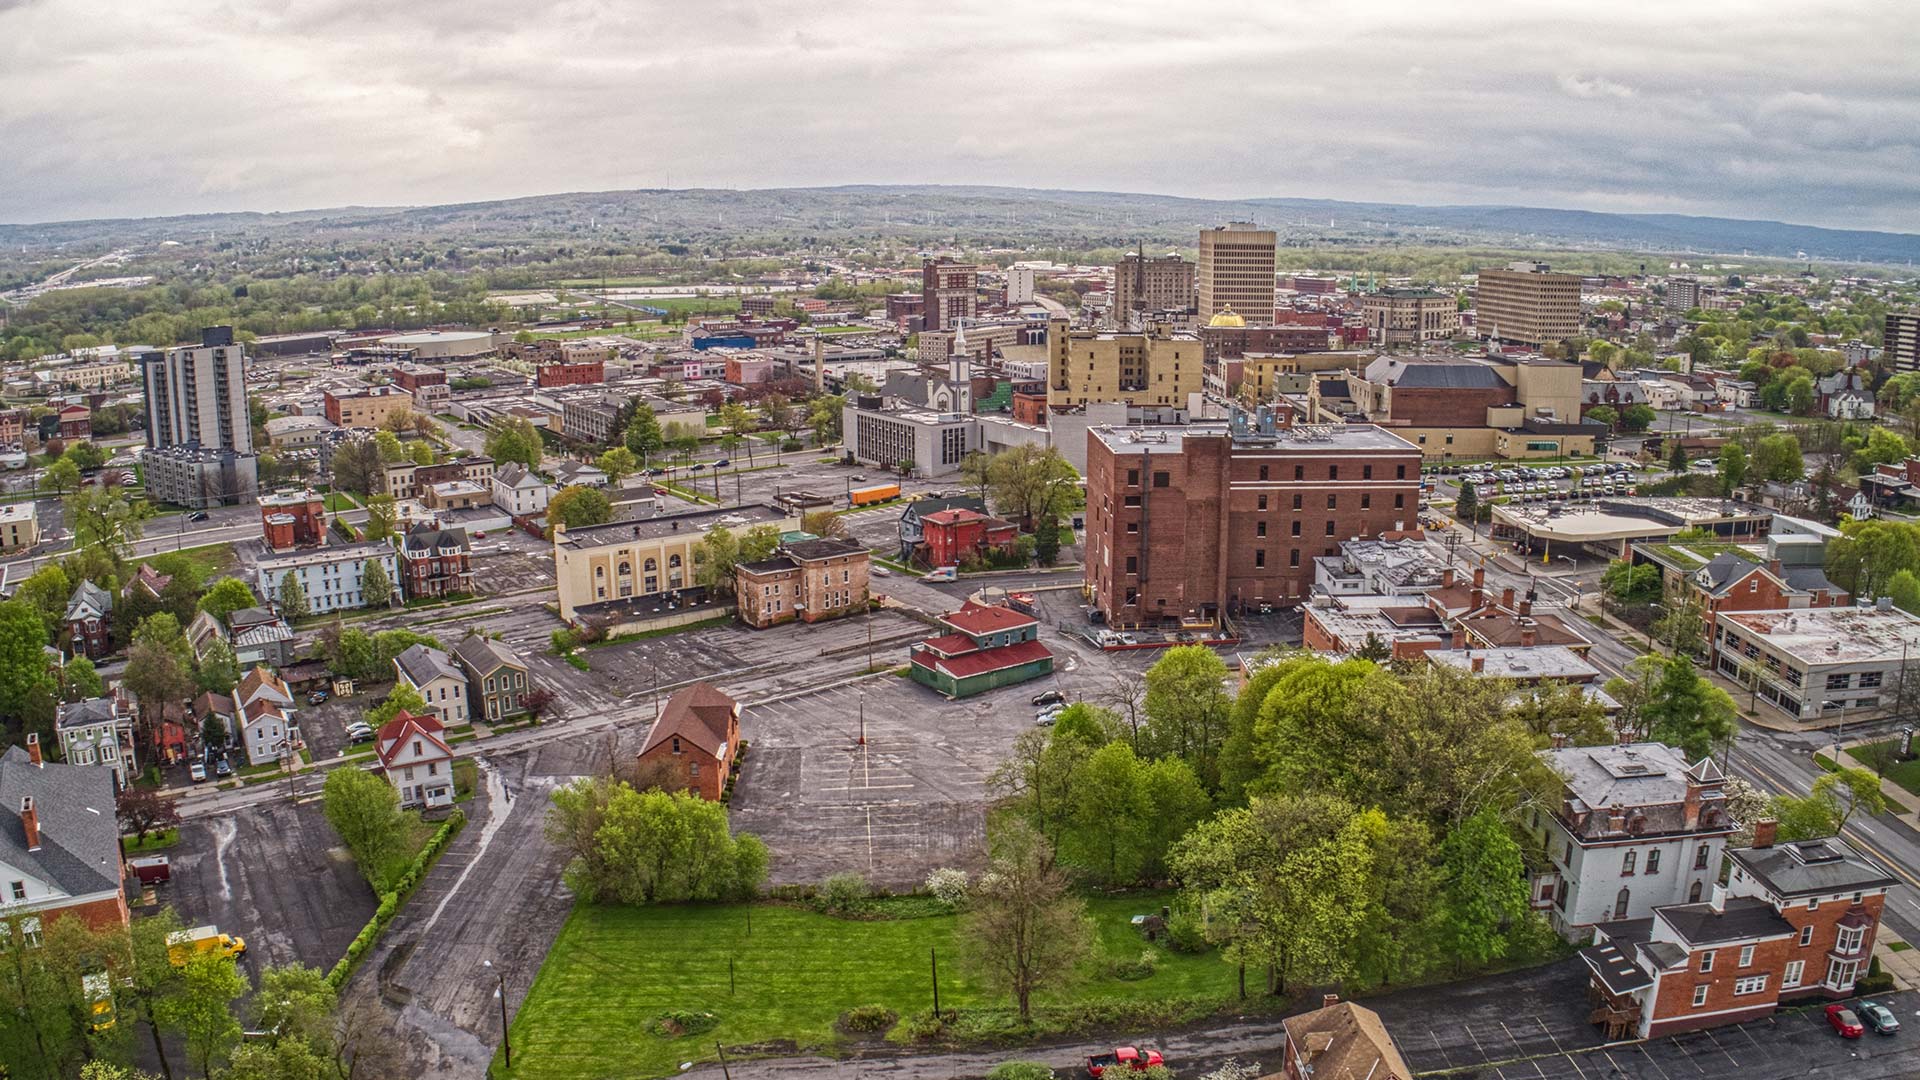
Pennsylvania State University (Penn State) geodesign students took the GIS, environmental, and urban design skills they’ve been learning in class and applied them to a real-life situation: a citywide revitalization project for the City of Utica, New York.
Students in the master of professional studies in geodesign and the graduate certificate in geodesign programs collaborated on a 14-week urban geodesign studio project. In it, they used Esri software to create design proposals and then measure the impacts of those plans.
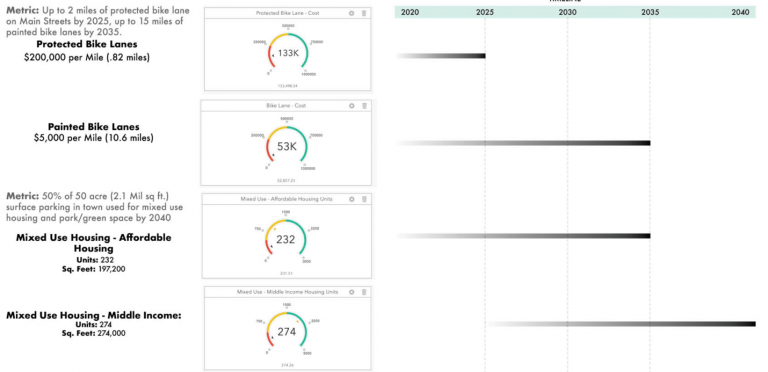
The students used Esri software such as ArcGIS Urban, ArcGIS CityEngine, and ArcGIS Online for their project. It involved planning scenarios for land use, transportation networks, green spaces, and more. The students then presented their work to city planners in Utica, giving them a fresh perspective. With ArcGIS Urban, for example, the students could compare capacity metrics, building space use, and zoning or land-use area for a variety of scenarios.
“The presentations really helped me to shake off some of the dust one accumulates after so much time outside of the classroom,” said Chris Lawrence, principal planner for the City of Utica. “The tools the students were using were really impressive and provided a lot of clarity for their ideas. Through the visualizations made with ArcGIS Urban, I was able to better understand and interpret the many concepts presented by the students. I was impressed with how metrics could be easily displayed for different scenarios.”
Providing Hands-On Technical Experience
Offered entirely online and designed for working professionals, Penn State’s geodesign graduate degree and certificate programs give students the environmental and urban design skills they need to be successful.
Geodesign leverages the analytical power of GIS technology for a dynamic approach to designing and planning land-based projects that are environmentally, economically, and socially sustainable. Students in the program hail from a variety of academic disciplines and have different levels of GIS understanding. The goal is that by the end of their studies, students will have become creative problem-solvers who understand and can orchestrate the process of geodesign.
Each year, this program gives students the opportunity to gain hands-on experience at studios in two different settings: urban and rural. The urban design studio presents challenges and complexities common to revitalizing a city.
This geodesign studio project was prompted by Mohawk Valley Health System’s plans to build a $548 million, 700,000-square-foot hospital in downtown Utica.
The project goal, in part, was to understand the impacts the new hospital would have on the city, according to James Sipes, lecturer in geodesign, Penn State Department of Landscape Architecture.
“We knew where the hospital location was, and we wanted to know what kind of effects [that would] have throughout the community,” Sipes said. “How can we look at the broader picture and opportunities for community growth that this might bring?”
Sipes adds that he and colleague Dan Meehan, Penn State geodesign program manager, believed it was vital that students not only interact with innovative technology but also think about urban design and planning differently to better use the technology.
Rethinking the Urban Fabric
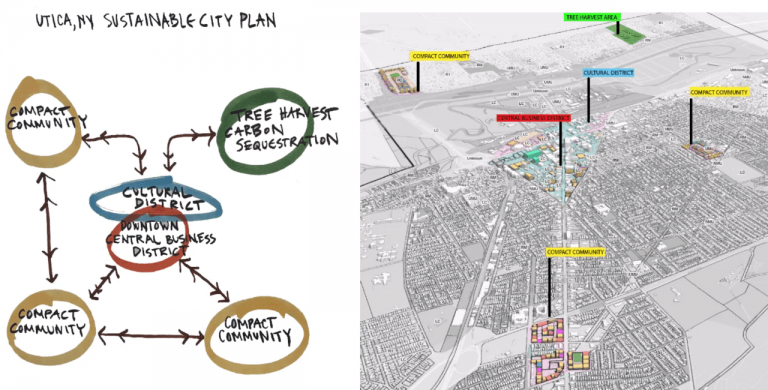
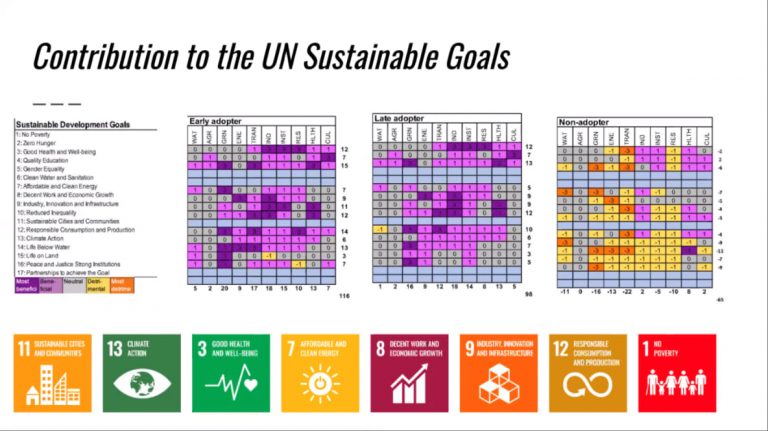
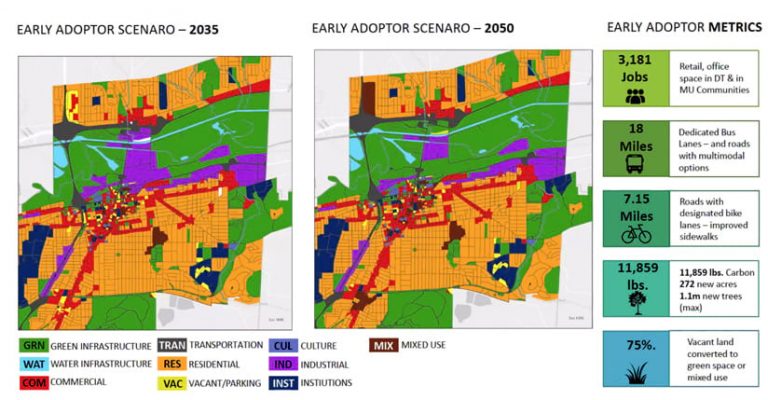
Sipes and Meehan formatted the project around the International Geodesign Collaboration (IGC) framework. Using this format gave students the ability to study three design scenarios over time for the City of Utica. These scenarios include the early adopter (in which innovations are adopted promptly, resulting in changes in 2035 and 2050), the late adopter (changes are adopted in 2035, leading to changes in 2050), and the current business-as-usual trajectory.
When these scenarios are visualized, the cumulative impact of implementing planning strategies sooner rather than later is highlighted. Students were also asked to estimate the impact on the United Nations (UN) Sustainable Development Goals in order to frame the problems or challenges they chose to study. The top five goals are to eliminate poverty, have zero hunger, foster good health and well-being, advance quality education, and achieve gender equality.
“The goal in using the IGC format was to have students look at those scenarios; see that they proposed X, Y, [and] Z; and then tell us if what they proposed either positively or negatively affected the sustainability goals,” Meehan says. “The key point wasn’t to have students reach every goal but to see how the changes they were proposing would impact different levels of sustainability.”
With students taking a multifaceted approach to city planning, visualization was a key factor in their ability to see interconnected challenges and better inform their methods of resolving them. GIS—specifically, ArcGIS Urban—proved to be the needed technology.
“ArcGIS Urban was at the core of what we were doing primarily because it’s one of the few tools we know of that [would allow] us to put in so many different variables, assumptions, and different complexities at that scale and allow us to visualize the impacts,” Sipes said.
Over the course of the project, the students used ArcGIS CityEngine, ArcGIS Urban, ArcGIS Online, ArcGIS GeoPlanner, and ArcGIS StoryMaps to visualize, analyze, and share information. For some students, the tools presented a learning curve. However, Esri staff provided multiple training sessions as well as tech support.
Graham Mills, who is pursuing a bachelor’s degree in landscape architecture at Penn State, said that the GIS technology and support from Esri staff helped him learn the workflows and get the skills and expertise needed for his career.
“The opportunity to [attend workshops hosted by] Esri solutions staff was invaluable, to show us how they’re using these tools, which of course went above and beyond what we had imagined in our small class and pushed us to strive for more with our individual projects,” Mills said. “I think everyone benefited from seeing the possibilities of these tools. The only limitation were our unique concepts and initiative.”
Applying City Planning Concepts through a Geodesign Lens
The first half of the project focused on where the hospital in Utica would be located: the city’s U District, an area of downtown for small businesses and entertainment. This project helped students familiarize themselves with course concepts and tools on a small scale. The students’ analysis included existing and potential business options, ideas to revitalize the historical character of downtown Utica, and opportunities to attract new residents.
“We went from this smaller-sized project to [saying], ‘OK, now that you have reimagined what would happen there, now apply that to an entire city.’ So they had to stop and think about the things they had learned in that first project and apply it on a larger scale,” Sipes said. “We wanted them to think big about how to change the entire city but think in a methodical way on how we can get there.”
Part of the research that the students conducted included understanding key stakeholders—a central tenant of the geodesign approach. As a class, the students came up with five groups of stakeholders: government, residents, business owners, hospital affiliates, and developers.
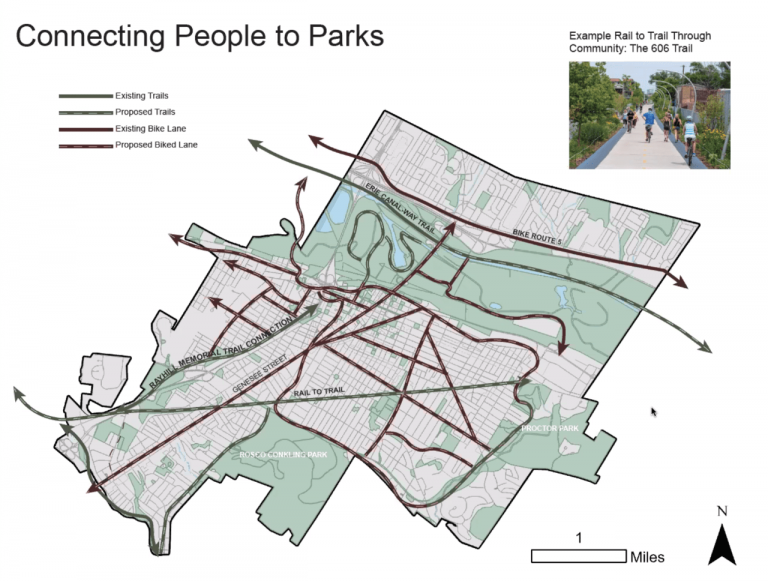
Acting as stakeholder group representatives, the students researched the needs and goals of each group. From there, they outlined a series of key goals, including improving health and wellness with community gardens and agricultural farms and upgrading streets to be more pedestrian friendly. One project focused on planting trees on vacant land and near parking lots to add greenery, enhance air quality, and improve wellness across the city.
“One of the things students did well was that they stopped thinking about singular issues and began to think about multiple issues and overlapping benefits or impacts,” Sipes said.
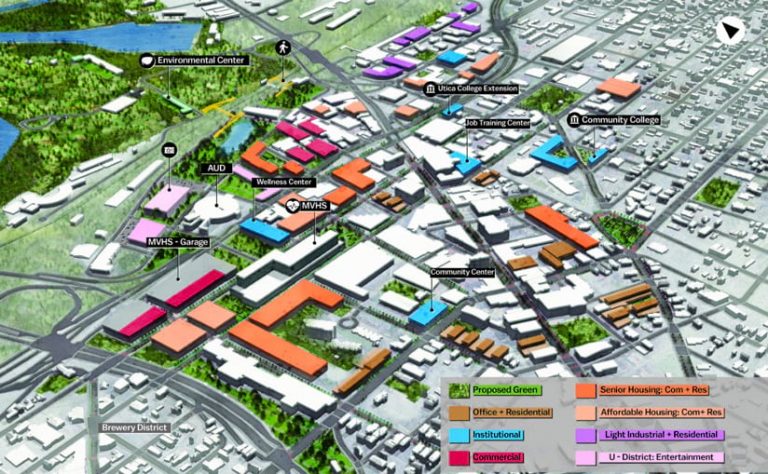
At the end of the course, the geodesign students used ArcGIS Urban to present 3D visualizations and massing models of all the buildings in Utica. They modeled zoning changes, proposed transportation networks and bike lanes, and mapped areas for parks and gardens.
Students presented their findings to geodesign experts and Utica city staff, using ArcGIS StoryMaps apps like Connecting Utica to deliver information in a graphical, easy-to-understand format. Student work is also viewable for further learning purposes via the Penn State studio design hub. Through all their efforts, students gained significant technical skills and a new way of understanding and applying geodesign.
“As a student who is used to small-scale, site-specific designs, moving toward a city-scale project was a huge challenge,” says Sara Schwartz, who is pursuing a master’s degree in landscape architecture and a geodesign certificate at Penn State. “Overall, these digital tools and their features and storytelling capabilities enhanced my work and experience.”
While the geodesign project was a class assignment only and not connected to the city’s revitalization plans, the City of Utica’s planning office seriously took note of the students’ proposals.
“The compelling visuals and concise descriptions in the presentations really made an impact on me and may be worked into future planning discussions in our office,” Lawrence said.