In a previous post, I wrote about how you can view 3D layers in GeoPlanner and do nifty things like model shadows. Things get even niftier if you use Arcade with GeoPlanner to extrude data in 3D.
Arcade is a new scripting language in ArcGIS that you can use to control how things are drawn on your map. GeoPlanner lets you use Arcade to control how individual things are extruded in 3D. You can extrude by obvious things like heights or elevations. You can also extrude based on expressions, allowing you to create 3D Key Performance Indicators (KPIs)!
Let’s look at an example of each.
Extrude by Building Height
The following steps describe how you can add some data to your GeoPlanner project and then visualize that data by building height. Why would you do this? This is another way of evaluating a plan. 3D can give you a different perspective on how something behaves in an environment.
- Sign in to GeoPlanner. If you don’t have a license, follow these instructions on how to access a free trial. Click on the Don’t have an ArcGIS Online subscription link.
- Create a new project from the GeoPlanner Template for Economic Development Planning.
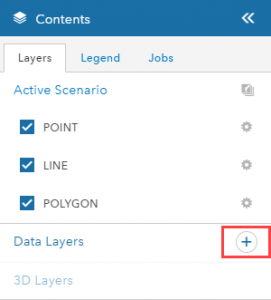
- Click the Contents icon in the upper left corner of the app. This will open the Contents pane.
- Click the + icon next to the Data Layers label. This will open the Add Data dialog.
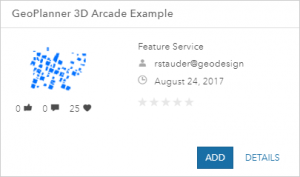
- In the search box at the top of the Add Data dialog, type in GeoPlanner 3D Arcade Example and click the All link.
- Click the Add button in the GeoPlanner 3D Arcade Example item card.
 Click Evaluate on the application toolbar, then click 3D.
- In the Contents pane, click the gear icon next to the GeoPlanner 3D Arcade Example layer and choose Zoom to from the dropdown menu.

- Click the gear again and choose 3D Settings.
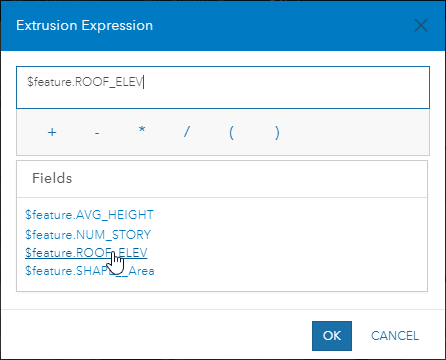
- In the 3D Settings dialog, click the Expression Builder link beneath the Extrusion Expression text box.
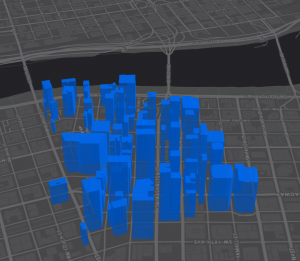
- In the Extrusion Expression dialog, click $feature.ROOF_ELEV. This will instruct GeoPlanner to extrude each building by the height value found in the ROOF_ELEV field.

- Click OK twice.
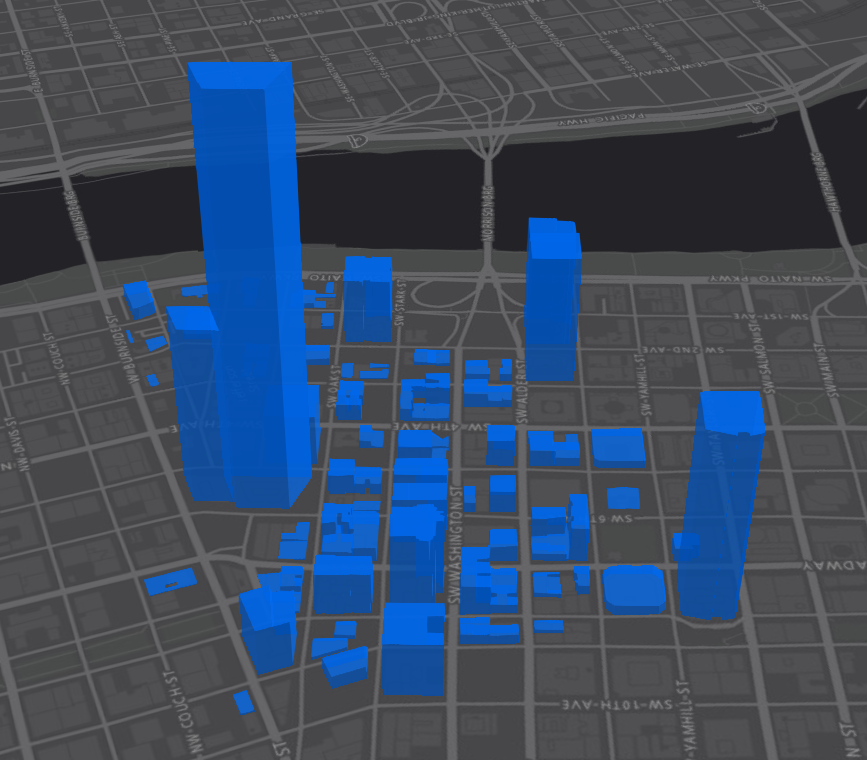
- On the map, click the Toggle to Pan or Rotate in 3D icon. Click and drag on the map to rotate or orbit around the buildings. Your map should look similar to the following graphic:


In the previous example, you extruded the buildings by the values in the ROOF_ELEV field. In the next section, you’ll build on this example by creating a 3D KPI.
Extrude by Expression
The following steps detail how you can extrude these buildings footprints using an Arcade expression. The output will be an extrusion that shows potential employment in these buildings. Why would you do this? This is another way to visualize a KPI. There are two kinds of uses for the buildings in this example, Commercial Office and Commercial Retail. Each has a different assumption that dictates how much space in the building can be used for employment. Those assumptions are built into the Arcade script.
- In the Contents pane, click the gear icon next to the GeoPlanner 3D Arcade Example layer and choose 3D Settings.
- In the 3D Settings dialog, click the Expression Builder link beneath the Extrusion Expression text box.
- Type in the following expression:
if ($feature.BLDG_USE=="Commercial Office") {
     return ($feature.SHAPE__Area*.8*$feature.NUM_STORY*.75)/450;
}
else if ($feature.BLDG_USE=="Commercial Retail") {
     return ($feature.SHAPE__Area*.5*$feature.NUM_STORY*.75)/750;
}
These equations compute potential employment capacity of these footprints by multiplying the area of each shape by a lot coverage constant (.8 for Commercial Office and .5 for Commercial Retail). The resulting product is multiplied by the number of stories in each footprint and a net factor constant (.75 for both). The resulting product is then divided by a constant for employee job area (450 for Commercial Office and 750 for Commercial Retail). Employee job area is a value that represents the amount of square feet an employee would require for each type of building. In this case, Commercial Retail facilities require more space per employee than Commercial Office. By the way, you can view a similar KPI in GeoPlanner’s dashboard by examining the Jobs Capacity Office and Jobs Capacity Retail metrics.
Click OK twice and use the Toggle to Pan or Rotate in 3D tool to move around your scene. Your map should look similar to the following graphic:
You’ll notice that the footprints look very different now. Their extrusion represents jobs capacity instead of height, giving you a different perspective of employment potential.
GeoPlanner helps you design, test and collaborate on scenarios in 2D and 3D so you can make better decisions about the future of your community. GeoPlanner enables you to plan and test ideas in what-if scenarios. Arcade is another tool in GeoPlanner that helps you understand a scenario’s impact and what-if consequences.
It’s easy to get started with GeoPlanner. Start planning a better future today. You can sign up for the free trial by following these instructions. Click on the Don’t have an ArcGIS Online subscription link.

Article Discussion: