GeoPlanner helps you design, test and collaborate on scenarios in 2D and 3D so you can make better decisions about the future of your community. GeoPlanner enables you to plan and test ideas in what-if scenarios.
We recently added support for 3D visualization to GeoPlanner. 3D in GeoPlanner is an evaluation tool. This means that you can use it to understand and assess impact of a scenario or a plan. This can be as simple as viewing how shadows are cast throughout the day to writing advanced Arcade expressions to extrude your data by values other than height. Arcade is a new scripting utility in ArcGIS that you can use to control how things are drawn on your map.
Want to learn more about Arcade? Check out these online resources.
View 3D data in GeoPlanner
- Sign into GeoPlanner. If you don’t have a license, follow these instructions on how to access a free trial. Click on the Don’t have an ArcGIS Online subscription link.
- Create a new project from the GeoPlanner Basic Template.
- On the map, click on the Place Finder icon (hint: It looks like a magnifying glass) and search for Potsdamer Platz, Berlin, Deutschland.
- Click the Contents icon in the upper left corner of the app. This will open the Contents pane.
- On the application toolbar, click Evaluate, then 3D.
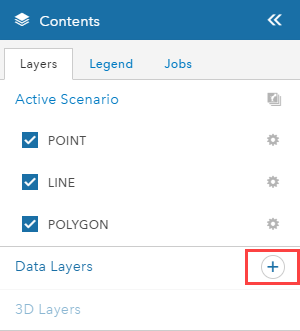
- Click the + icon next to the Data Layers label. This will open the Add Data dialog.

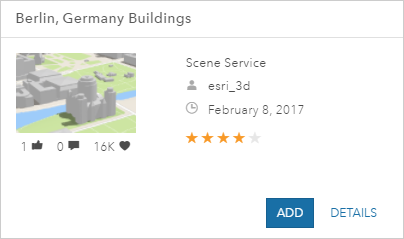
- In the search box at the top of the Add Data dialog, type in Berlin, Germany Buildings, check on 3D Layers and click the All link. A list of available layers displays.
- Click the Add button in the Berlin, Germany Buildings item card.

- Zoom in 1 or 2 levels, then click the Toggle to Pan or Rotate in 3D icon.
- Now click and drag on the map rotate in 3D. It’s that easy!
Model Shadows
Let’s try the Daylight tool next to see how shadows are cast by the buildings around the Potsdamer Platz. This might be useful in understanding how your scenarios obscure or shade their surroundings throughout the day.
- On the map, click the Daylight icon.
- Drag the time slider until the scene begins to darken.
- Check on Direct Shadow.
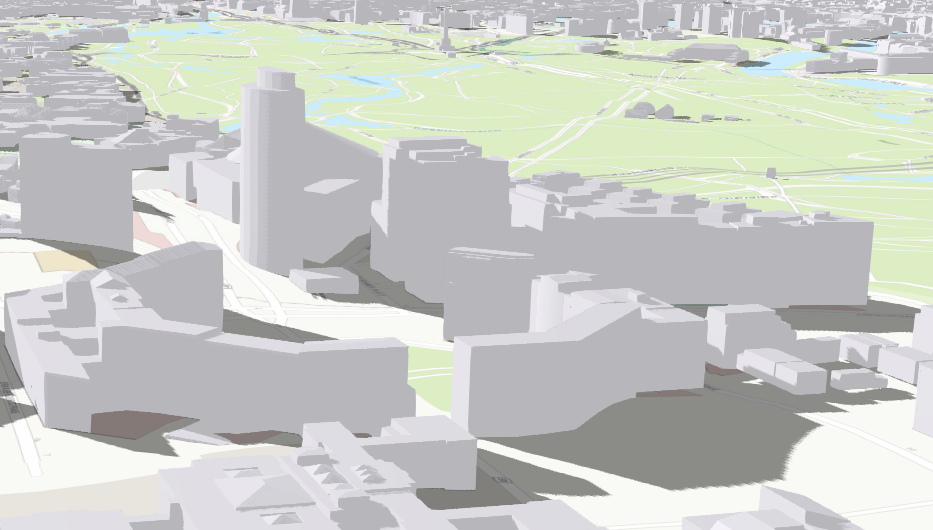
Your scene now displays shadows cast by the buildings around the Potsdamer Platz. It should resemble the following graphic.
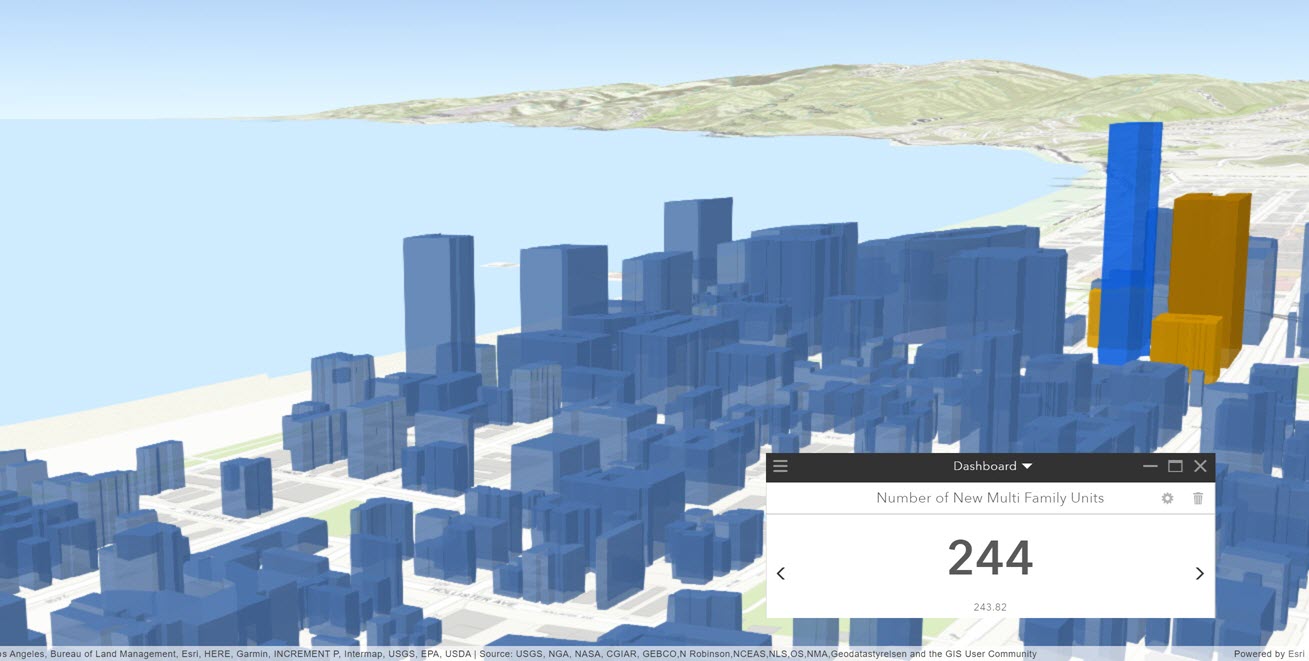
There’s a lot more you can do, including creating slides (aka bookmarks), viewing key performance indicators in 3D, and writing an Arcade expression to extrude features. For now, we’ll leave Arcade for a future post.
With 3D support in GeoPlanner you have the power to visualize your data and scenarios in another dimension. This will give you another way to plan and evaluate your ideas. This can help you improve your decisions about your community’s future.
It’s easy to get started with GeoPlanner. Start planning a better future today. You can sign up for the free trial by following these instructions. Click on the Don’t have an ArcGIS Online subscription link.


Article Discussion: