GeoPlanner for ArcGIS helps planning professionals design and test scenarios in 2D and 3D. Real-time dashboards, a simple sketching environment, evaluation tools and project and data sharing allow you to visualize different planning alternatives and make better decisions about land use, economic development and resource allocation. We recently updated the app to allow you to visualize and plan in 3D! Check out the following to understand what’s new:
Discover and use scene layers
Add 3D to your GeoPlanner projects. In the GeoPlanner 3D evaluation mode, you can use the Add Data dialog to discover and use scene layers. The Contents pane allows you to access the Add Data dialog so you don’t have to move out of 3D mode to search for data.
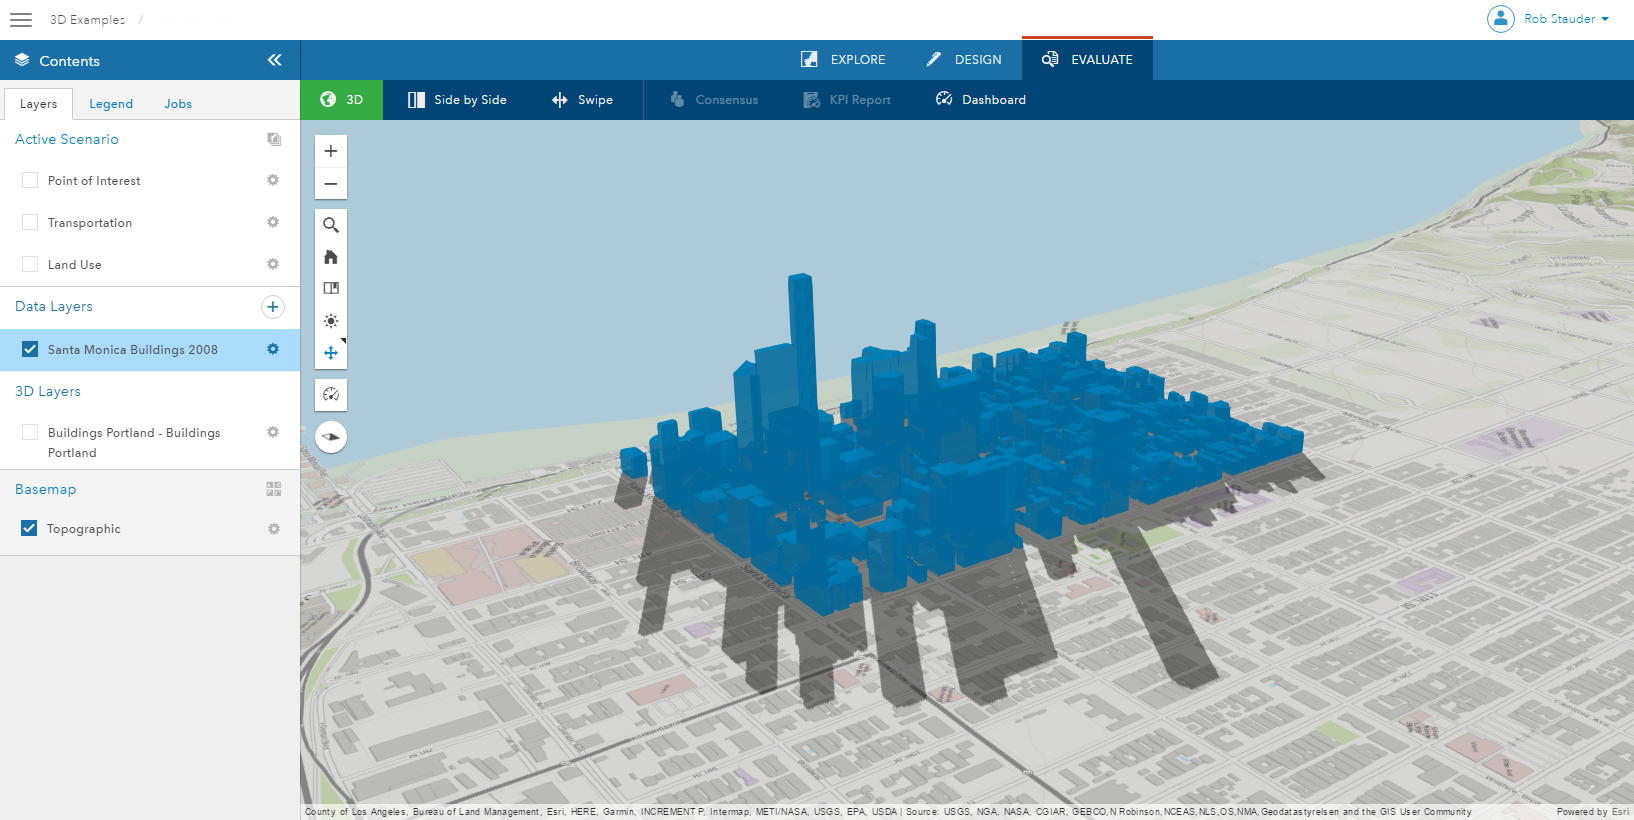
Visualize your data in 3D
Visualize any feature layer in 3D by entering 3D mode in the evaluation mode. You can extrude layers by attributes, constants or Arcade expressions. The Arcade scripting language allows you to define specific extrusion rules on a per-feature basis.
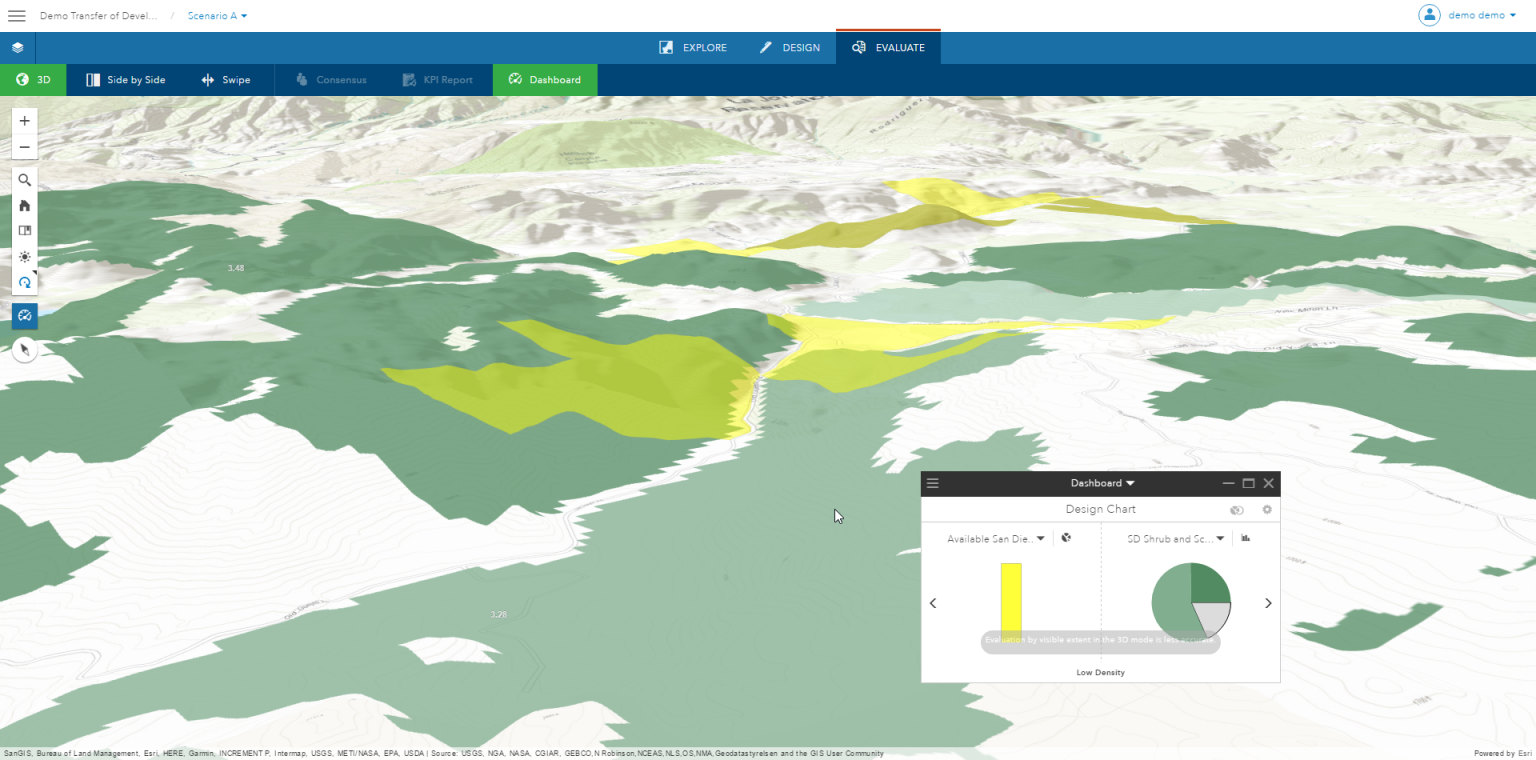
View Key Performance Indicators
In 3D mode, you can access a dashboard and view your Key Performance Indicators (KPIs) so you can understand your plan’s impact.
Model shadows
You can also configure dates and time of day so you can visualize the shadows cast by data in your plan. This will help you understand your plan’s impact on its environment at different times of the year.

Article Discussion: