Intelligence analysis is a discipline comprised of unique workflows, that often require synthesizing diverse forms of information. One such form of information is spatial-temporal data, which gives insight into when and where certain events or phenomena occur and can be leveraged to uncover significant patterns and generate actionable conclusions.
ArcGIS AllSource was designed with these intelligence users, data types, and workflows in mind. As this discipline and these workflows change and evolve, so too does our technology. The following workflow demonstrates how recent Timeline and Knowledge Graph enhancements in AllSource can empower users to identify key persons of interest in a fictional criminal organization.
Using Movement Tools in ArcGIS AllSource
This example features simulated track data representing individuals being monitored within a fictional criminal organization of interest, using Moving Target Indication (MTI) – a radar technique designed to detect moving objects. The objective is to identify the key players in this organization and where they may be operating. This MTI dataset contains roughly 200,000 points collected over a two-week period. Although the dataset reveals the geographic footprint of the organization’s activity, it lacks additional contextual detail needed to fully understand the movements and behaviors of the individuals within this network.
Analysts can leverage key tools within AllSource that are dedicated to working with this type of data:
- Reconstruct Tracks tool: used to consolidate 200,000 disparate points into 49 distinct track lines; one for each person in the organization.
- Find Meeting Locations tool: used to identify key meeting location polygons associated with these individuals where their tracks overlap in space and time, as well as point features representing all unique pairs that were occupying the same space and time.
New Timeline Functionality
Now that we have our newly constructed track data, the timeline can be leveraged to help further our analysis. Adding these tracks to a timeline creates a better understanding of where and when the individuals in this organization are operating to identify patterns and locations of interest that can’t be seen from the map alone.
For example, the timeline shows three distinct chunks of time when the individuals of this organization are active and moving around. Utilizing the cascade timespan capability reduces overlap and breaks out these blocks into individual movements to visualize:
- When individuals are operating
- How many individuals are involved in each block
- Which days or times are more active than others
These findings may potentially signify a lead-up to a major event.
Adding additional contextual layers to the timeline, like meetings, allows an analyst to track correlation between these tracks and locations of interest for this organization. Updates to the timeline contents pane allow users to easily reorder layers to move these meetings to the top of the timeline where they are more easily viewed and accessible.
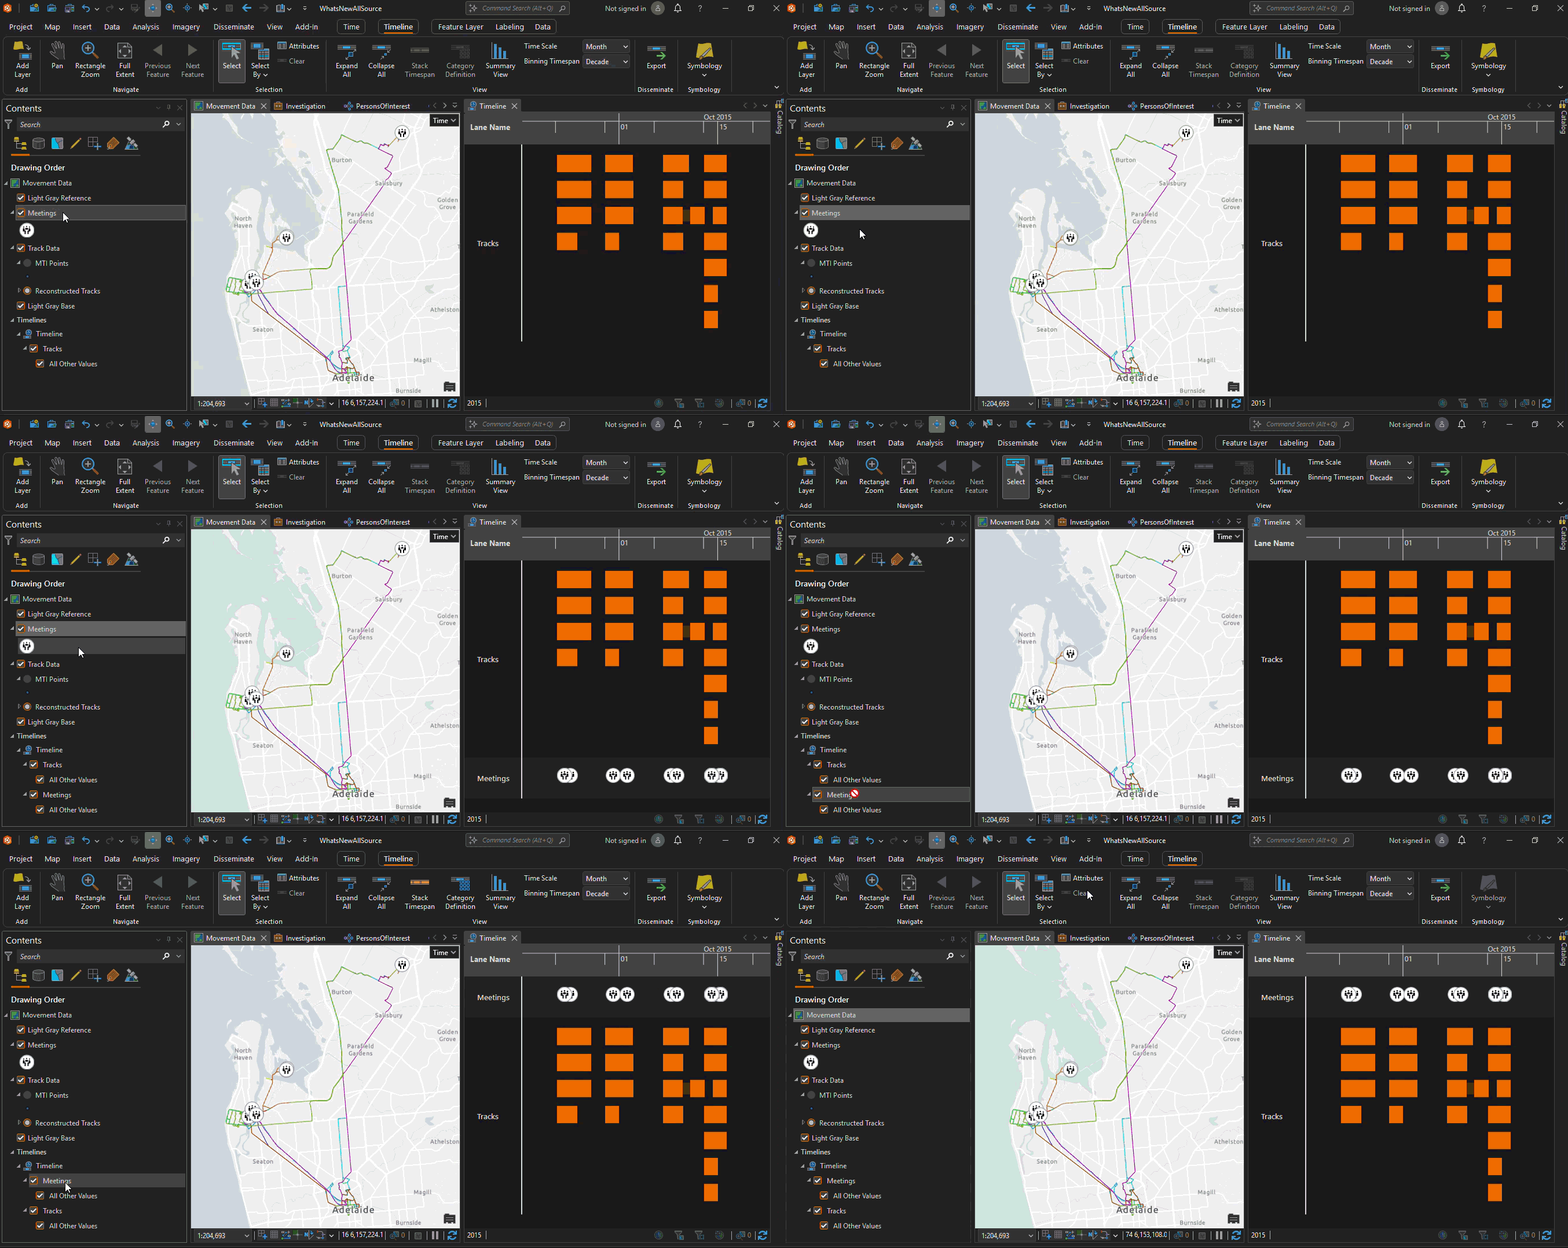
Data layers can also be broken out based on a category field. In this example, the track data is broken out by individuals, to better visualize movements for each member of this organization. This dataset has 49 individuals that are being tracked, making the timeline slightly congested. In the contents pane, lanes can easily be turned on and off, to narrow the focus to only specific individuals of interest and reduce extraneous data.
Gaining Insights with File Knowledge Graphs
To figure out who these key players might be, this data can be leveraged in a file knowledge graph. File Knowledge graphs are stored on a local machine and do not require connection to an enterprise or ArcGIS Online, allowing them to be run in a completely disconnected environment and without access to a knowledge server.
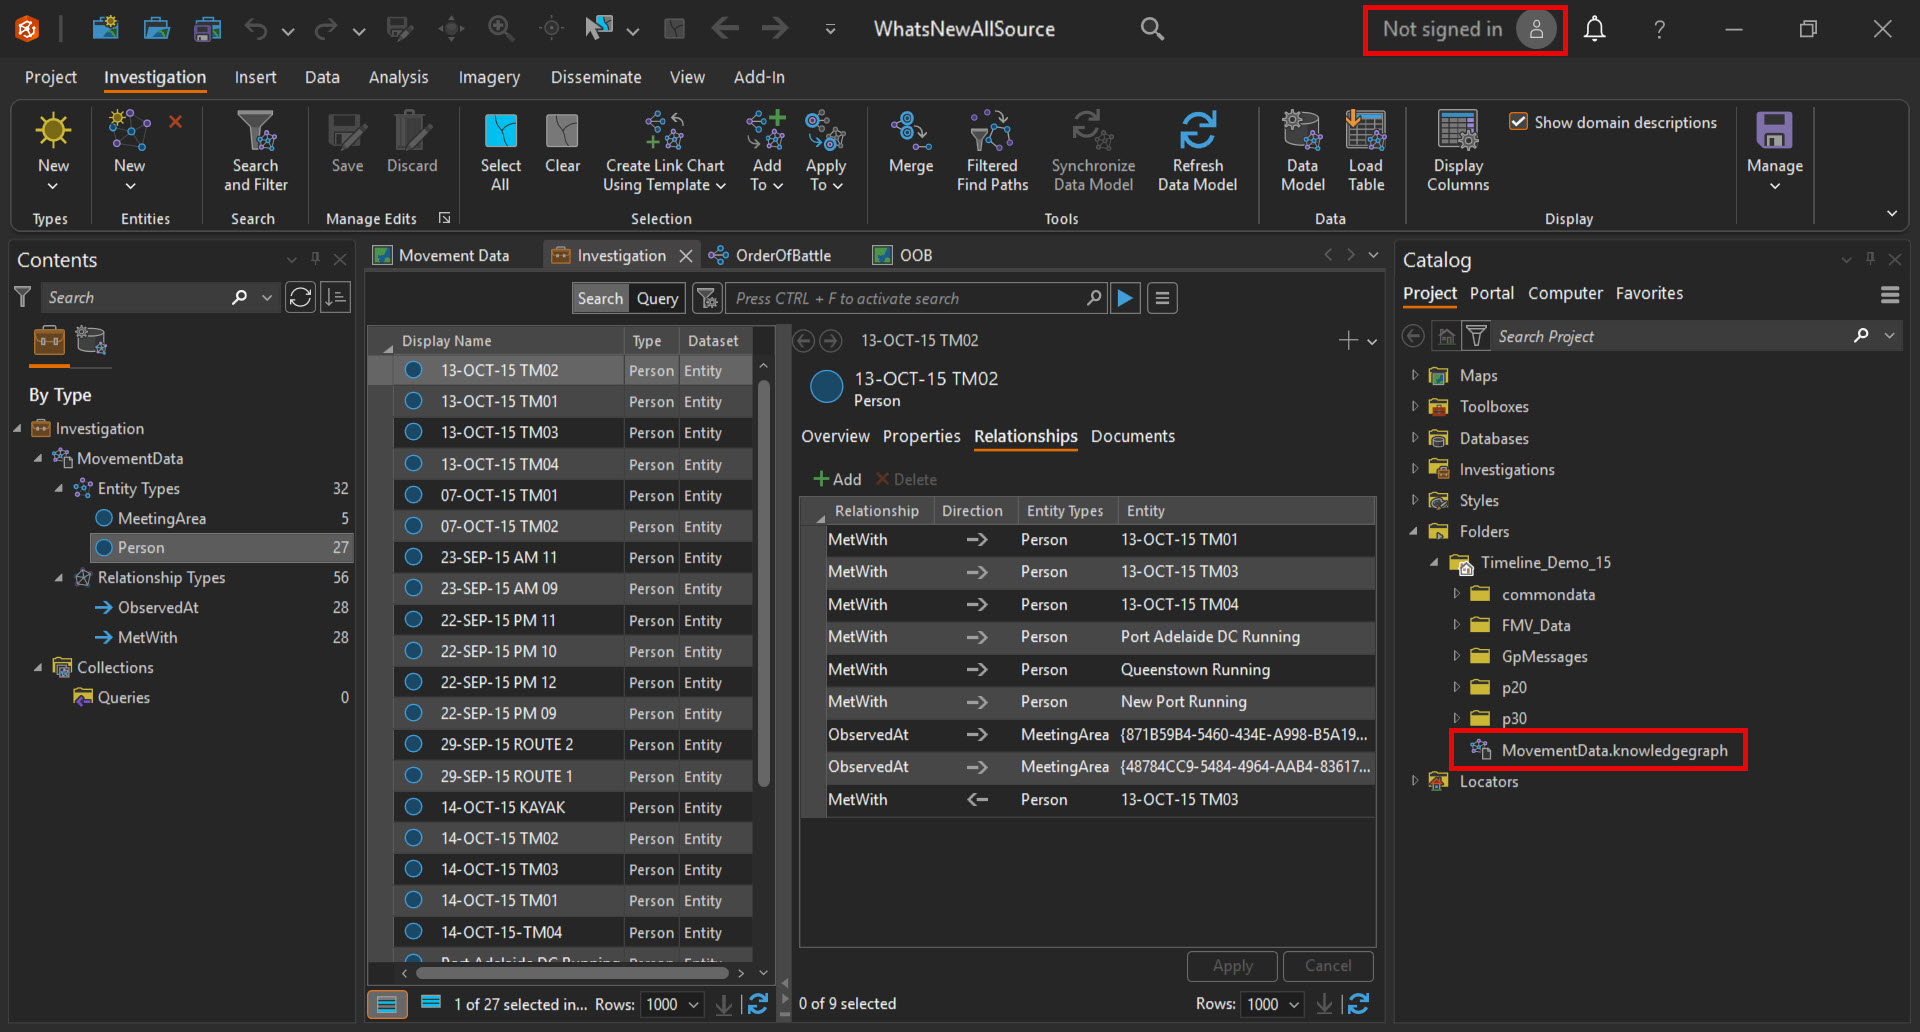
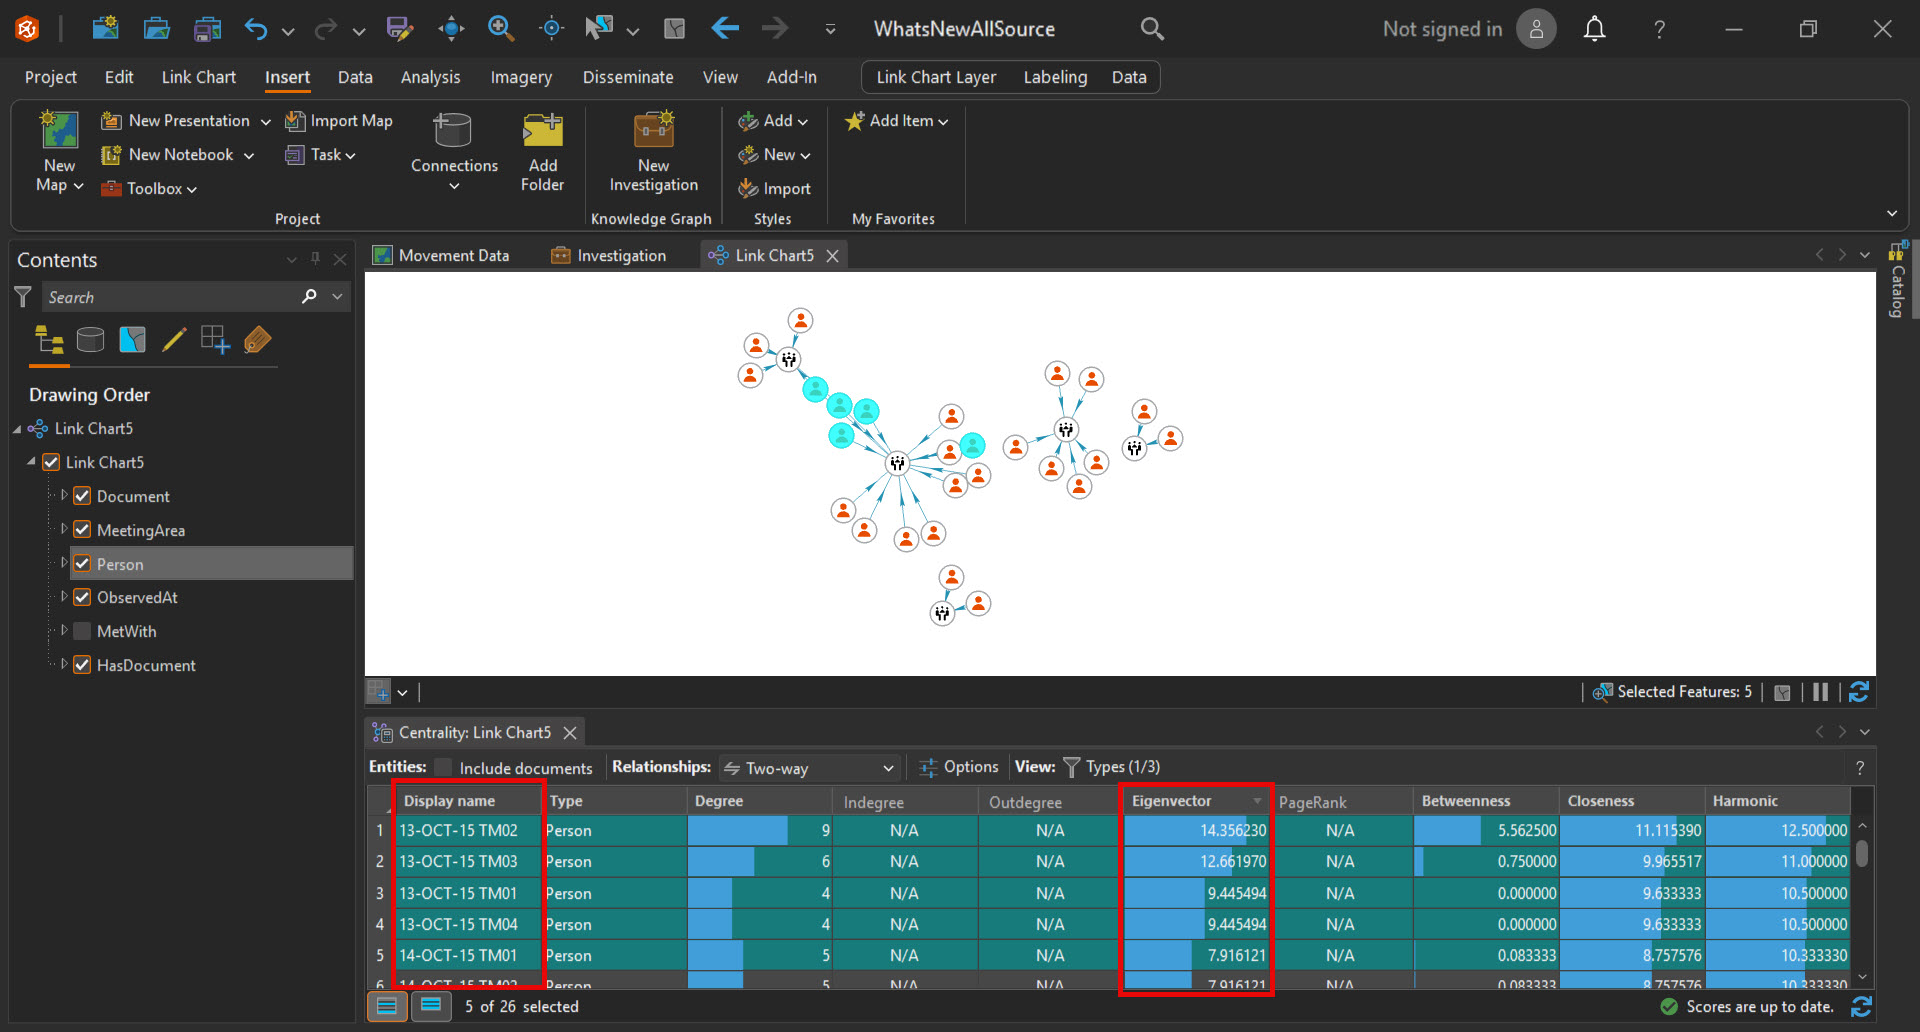
For single desktop users, these graphs operate almost identically to those coming from a graph service and allow users to leverage tools like this link chart visually depicting the interactions of individuals in my organization. Analytics like centrality, which provide rankings of entities depending on their position in the graph, can be run to help identify the most influential people in this organization. Those with higher eigenvector scores have more interactions and influence in this network.
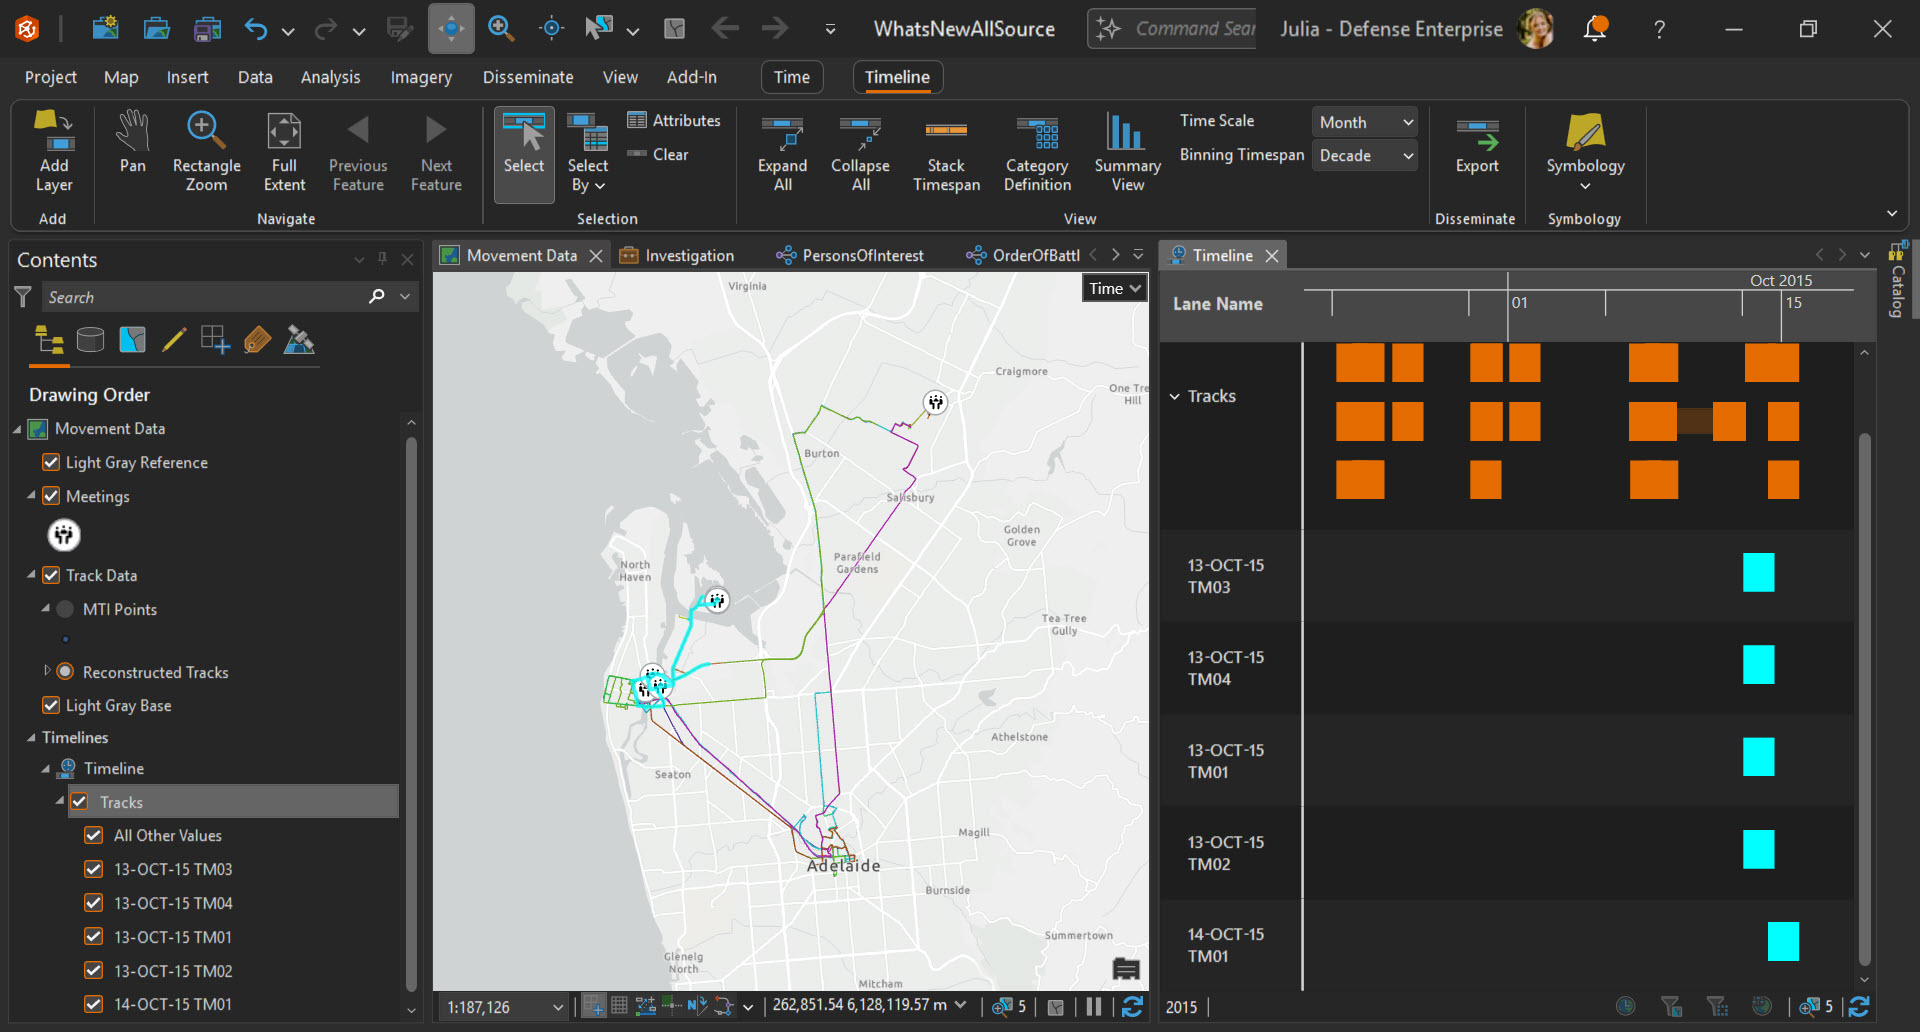
Once these key players have been identified, the timeline can be filtered to focus on these individuals in greater detail to see when and where they might be operating. Leveraging the timeline in conjunction with the map helps to narrow down the area of interest for this organization from an entire city to a much smaller region near the ports and can help analysts to identify where and when future surveillance efforts should be focused.
Increasing Productivity of Intelligence Workflows
With just a few tools analysts can streamline their workflows, cutting though hundreds of thousands of records in a matter of seconds, to quickly identify key insights from complex spatiotemporal data. Movement tools, the timeline, and file Knowledge graphs work together to rapidly identify key players and key locations within a network of interest. The resulting analysis can then be efficiently shared across the organization, transforming raw data into clear, actionable, decision support.

Article Discussion: