The 2015/2020 U.S. Esri Updated Demographic data is now available across the ArcGIS platform, and it reveals some very interesting trends about population growth, aging, diversity, housing and more.
- The 2015 U.S. population is 318,536,439, an increase of 3.2% since 2010.
- Population growth in the South continues to outpace growth in the rest of the US, 4.6% since 2010, compared to 3.8% in the West, 1.5% in the Northeast and 1.4% in the Midwest.
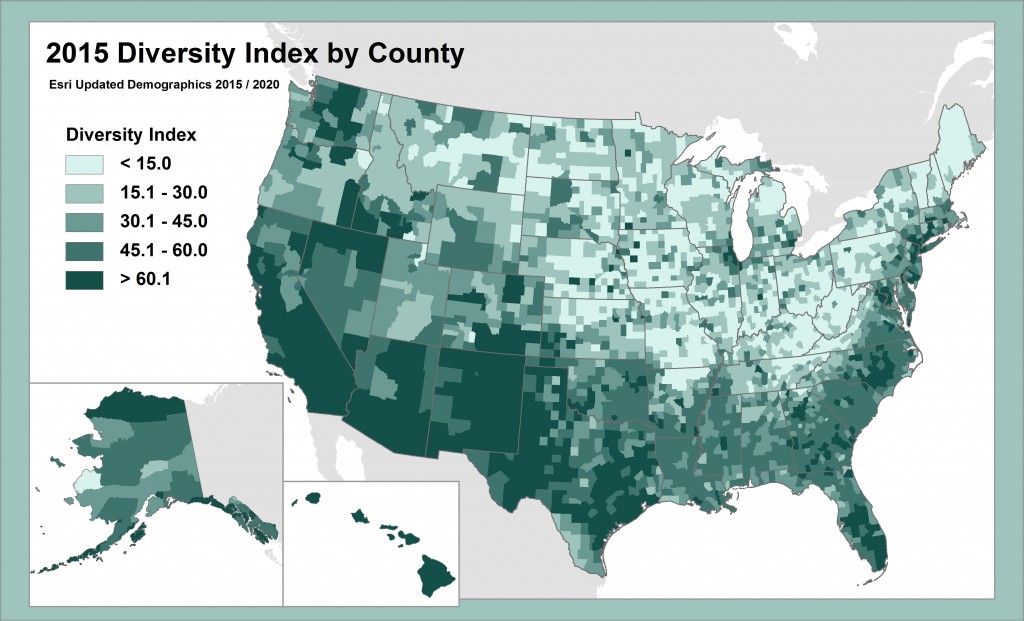
- The country is becoming more diverse. The Hispanic population now accounts for 17.6% of the total population and is expected to increase to 19% by 2020. The Diversity Index (the likelihood that two persons, chosen at random from the same area, belong to different race or ethnic groups) based on counts from Census 2010 for the United States is 60.6. The Diversity Index based on 2015 updates stands at 63, and it is expected to rise to 65.3 in 2020.

- The population is aging. The median age has increased to 37.9 years in 2015: 30 states have median ages of 38 years or older. Nine states have median ages older than 40 years.
- Housing construction has declined slightly in the past year, with fewer than a million new units added. Regionally, the South still holds the lead, with more than half of the new housing units. Since Census 2010, the South has added more housing units than West, Northeast, and Midwest combined.
This release of 2015 U.S. Esri Data also includes updates to the following databases:
- 2015 Tapestry Segmentation Data and Reports
- 2015 Consumer Spending Data and Reports
- 2015 Market Potential Data and Reports
- 2015 Retail MarketPlace Data and Report
- 2015 Business Summary Data and Report
- 2009-2013 American Community Survey (ACS) Data and Reports
- 2014A U.S. Crime Data Update
- 2015 U.S. Traffic Count Report
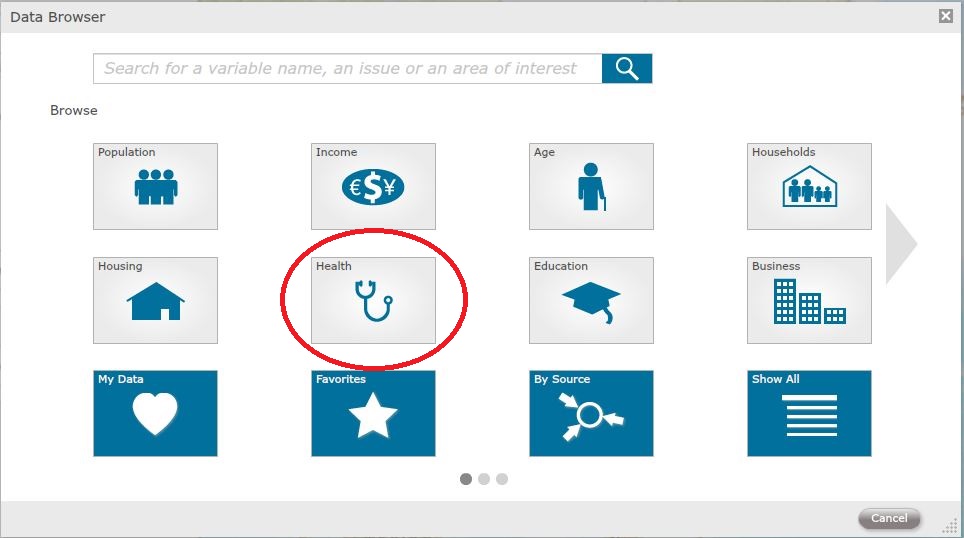
A new U.S. Health Data Collection has also been released which includes data most needed by the Health industry including population by age, average amount spent per household on various medical categories, health insurance coverage by age, households with a person with a disability, and counts of employees working in the health industry. This collection contains Esri Updated Demographic data, Tapestry Segmentation data, ACS data, Consumer Spending data, and Business Summary data.

This 2015 U.S. Esri Demographic data is now available on ArcGIS Online through web maps, data enrichment, reports, and infographics. The data can also be accessed through Esri Business Analyst products and apps such as Esri Community Analyst, Esri Maps for Office, ArcGIS Pro, and Explorer for ArcGIS.
All updated methodology statements, variable lists, report samples, and other documentation are now available at http://doc.arcgis.com/en/esri-demographics/data/us-intro.htm.
Here is a small sampling of the new 2015 U.S. web maps:
2015-2020 Population Growth Rate in the United States
2015 Median Home Value in the United States
2015 Median Household Income in the United States
2015 Adults That Exercise Regularly in the United States
2015 Facebook Users in the United States
2015 Frequent Coupon Use in the United States
2015 Grocery Store Market Opportunity in the United States
2015 Health Care Spending in the United States
2015 High Credit Card Expenditures in the United States
2015 Long Commute Time to Work in the United States
2015 Online Banking in the United States
2015 Organic Food Consumption in the United States
2015 Recycling Habits in the United States
2015 Restaurant Spending in the United States
2015 Retirement 401(k) Plans in the United States
2015 Smartphone Ownership in the United States
2015 Tablet/e-Reader Ownership in the United States
2015 Tapestry Segmentation in the United States

Article Discussion: