Please join us on November 9th at 11:00 AM PST for a free Living Atlas Community Webinar!
Communities use policy maps to identify issues affecting people and serve as backdrop to proposed solutions. The best maps about an issue clearly show where things are working well, and where there is an opportunity to intervene. Communities need good data on those maps to inform policy makers as well as the public. One source of this data is the Living Atlas of the World, the foremost collection of global geographic information.
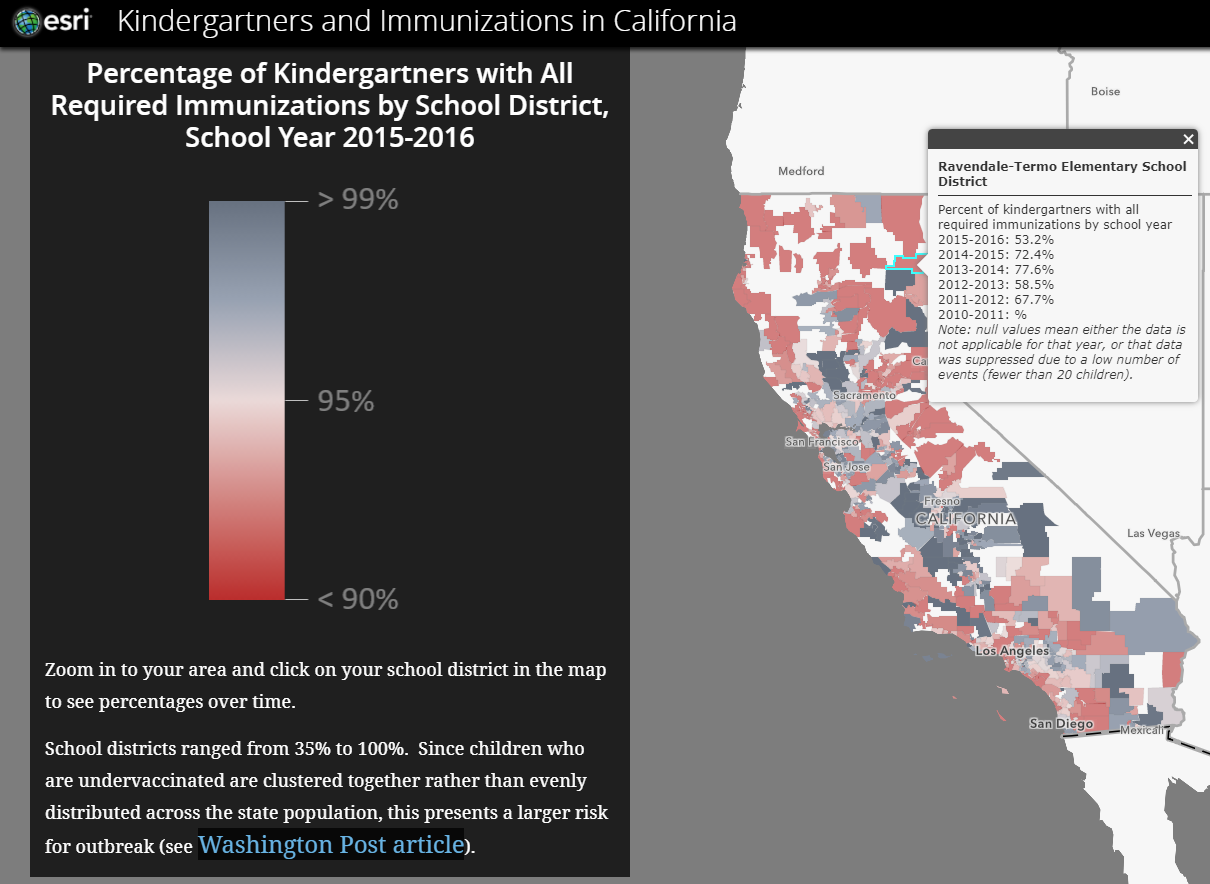
In this webinar Jim Herries and Jennifer Bell walk through several real-world examples where communities have turned data into meaningful maps that identify trends and make decisions regarding policy. (You can preview an example showing the varying levels of kindergartner immunization rates in this Esri Story Map). Join us to learn how to use the Living Atlas, with its myriad of maps and data layers, to make policy maps and apps that reveal community insights otherwise hidden in the data.
Registration is required.


Commenting is not enabled for this article.