One of the advantages to working at Esri is the access to so many people resources to help answer questions. The other day, I was writing a blog about the new Landsat 8 imagery available through ArcGIS Online. I wanted to take a few screenshots, so I opened the map component in ArcGIS Online and did a search for Landsat layers. While this returned a lot of options, I became a bit discouraged because there were only three Landsat 8 layers returned…Landsat 8 Views, Landsat 8 Panchromatic and Landsat 8 PanSharpened.
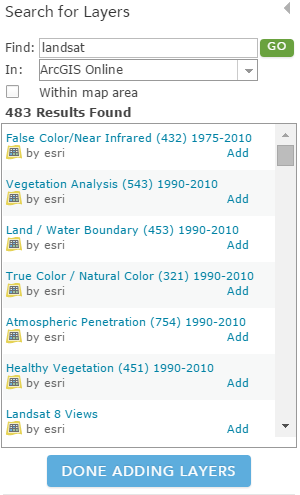
You may be familiar with the older Landsat services in ArcGIS Online and you can see them in the graphic below. They are separated by years, and different common band combinations, like False Color, Vegetation Analysis, Land / Water Boundary, etc. I figured I must have done something wrong in my search, so I tried Landsat8 and Landsat 8, but still only three Esri created options were returned. I picked one, the Landsat 8 Views, so I could see what that provided me. Still no luck finding all the different bands, I decided to place a call to the Imagery product manager.
I explained my dilemma, I wanted to write a story about the different Landsat 8 band combinations, but I couldn’t figure out how to access them. Simple, he said. After you add the ‘Landsat 8 Views’ layer to your map, click the ‘drop down’ arrow and select ‘Image Display’.
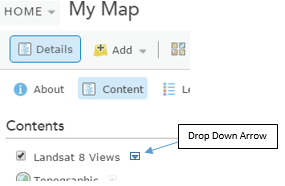
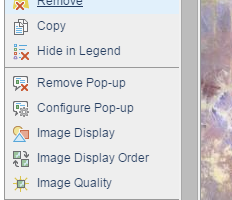
Sure enough, a new option I hadn’t seen before ‘Imagery Display’ appeared…and two other options that I’ve never explored…’Image Display Order’ and ‘Imagery Quality’.
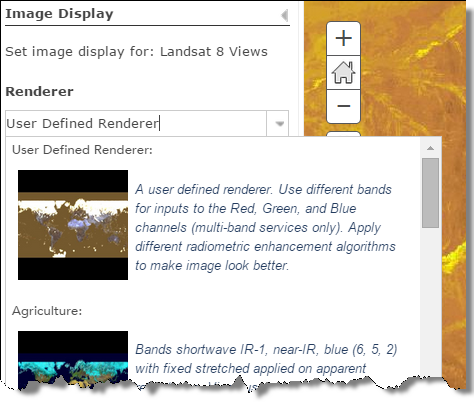
I selected ‘Image Display’ and a new window appears with the option to select different bands to display (under the word ‘Renderer’). Selecting this drop down enables you to pick from multiple common band combinations, NDVI and Normalized Difference Moisture Index. The first option in the list is called ‘User Defined Renderer’. This option enables you to specify any Landsat 8 band combination you want and apply contrast enhancements to improve the image display.
Needless to say, I played with multiple band combinations to see how it affected what I saw in the Landsat imagery on my map.
Now you may thing this next paragraph is a little Esri marketing, but I have to share what I thought was the coolest thing with this. If you follow Esri marketing for our imagery products, you’ve heard Esri say over and over that we have on the fly processing of imagery. What does that really mean? Well, we use ArcGIS imagery technology to serve the imagery layers in ArcGIS Online, including Landsat. The IT manager for the image services configured the ‘on the fly’ processing to share out all the different band combinations for new imagery as soon as it is available. They did this once, in the initial configuration for the Landsat data. After that, as soon as new Landsat 8 imagery is received (which happens daily), the administrator simply adds it to the existing repository of Landsat imagery, and instantly the newer imagery and all the band combinations are available to anyone who needs them. Have you ever tried to manage massive quantities of data that is constantly updating and changing while you have stakeholders who want to use it immediately? If you have, then you already know why having these capabilities are essential!
The ‘Image Display’, ‘Image Display Order’ and ‘Image Quality’ options are available for all imagery served through Esri as an image service, which includes Landsat, NAIP, Elevation data, MDA NaturalVue and MDA BaseVue products. I don’t think we meant to keep this a secret, so I hope you discovered these options prior to my post, but if not, try them out!
Here is a link to another blog post which lists common Landsat 8 band combinations you may want to try out, and what each band represents.
Check out this Landsat 8 image on our Esrigram account using bands 7,6,5.

Article Discussion: