The next update of the Business Analyst (BA) Web and Mobile apps is planned for the end of June. This update will include Esri’s 2017/2022 projections and estimates for the U.S., a major update for the BA Mobile App, and several new and improved workflows.
Here is what we have planned:
2017/2022 U.S. Demographics and Data Updates
- 2017/2022 estimates and projections for U.S. demographics, daytime population, consumer spending, market potential, business data, and more
- Learn more about a variable with additional description in the info icons
- MBR data updates for 34 countries primarily in Asia and the Middle East
Learn more about the specific data variable and report changes.
View Historical Traffic Data in One Click
Map historical traffic counts data and visualize traffic patterns in the U.S. For example, you can easily determine the locations on Sunset Blvd in Los Angeles for the last 10 years where traffic count have been above 10,000.
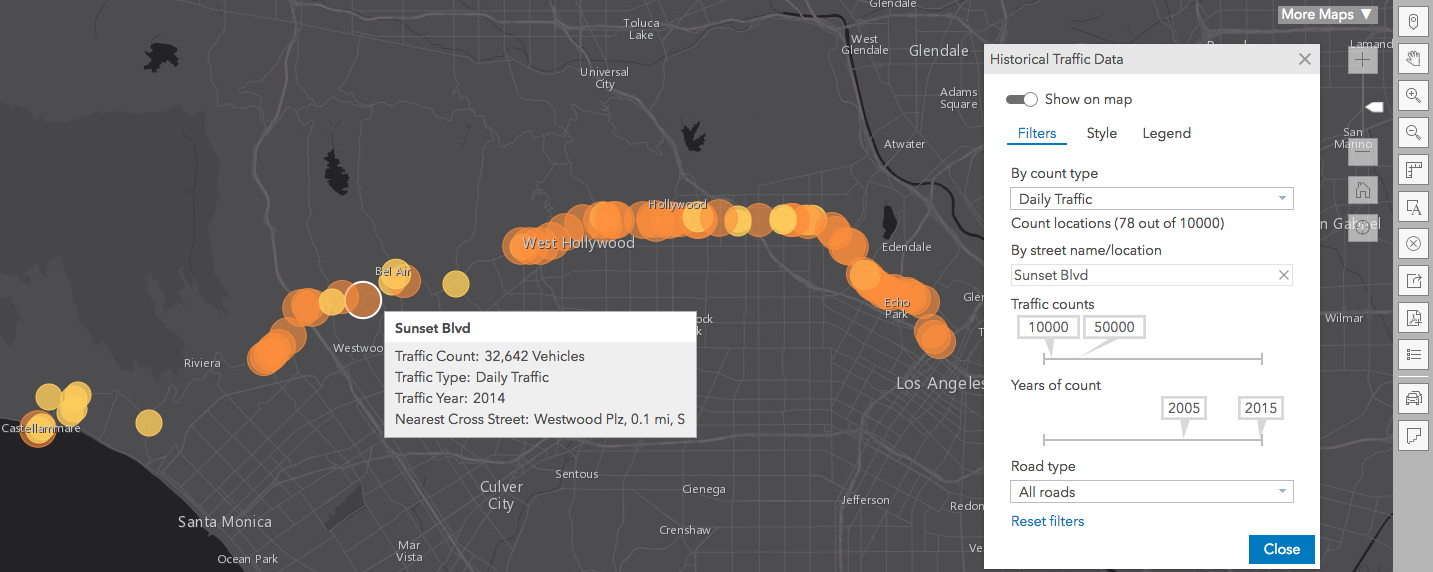
Sourced from Kalibrate, the historical traffic counts data shows traffic volume by the number of vehicles that cross a certain point of a street location. You can visualize different traffic counts including daily and weekday counts. Filter the mapped data by count values, year of count taken, road type, and street name. Style the data using a number of visualization and appearance choices so you can see and understand the traffic data more effectively.
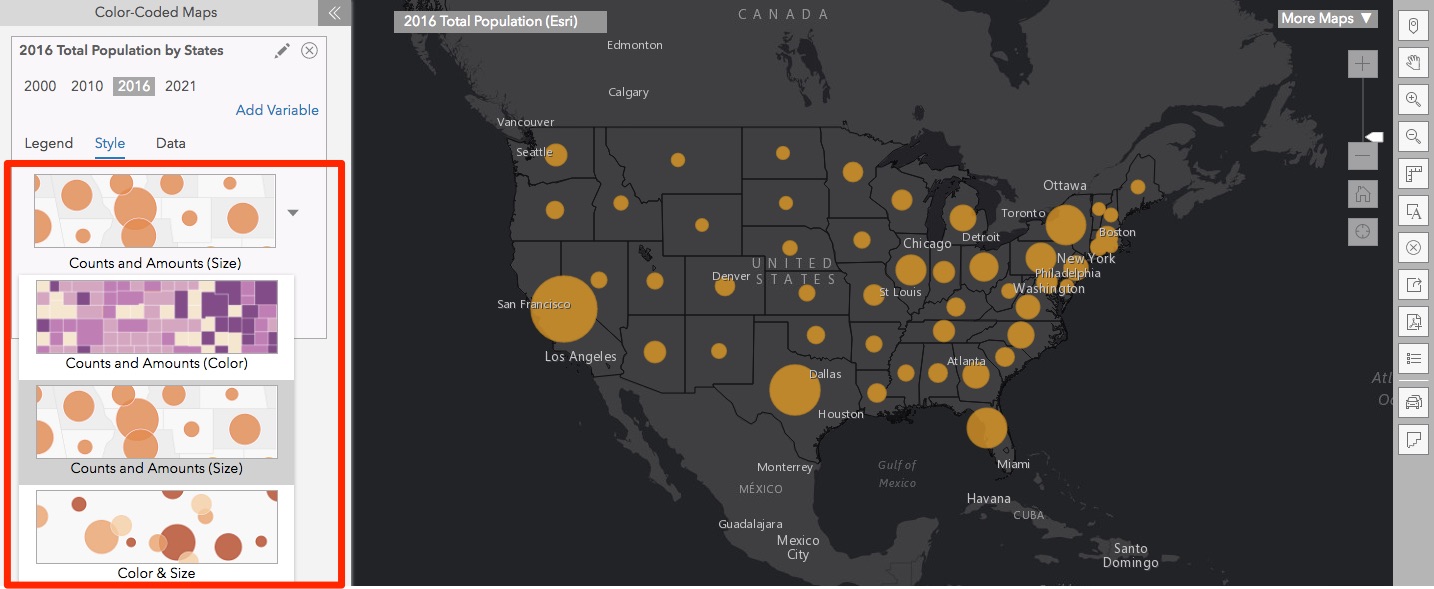
Use New Mapping Options to Visualize Data
Leverage additional mapping options that you use in other parts of the ArcGIS platform. BA Web App will support Smart Mapping options that help making beautiful maps even easier. Use proportional symbols, improved categorical mapping, and more styling options as part of the color-coded mapping workflow. You will be able to create color-coded maps as easily as you have always been.
For example, you can quickly map population using a proportional symbol mapping option and understand the population distribution even more easily. High population states in the map below are popping out much more clearly than how you visualize them in a color-coded map.
Create Maps using Two Variables
Need to find areas where population is low but population growth is high? Or where income is low but population is high? You will be able to answer these questions easily by creating maps that include two variables. For example, the map below shows total population and median income by states in one view. Darker icons show higher income, larger icons show higher population, and vice versa. Immediately you can see that though median income in California is comparatively higher, there are a lot more people living in the north-east side of the country.

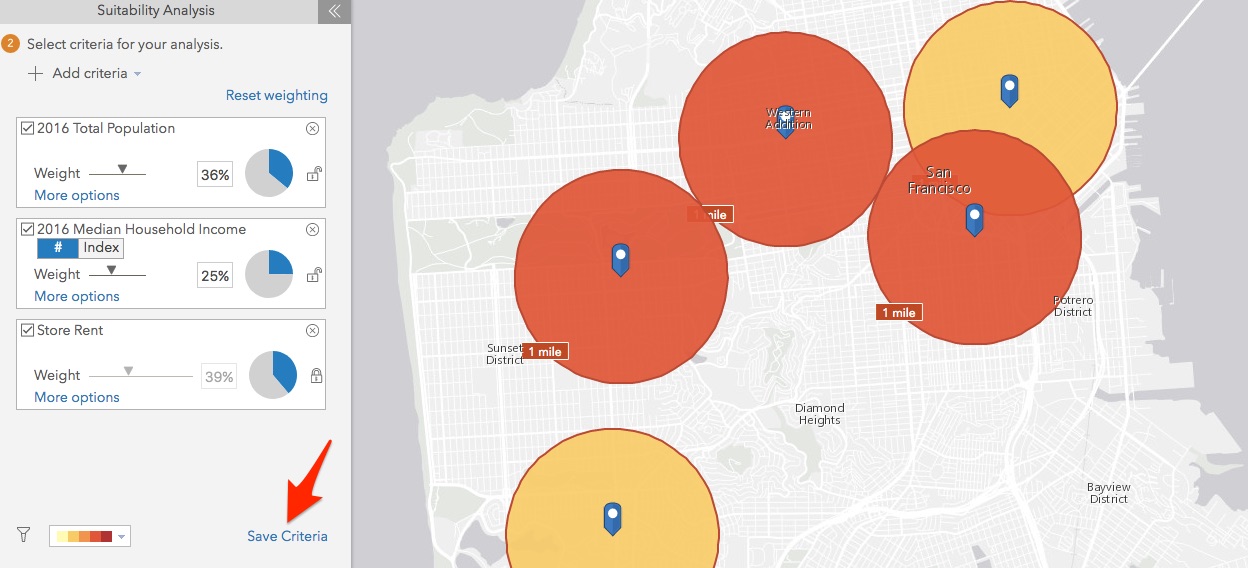
Save and Reuse Suitability Analysis Criteria
Run suitability analysis more efficiently and consistently by creating your suitability criteria once and using it for any set of locations. For example, let’s say your business has a weighted criteria for a set of demographic variables (e.g. population, income), custom data (e.g. sales) variables, and site attributes (e.g. rent and parking). You will be able to save this criteria and run it for selecting sites in San Francisco or Miami or Chicago.
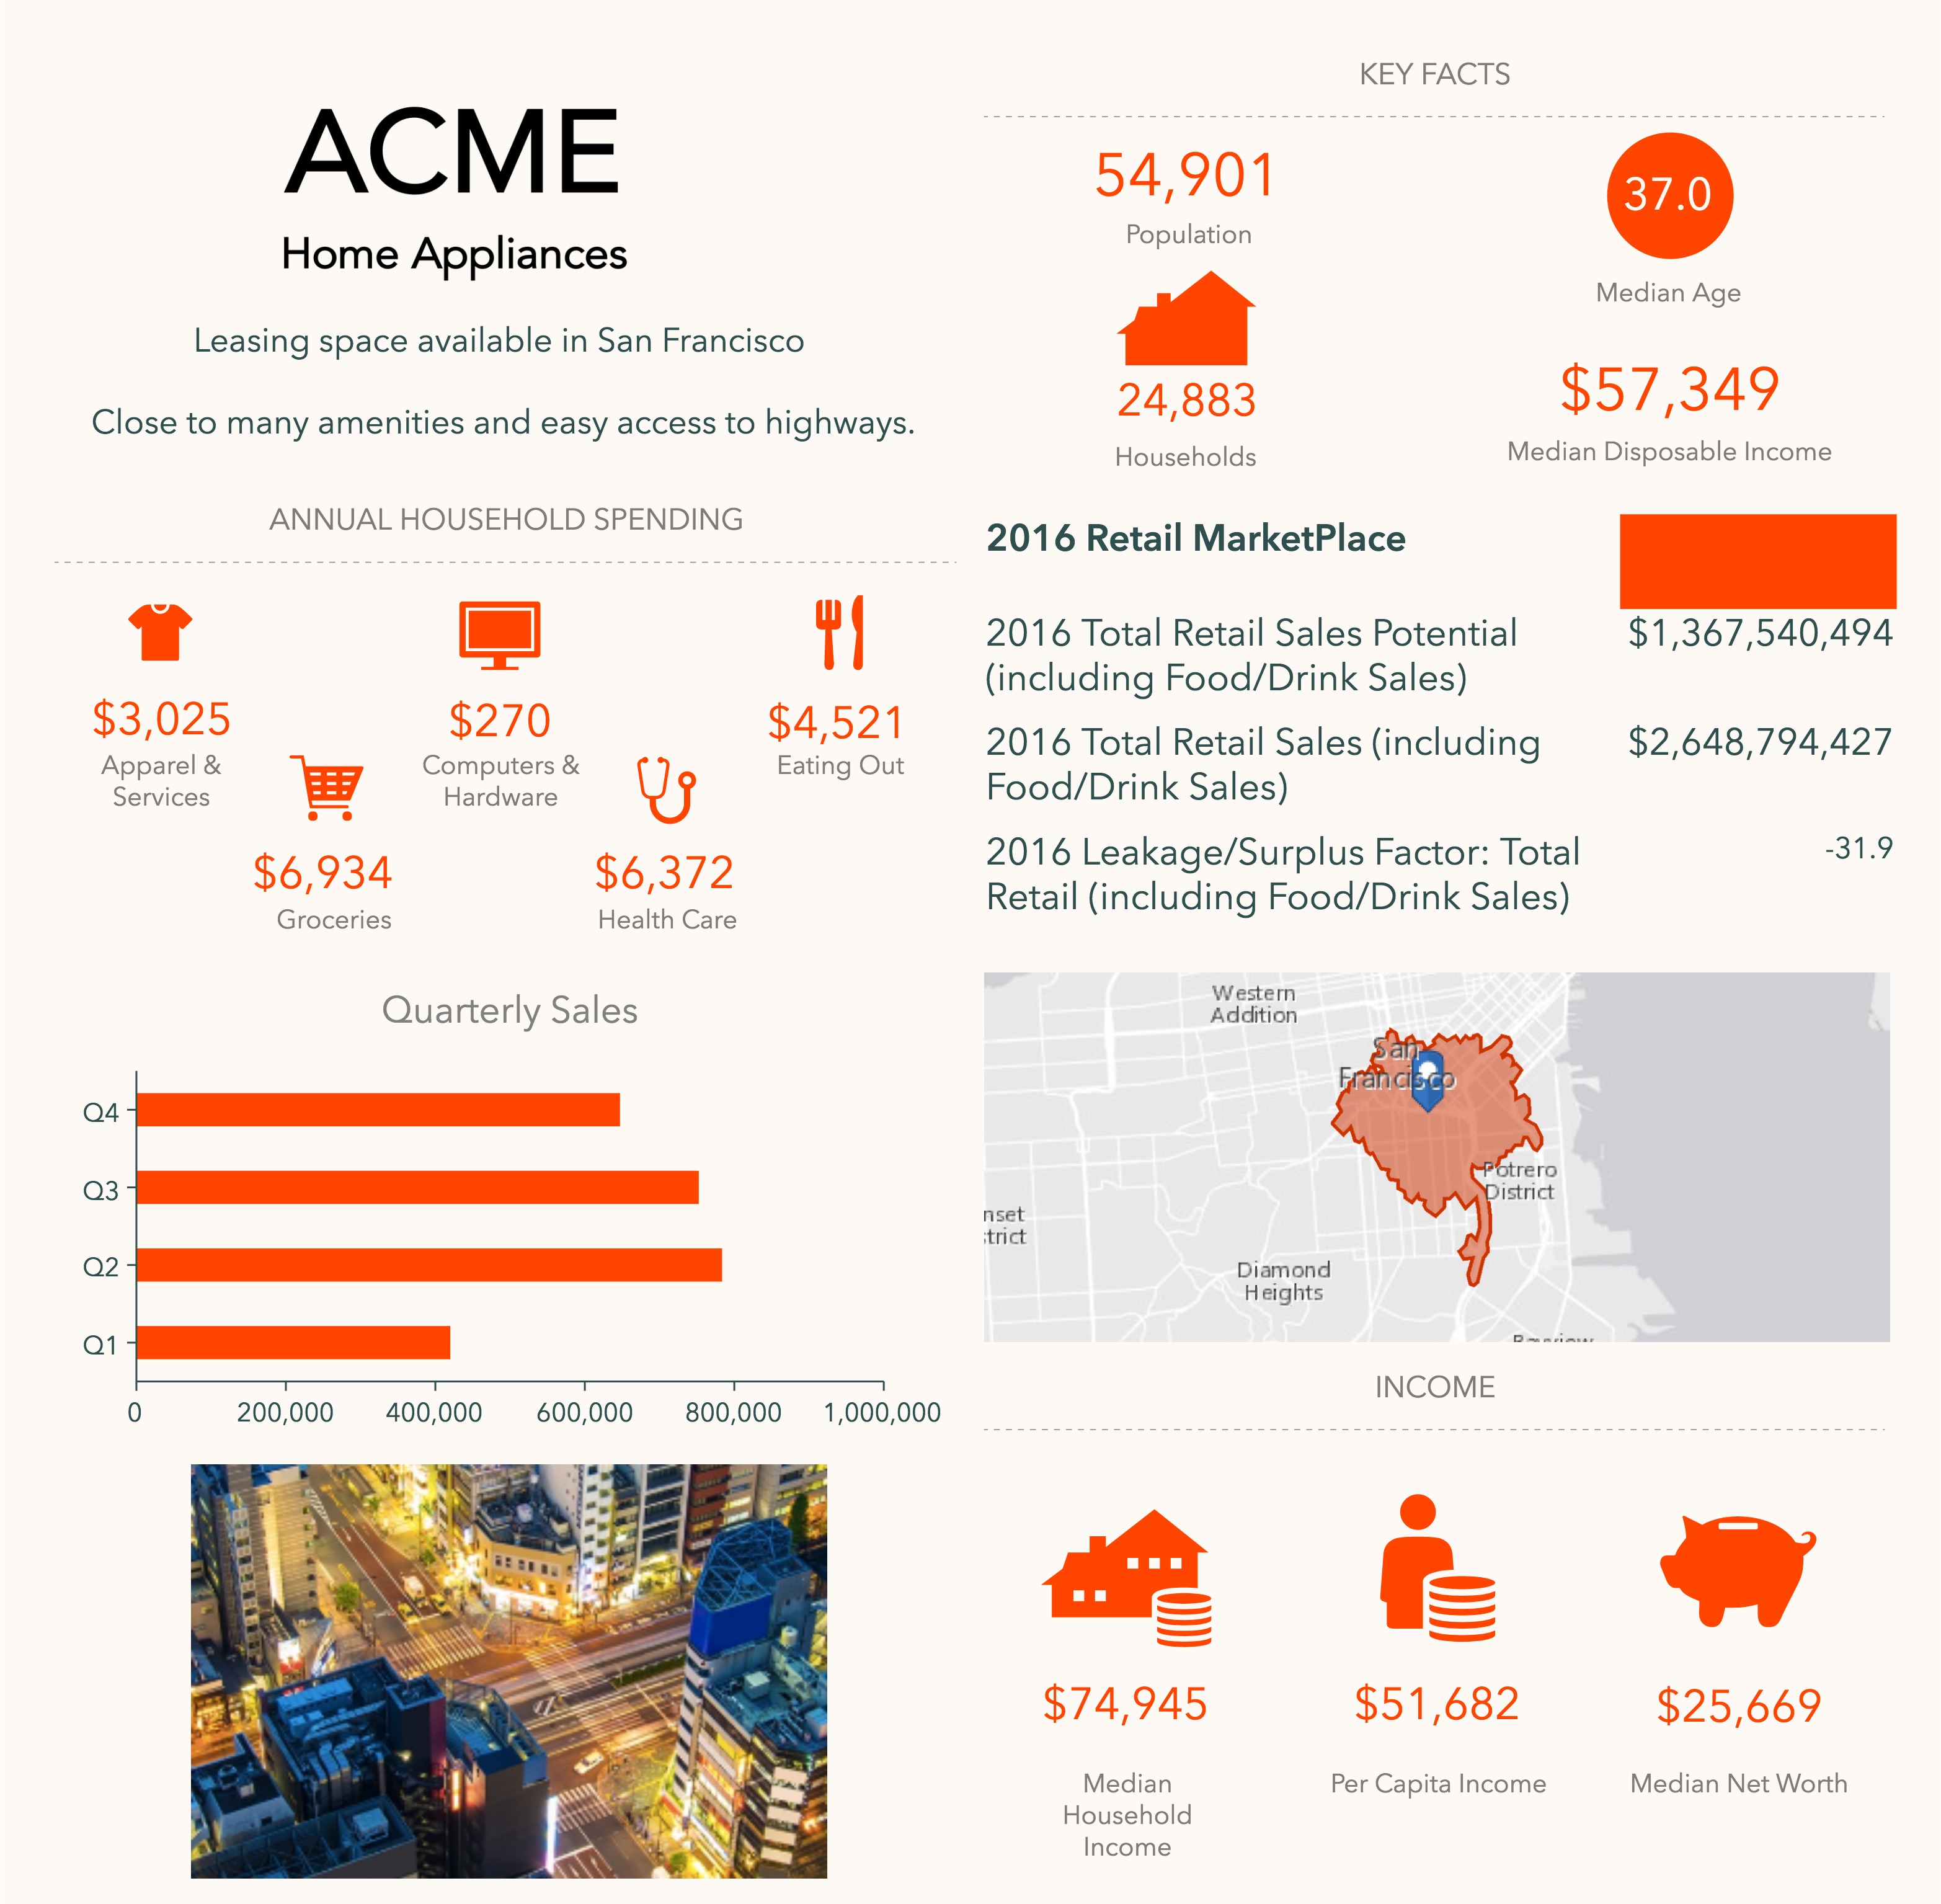
Infographics Improvements
The new custom infographics workflow just keeps getting better helping you make even more professional and beautiful infographics. Here is a highlight of infographic improvements planned:
- New PDF export option
- Improved full screen viewing mode to help provide an immersive experience
- More control over layout using additional merge and resizing options for panels
- Additional custom icons for infographic panels
- New guided tour to help users learn the workflow using a step-by-step walk through
- More chart editing options
- Additional starter templates
- And much more…
Customize the BA Web App Using Your Company’s Branding
Use the new theming options to customize the look of the application the way you want. Add your own logo, change the app title, and apply a theme color of your choice. These options will be available only for ArcGIS organization administrators to help them roll out an app that reflects their company’s branding.
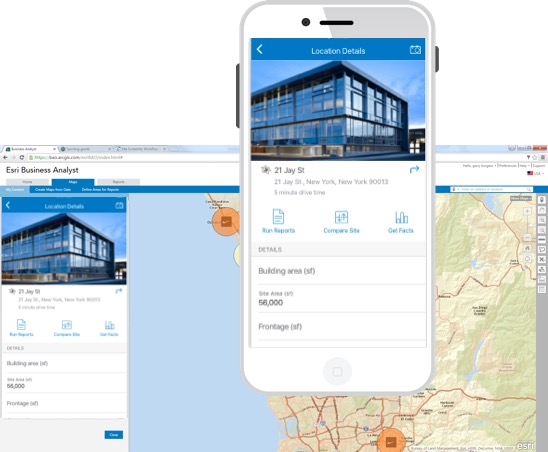
Collect Data in the Field Using the Updated BA Mobile App
Leverage a completely redefined BA Mobile App and make your field visits more productive. In addition to the existing capability of accessing market snapshot for a location, you will be able to capture pictures, site attributes, and field observations and have them sync seamlessly to the BA Web App, helping your office staff use the collected location data in decision making.
Update for the iOS platform is planned for the end of June. Android update is planned for Q3 2017.
Other Improvements
- Custom data setup workflow will allow selecting multiple variables and easier configuration of data categories
- Creating PDF or image of the mapped Business Locations and Imported Points will include site labels
Data Variable and Report Changes
- Updated Retail MarketPlace Release 1 will contain 2016 Retail MarketPlace data brought forward into 2017 geography. The 2017 Retail MarketPlace Release 2 i.e. 2017 Retail MarketPlace data in 2017 geography will be released at a later date.
- ACS data remains 2010-2014 for the June release. They will be moved into 2017 geography but the data itself will remain 2010-2014. ACS 2011-2015 will be released at a later date.
- Market Potential dataset will include 89 new variables and will not have 42 existing variables due to the changes in the underlying survey. This change will reflect in the following reports as well. Feel free to contact us by commenting on the blog if you need more details on this change.
Update 6/13: Retail Marketplace data for 2017 will be released in 2017 geography with the end of June release.
- Electronics and Internet Market Potential
- Finances Market Potential
- Health and Beauty Market Potential
- Restaurant Market Potential
- Retail Market Potential
- Sports and Leisure Market Potential


Article Discussion: