The June update of the Esri Business Analyst (BA) web app brings you the latest demographic data for the U.S. and improved tools for creating custom reports. Below are some highlights:
2016 Esri US Demographic Data
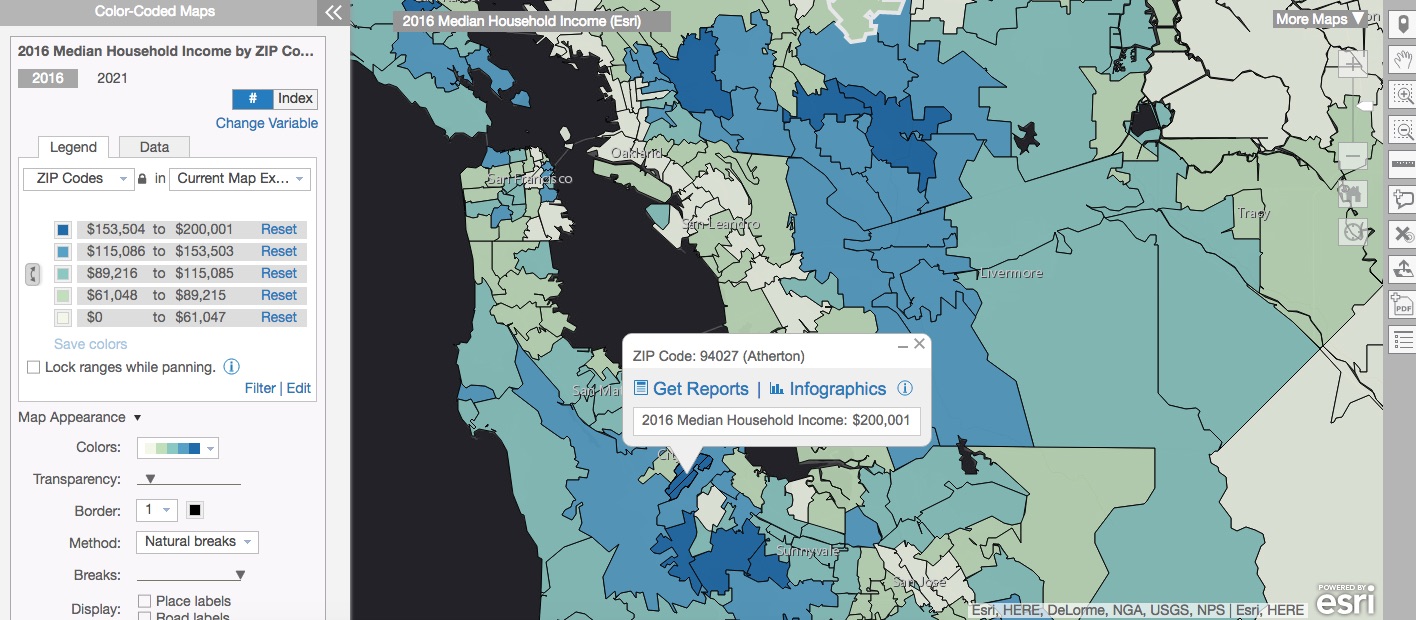
Access the latest demographic data for the U.S. through the mapping, reporting, and analytics capabilities of the BA web app. The updated data is available via the standard pre-formatted reports as well as it can be used in the report builder when working on custom reports.
Esri’s 2016/2021 Updated U.S. Demographics
Updated U.S. Demographics capture the industry’s most accurate current-year estimates and five-year projections for the US population. Updated data on population, age by sex, race by Hispanic origin, households and families, housing by occupancy, tenure and home value, labor force and employment by industry and occupation, marital status, and income including a measure of household wealth and net worth. Some variables have been added to the Community Profile, Housing Profile, and Market Profile reports and removed from the Age 50+ Profile report.
2010-2014 American Community Survey (ACS) Demographics
Updated data representing averages over 60 months, or five years 2010–2014. Based on customer demand, we have added variables on Population 65+ with 2 or more Types of Health Insurance, Households by Household Type and Size, Households with Population <18 by Household Type, Households with Population 65+ by Household Type and Size, Households by Social Security Income, Retirement Income, Public Assistance/SNAP/Disability Income, and Households by Rent as a Percent of Household Income.
The following variables will no longer be available in the ACS data as they are available in Esri’s Updated U.S. Demographics: Population by Marital Status, Population by Educational Attainment, Population by Industry and Occupation, Income, Income by Age, and Home Value. Some variables will be added to the ACS Population Summary and removed from ACS Housing Summary and ACS Population Summary reports.
Census 2010 Demographics
We have added the following variables from Census 2010: Population Inside Urbanized Areas, Population Inside Urban Clusters, Rural Population, Housing Units Inside Urbanized Areas, Housing Units Inside Urban Clusters, and Rural Housing Units. These variables are available on the Market Profile and Housing Profile reports. Some variables have been removed from the 2010 Census Profile report.
2016 Tapestry Segmentation
Tapestry Segmentation is a market segmentation system designed to identify consumer markets in the United States. Reflecting the increasing diversity among American consumers, Tapestry includes 67 distinct market segments and 14 summary groups.
With this release, we will no longer provide a Tapestry distribution by total population. Instead, you will be able to use the Tapestry Adult Population distribution which measures population 18 and up by Tapestry segment and will replace the total population distribution in the Tapestry Profile report.
2016 Consumer Spending
We have combined the latest Consumer Expenditure Surveys (CEX), 2013-2014, from the Bureau of Labor Statistics (BLS) to estimate current spending patterns and has expanded its offering to include:
- Financial assets – current and 1 year ago
- Financial liabilities – current and 1 year ago
- Additional items in household items, clothing, insurance, services, auto, and more
Two major changes in the 2013 and 2014 CEX surveys effectively preclude comparison to previous estimates.
- The surveys were updated in 2013 to consolidate a number of items. This change will produce the removal of more than 90 variables and the addition of almost 50 new variables.
- The other change introduced a different calculation for federal and state taxes. In 2013, the CEX survey changed from reported tax payments to estimated taxes.
- Based on these changes, some variables will be added and removed from all of the consumer spending reports.
2016 Market Potential
We have combined the Doublebase ® 2014 from GfK MRI and expanded its offering to include additional items in electronics, prescription drugs, online gaming, TV channels, pets, shopping, sports, hotels, and more. This update removes 456 variables and adds 77 variables. Based on these changes, some variables have been added and removed from several market potential reports.
2016 Retail MarketPlace
Updated Retail MarketPlace Release 1 which contains 2015 Retail MarketPlace data brought forward into 2016 geography. The 2016 Retail MarketPlace Release 2 i.e. 2016 Retail MarketPlace data in 2016 geography will be released in Q3 2016.
2016 Business Summary and Locations
Updated Business data from Infogroup® that contains more than 13 million U.S. businesses. This data summarizes business listings by sales volume and number of employees into various industry groups defined by SIC Codes and NAICS Codes. It includes the business name, location, franchise code, industry classification code, number of employees, and sales volume–that is current as of February 2016.
Improved Report Builder
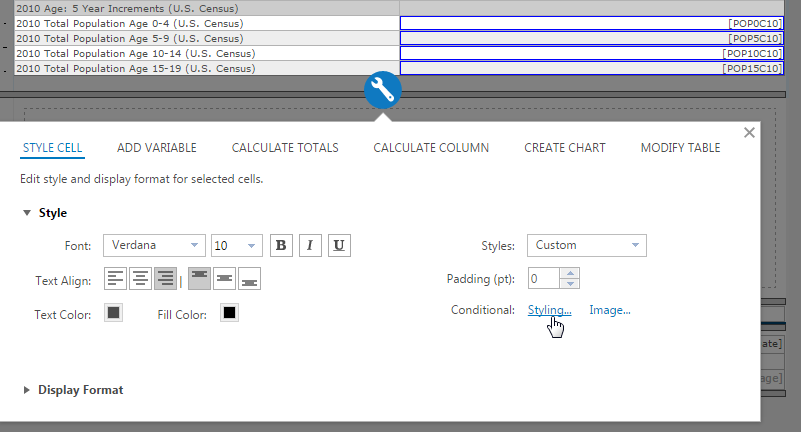
Enhanced Table Editing with a New Popup Editing Dialog
- A more streamlined workflow when working with tabular elements including cells, rows, columns, and their contents. Simplified creation of advanced report content including custom variables, column-based calculations, Rich Text, hyperlinks, and charts.
- A new data-driven way of controlling the look and feel of the report content with conditional formatting. Formatting options include controlling the font, fill, and image displayed in the individual cells based on a numeric value or range. Note that multiple cells can be configured at the same time.
Additional Timesaving Features and Options
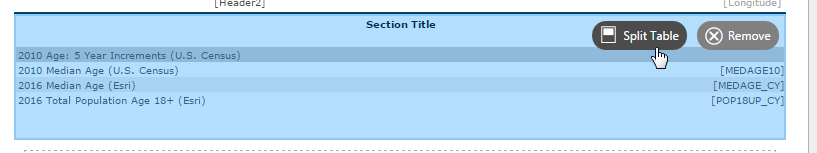
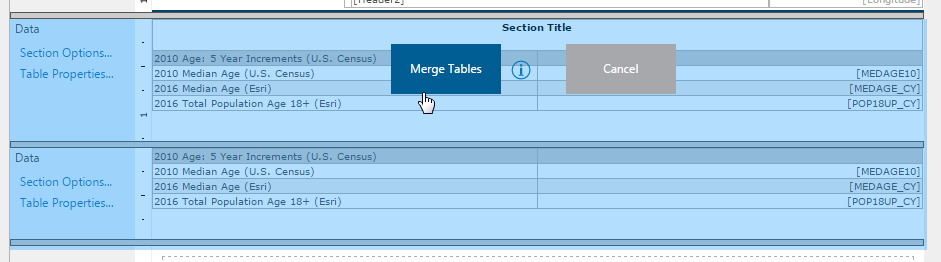
- Merge tables from or split tables into multiple sections while in the preview and editing modes of the report builder.
- Multiple variables can be selected and added to tables within a report simultaneously. When required, rows are automatically added to the tables to accommodate the variables. Support for automatically scaling tables to fit the height and/or width of custom report sections.
- Variable descriptions are automatically added to adjacent columns when variables are added to tables within a report.
- Save user-created custom variables to the My Data repository for reuse in other reports so they do not have to be recreated each time they are needed.
New Ways to Work with Report Sections
- Ability to select and move one or more sections within a report simultaneously and options to label individual report sections and to control their style and layout.
- Support for dragging and dropping individual charts into other sections within a report.
Here is a quick tutorial on how to create custom reports using the report builder. For additional details see the What’s New Help Topic. We will be happy to answer any questions you might have about the data update and Esri Business Analyst.
Login to the Business Analyst web app and check out the latest data and new features.

Article Discussion: