See What’s New!
The ArcGIS API for Python marches on as we’ve released version 1.4. Click here for instructions on how to upgrade, and view the whole range of release notes. There’s a ton to be excited about it in this latest offering, and just in time for the 2018 Esri Developer Summit. Let’s highlight some of the new features so you can make the most of what this API has to offer.
You wanted the option to install the ArcGIS API for Python with pip, so we’ve responded and made a pip package available through PyPi, allowing you to install the API according to your needs. See the documentation here for full details on using the pip package manager to install the API, differences between installing with pip and conda, and much more!
We’ve also added options to the connection experience for using your Web GIS. You now have the ability to initialize a GIS object from a token created externally. The token generated from apps or sessions elsewhere will allow you to connect with the API and access Enterprise or Organization resources. Also upon connecting, we’ve enabled the persistence of profiles so that you can store your credentials locally in a secure manner and log into the GIS using the name of a profile instead of entering credentials. You’re even able to store multiple profiles and use them simultaneously. Check out more details in the Guide for Working with different authentication schemes.
We’re really pleased with improvements we’ve made to the Spatial DataFrame. Incorporation of the shapely package enhances the interoperability of the ArcGIS API for Python. Working with shapely and other geospatial data science packages like GeoPandas and fiona allows the ArcGIS API for Python to read and write almost any geospatial format on any platform. Improvements to the plotting method of the Spatial DataFrame provide an extensive range of symbology options for visualizing data with the Map widget. We’ve also added upload management functionality to the Feature Layer Collection object so you have more ways to attach information where it’s most useful in your GIS. And with more functions added in the raster functions module, the future is bright for all kinds of analysis, visualization and data management with the ArcGIS API for Python.
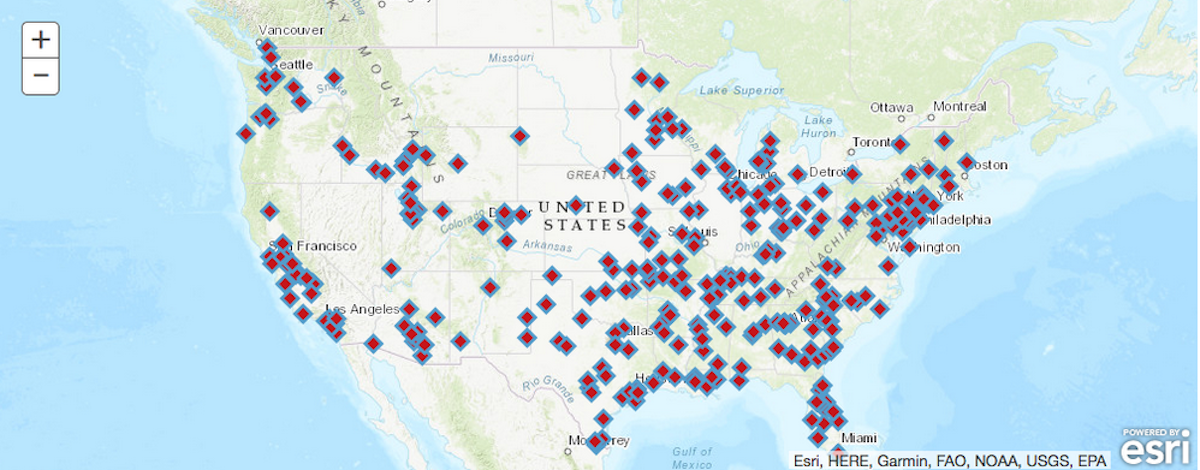
At 1.4, the API has a wider range of symbology options. Take a look:
df.plot(kind='map',

 map_widget=m,

 colors='Reds_r',

 marker_size=10,

 outline_color='Blues',

 symbol_style='d')
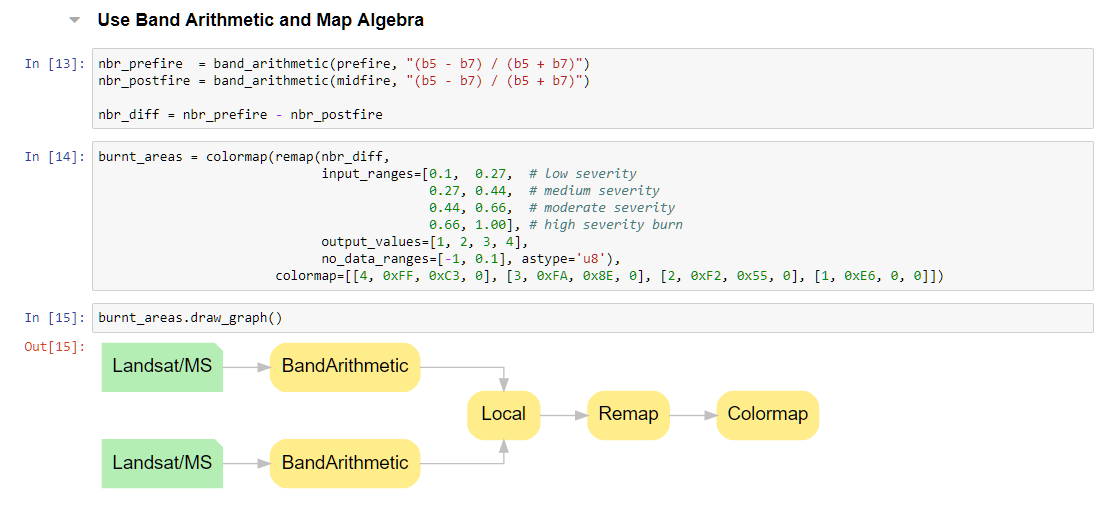
With the new graphing capability for displaying a complex raster chain analysis, you can clearly visualize your workflows:
Interested in learning and using the Python API? We encourage you to consider making it priority number one. Check out this video recording of the GeoDev Webinar Series to get a broad perspective of what you can do with the API. Also, add the ArcGIS for Developers Sample Notebooks and Dev Labs to your to-do list to inspect the capabilities of the ArcGIS API for Python for yourself.
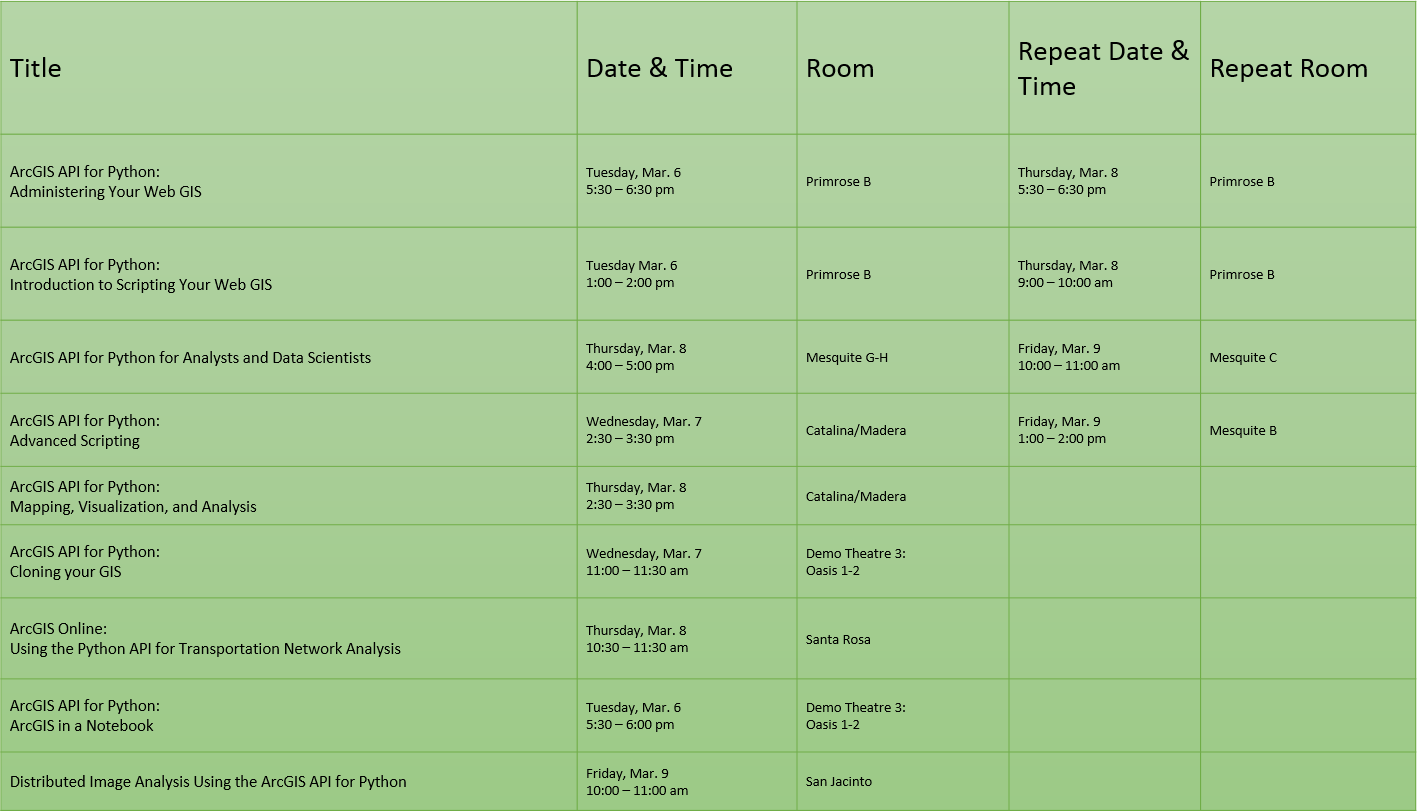
Sessions galore for you to explore at The Developer Summit in Palm Springs – We’ll see you there!
About the author


Commenting is not enabled for this article.