The upcoming update of the Business Analyst web app will include several exciting features requested by our users. This release will enable you to manage your content more efficiently and bring and use your own data. Leverage new analytical capabilities and visual ways of representing market insights. Work seamlessly with the ArcGIS platform both online and on-premises.
We are planning this release for before the end of this year. Here are the six key highlights of what’s coming up:
Manage Your Work Using a Project Structure
We are introducing a projects based content management structure. Projects will be a new way of storing, organizing, and sharing your content. Projects enable you to share and use your work seamlessly across Business Analyst Web, Mobile, and Desktop as well as help access content across the ArcGIS platform so you can use them in StoryMaps, Collector, and other ArcGIS apps.
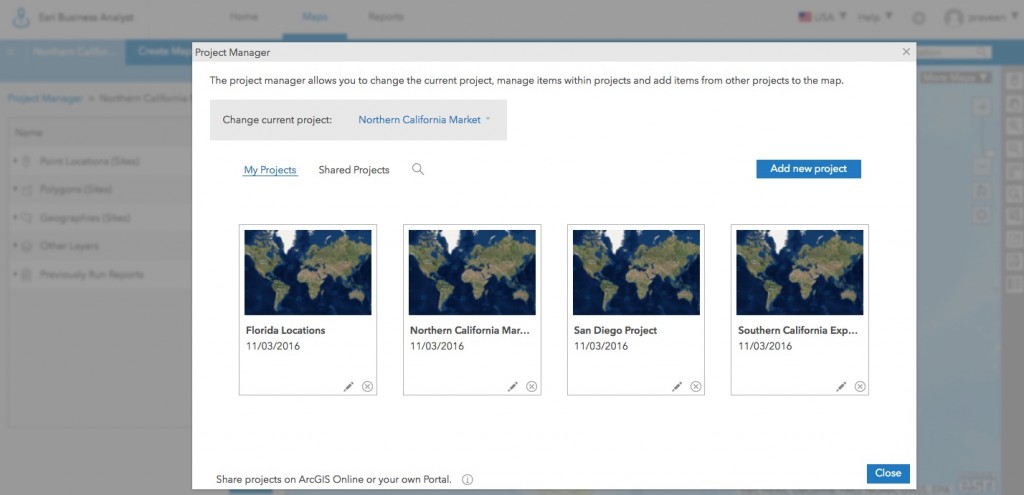
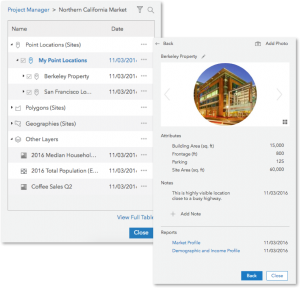
Projects can contain sites, business search points, reports, and various types of layers including imported layers, web maps, color-coded maps, and more – all in one place. When you start working on the map, you need to have a project selected so all the content you create can be saved in the selected project. You will have options to add site details including pictures, notes, and other information such as parking spaces and building area as well as helps you view any report you ran for that site.
The most effective use of projects requires named users to be in a role with publishing privileges. If a named user is in a publisher, administrator, or custom role with publishing privileges, they can create new projects, share them with others, add sites to projects, and run reports. If a named user doesn’t have publishing privileges i.e. ‘user’ role or a custom role with no publishing privileges, they will not be able to create new projects however they can work in the projects shared with them, add sites to shared projects, and run reports.
Bring and Use Your Own Data
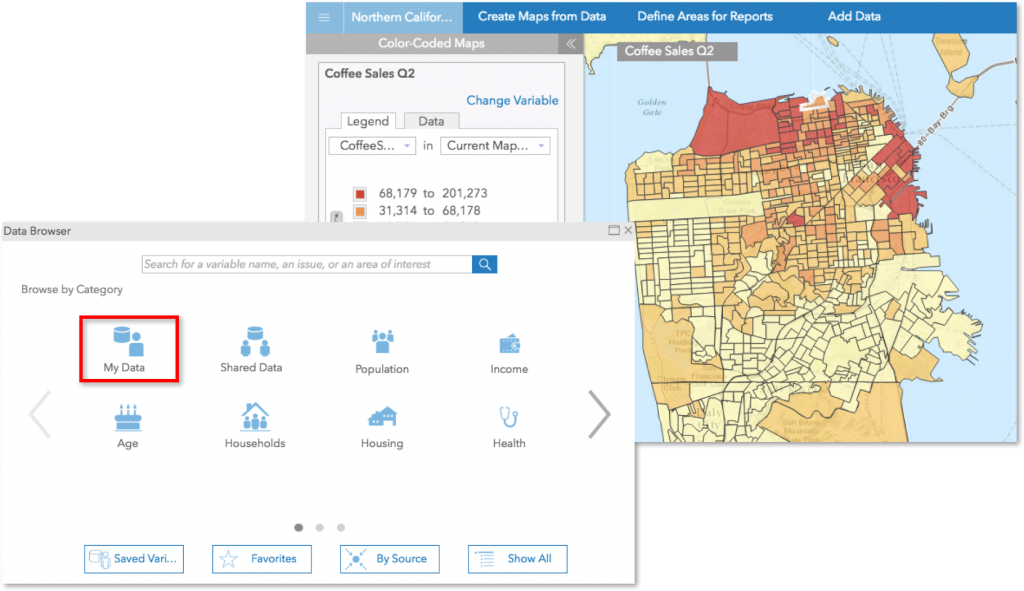
You will be able to easily bring your own data (e.g. sales, revenue, customers data), use them along with Esri Demographics data and perform more customized market analysis. To do this, your data needs to be in a feature layer format in the ArcGIS system. You can directly consume feature layers, choose which attributes to use, and access them via the Data Browser.
Perform Suitability Analysis
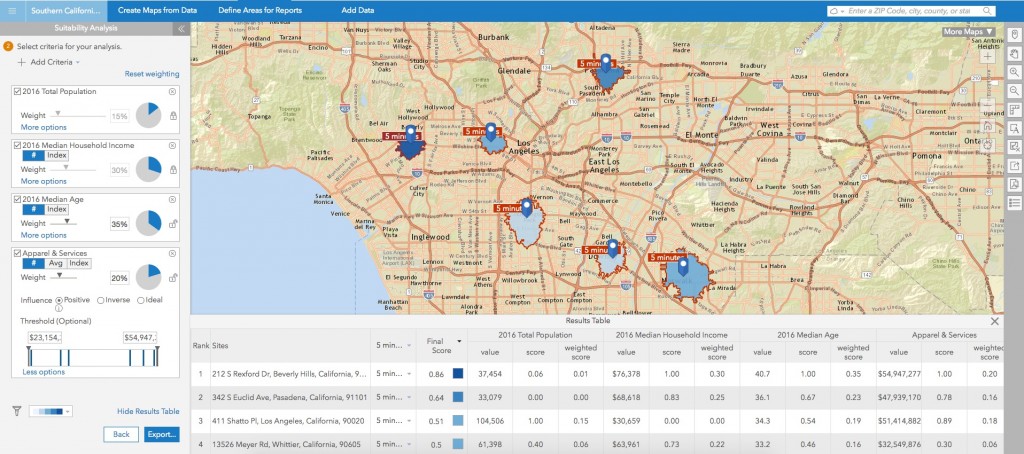
With the new suitability analysis workflow, you will be able to rank multiple locations by their suitability to your location criteria. You can easily factor in weighted scores for various parameters in your location criteria.
Run this workflow on a set of point locations, polygon areas, and standard geographies such as block groups, zip codes, and more. Model your location criteria using two types of parameters – demographic data variables and site attributes from your own data. Assign weights to them, get weighted scores for each potential location, and review their ranks from most suitable to least suitable location.
Create Beautiful Infographics
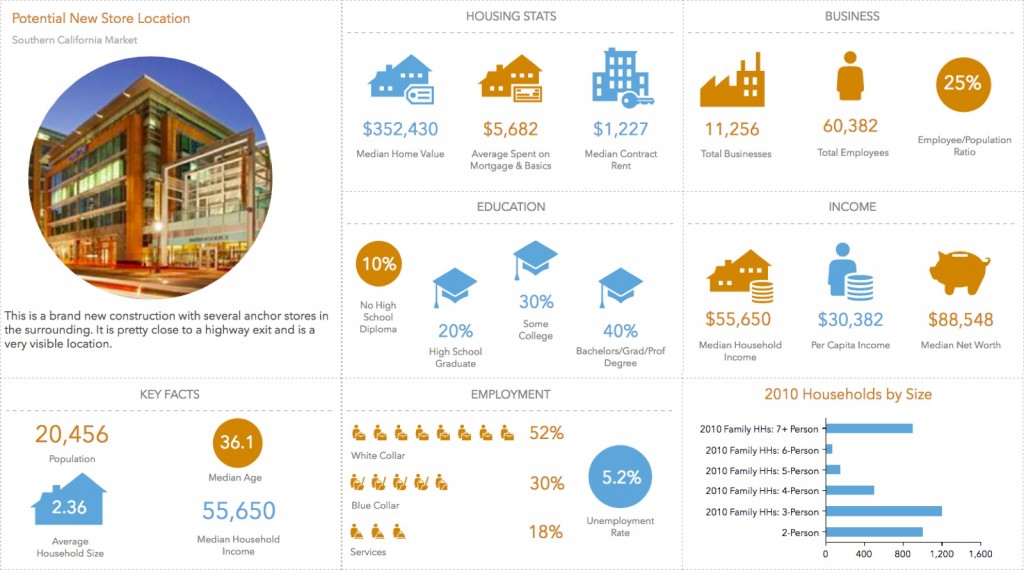
Generate compelling infographics in a few clicks and quickly grasp the demographic insights and your own business information for any locations. Present market information with attractive infographics, impress your clients, and close deals faster.
To create infographics, first create infographic templates and then run them for any site you have on the map. Apply your company’s branding and share infographic templates with your team. View infographics in the site pop up menu and export them as HTML and image.
Use the Business Analyst Web App On-premises
One of the most requested capability by the customers that we are releasing this year is the ability to use the Business Analyst web app in your infrastructure. You will be able to run BA based mapping, analysis, and reporting using your own proprietary and sensitive data behind your firewall.
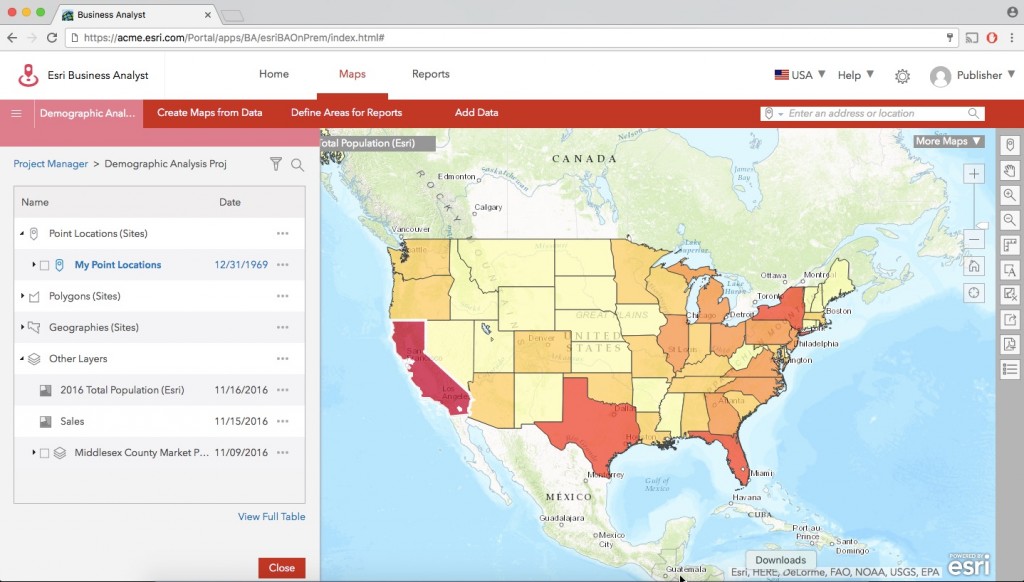
This will be available via BA Server 10.5 which will be a bundle of BA Server software, on-premises BA web app, BA mobile app, and BA Desktop, and demographic data services on-premises.
Leverage Daytime Population Data
We are pleased to introduce a new dataset in the U.S. called Daytime Population which estimates the number of workers and residents in an area during the day. This dataset will be available in the online release of the BA web app. Trade areas can contain very distinct day and night demographic profiles. Esri’s daytime population model provides invaluable insight into an area’s day part population expansions and contractions.
Additionally in the online release of the BA web app, there will be a number of international data updates including demographics for Canada, China, Russia and some European countries (Belgium, Denmark, Finland, France, Germany, Italy, Netherlands, Norway, Poland, Spain, Sweden, Switzerland, UK).


Commenting is not enabled for this article.