Have you ever wanted a dynamic table in your map layout that updated attribute information as you panned and zoomed or as you navigated through a map book? Based upon numerous requests posted on the ArcGIS Ideas site for this specific capability, I’m guessing the answer is YES!
For those not aware, Esri Production Mapping’s graphic table element allows you to create dynamic, data-driven tables in your map layout. The use of dynamic tables is not limited to map documents enabled with data driven pages, they’re useful in any map document that requires table content be updated with changes in the visible extent of the data frame. Below, I’ll highlight steps for adding a simple dynamic table to a state map book that will list the state capitals visible on each page.
![]()
Assuming you’ve already built a state map book using data driven pages, let’s go ahead and get started!
- In ArcMap, click Insert > Graphic Table Element.
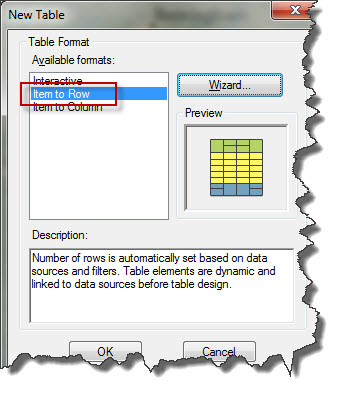
- In the New Table dialog box, choose Item to Row for the Table Format. Click the Wizard button.
- In the Set Table Format dialog box, choose Auto Fit cells for the Width
and Height properties so the cells will automatically adjust to fit the returned attributes. Click Next.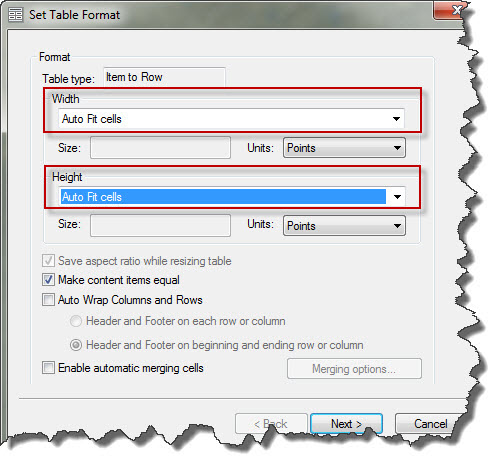
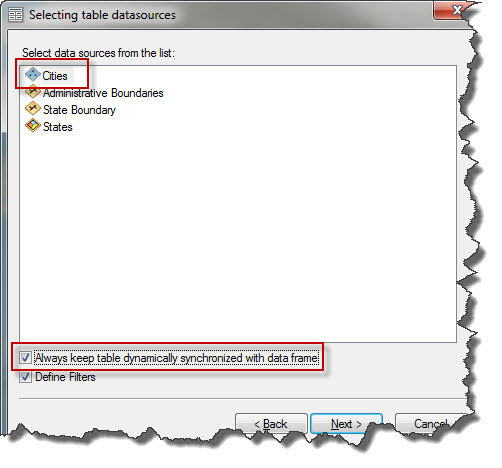
- In the Selecting table datasources dialog box, choose the Cities feature layer as the data source. Make sure the Always keep table dynamically synchronized with data frame check box is checked which will allow the table to update dynamically with changes in the data frame extent. Click Next.
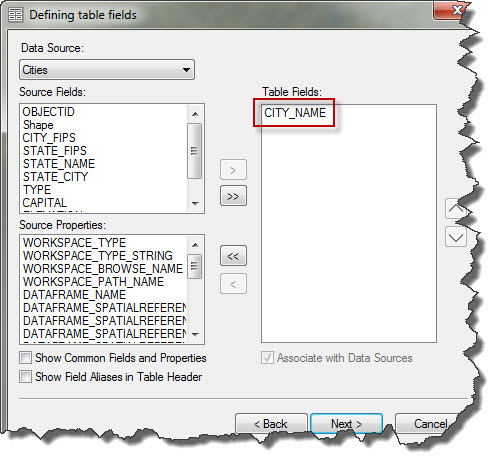
- In the Defining table fields dialog box, choose the CITY_NAME field as the table’s source field and click the arrow to add it as a table field. Click Next.
- Choose the Cities layer as the data source and click the Filter button on the Defining filters dialog box. Here you can define a filter to display just the capital city for the current state in the table.
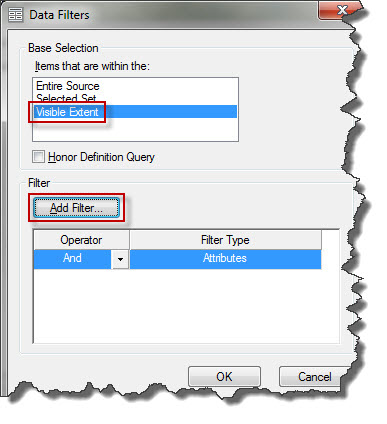
- In the Data Filters dialog box, choose Visible Extent. Click the Add Filter button and choose Attributes Filter. Build the following query; “CAPITAL” = ‘Y’. Click OK twice and then Finish.
 Now that the underlying data properties are set, you can start to make cosmetic changes to the table’s appearance to fit your organizations specifications.
 - Right-click the table in your map layout and choose Properties. In the Table Properties dialog box choose the Table Format tab and click the Table Design button.
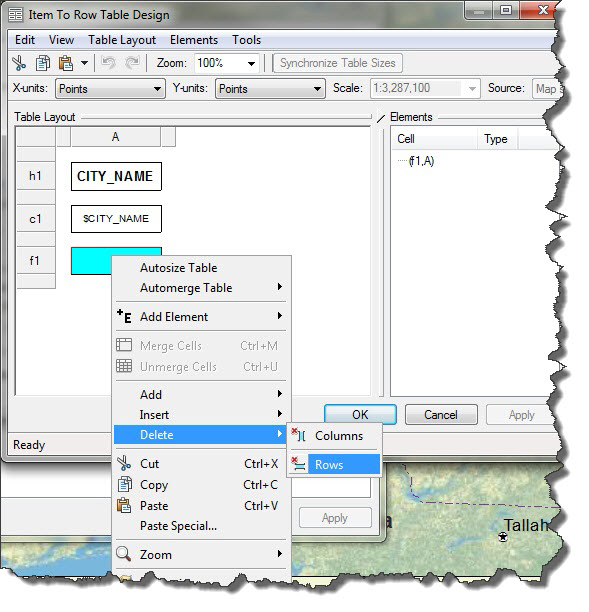
- In the Item to Row Table Design dialog box, delete the f1 (footer) row by right-clicking the cell and choosing Delete > Rows.
- To change the table title, click the cell containing CITY_NAME. In the Elements window, click the plus sign (+) next to (h1,A). Double-click on TextElement to access its properties. Replace the existing text with City Name and click OK.

- Finally, let us assign a color to the header cell. In the Table Layout window, right-click the header cell and choose Properties. Choose the Background tab and click the Symbol button.
- Click the Fill Color drop-down arrow and choose a color.
- Click OK four times to apply the table updates.
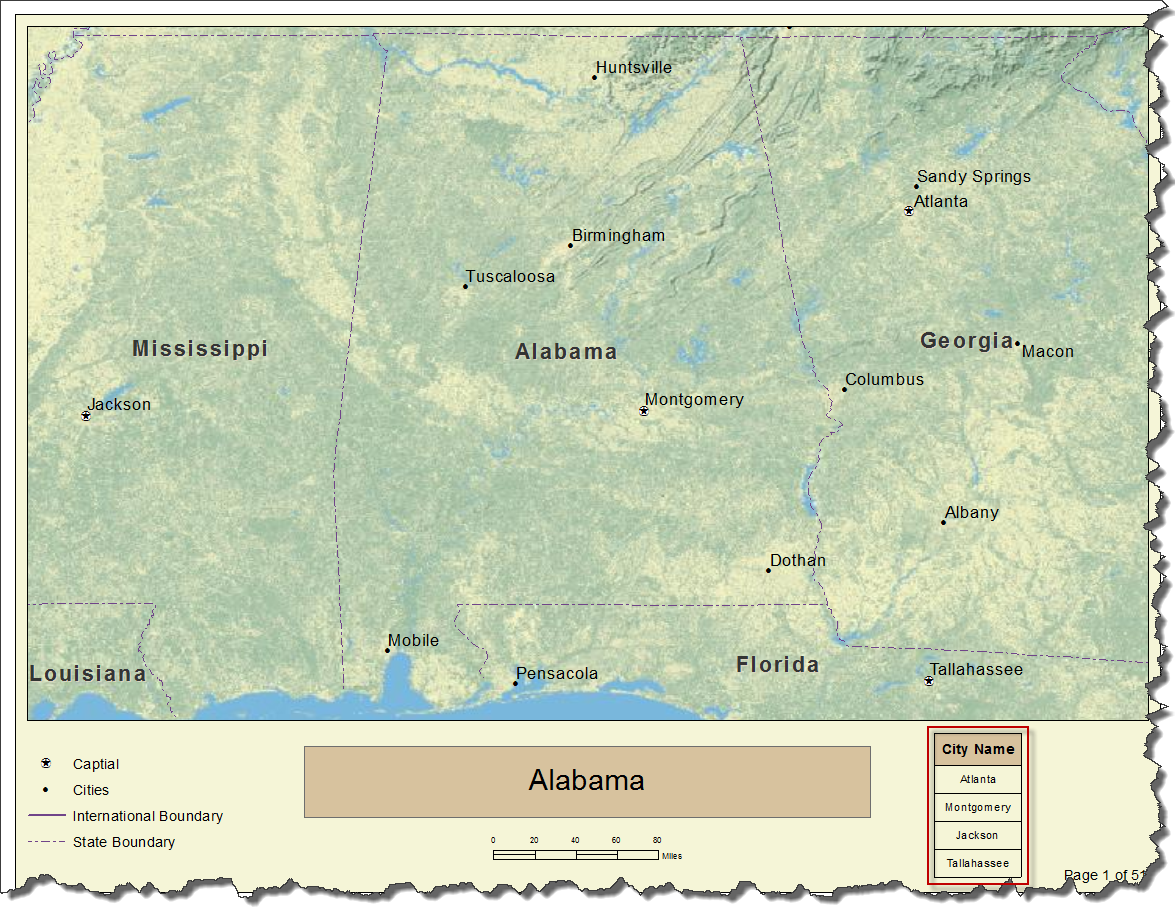
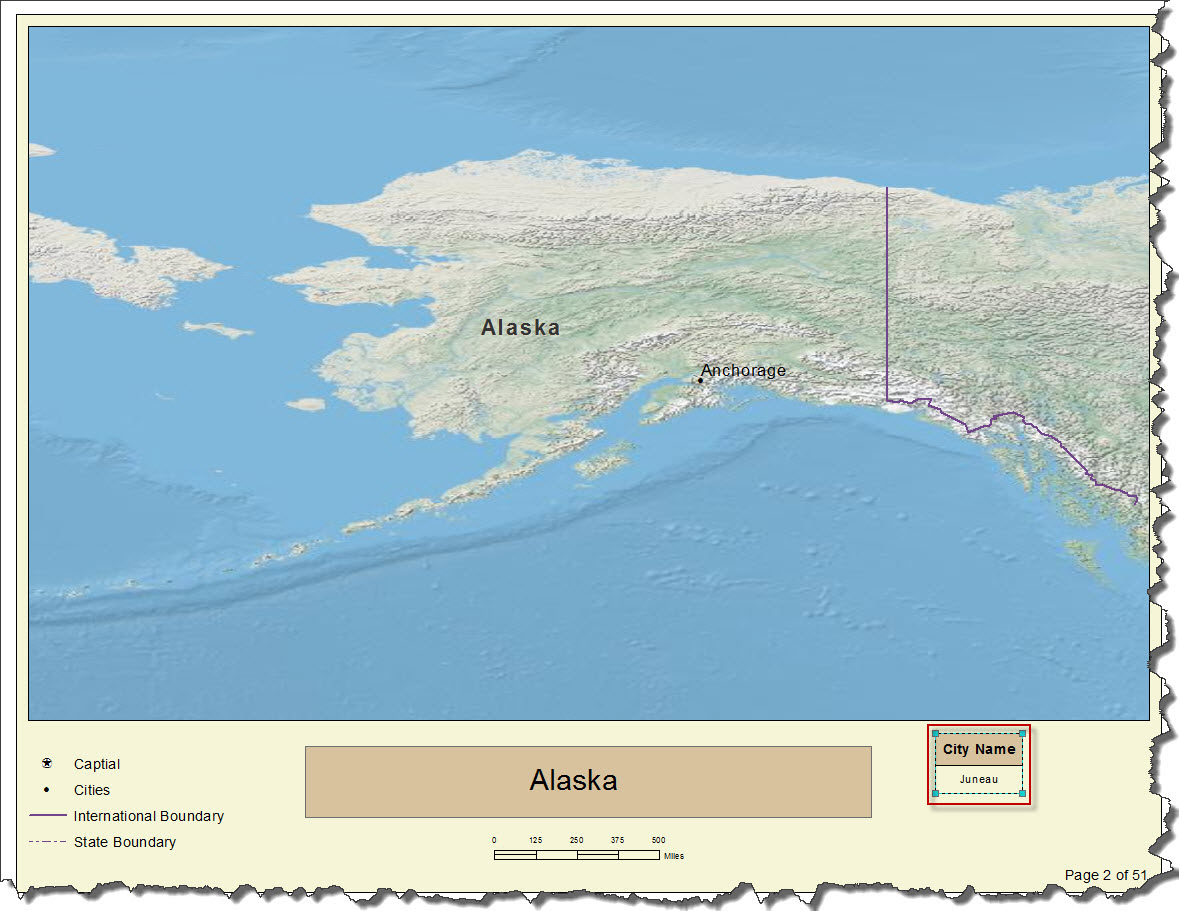
Now as you navigate through your different map book pages the table will update automatically to display capital cities within the current visible extent.
The use case above highlights a very simple example of how you can add dynamic tables to your map layout using the graphic table element. Other examples include dynamic legends, glossaries, and tables that are more complex in design. The possibilities for customization of your tables are almost endless!
Content contributed by Clint Loveman
Commenting is not enabled for this article.