The air we breathe matters to our health – not just in ferrying fresh oxygen to our lungs, but in shaping our health over the course of our lives.
Because each of us takes tens of thousands of breaths per day, the quality of our local air is paramount. Humans who live in locations with persistently bad air quality tend to have higher rates of respiratory and cardiovascular diseases.
An article published this month in Cardiovascular Research estimated air pollution is responsible for 8.8 million premature deaths per year.
That raises the stakes for governments around the world to monitor, analyze, and share air quality data with the public.
Technologies including GIS are helping the United States Environmental Protection Agency accomplish this more efficiently and accurately – and in turn, the data and context that the E.P.A. provides can empower geospatial developers to build their own solutions.
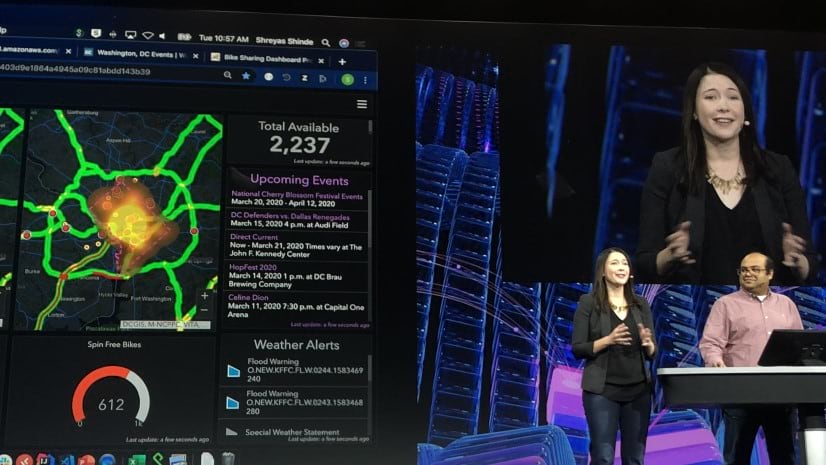
During the plenary session of Developer Summit 2020, Esri developers Bill Major and Indhu Kamala Kumar used new tools in ArcGIS Enterprise that could help automate the data collection and update processes for an air quality dashboard using the E.P.A.’s public API.
This new system included automated notifications, instant collaboration, and hourly data updates.
The E.P.A. aggregates data from the network of monitoring stations deployed across the U.S. and presents it to the public on its AirNow site. For two decades, agencies, scientists, and members of the public have relied on AirNow for air quality updates.
“The goal is to help people plan and take ownership of their exposure to air pollution,” says E.P.A. scientist Liz Naess. “While they can’t directly control the level of pollution outside their house, they can control how much pollution they are exposed to in the area.”
In addition to their AirNow site, the E.P.A. also makes air quality data publicly available on a real-time and historical basis in a variety of formats.
This allows developers to incorporate this air quality data into their own work, whether on its own or synthesized with other data sources.
At the Developer Summit plenary, Bill and Indhu took this data stream and built a complete web app solution from it. Along the way, they showcased new tools in ArcGIS Enterprise that empower developers to automate their workflows on a recurring basis.
Using ArcGIS Notebooks, a hosted Python notebook solution launched in ArcGIS Enterprise last year, they created a workflow to make use of this data.
Bill and Indhu showed off two complete workflows, from data collection to content creation to dissemination, using ArcGIS Notebooks.
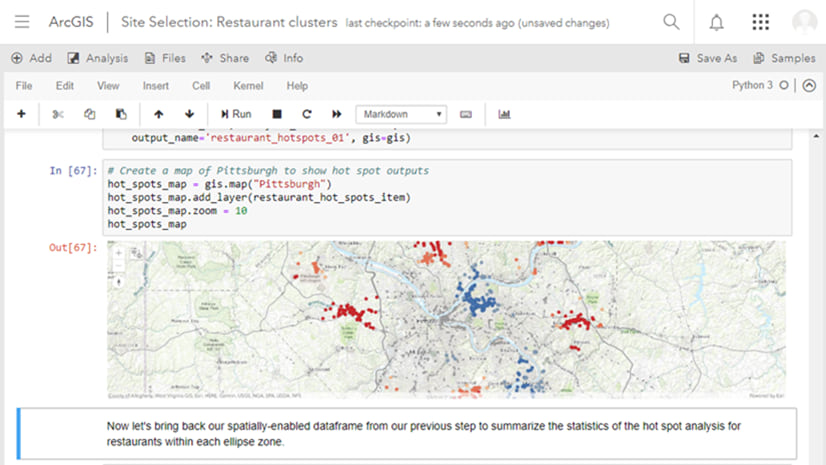
First, Indhu wrote Python code to grab the latest California air quality data. After cleaning the data and formatting it, her notebook loaded the data into a feature layer, which can be viewed on a map directly in the notebook.
Next, she added a separate layer containing polygon areas of protected habitat areas. To assess the impact of air quality on these habitats, she generated a PDF report describing air quality in each protected area.
Because the air quality data is updated every hour, it would be tiring and unfeasible to run the notebook manually each time. That’s where a new notebook scheduling feature comes in.
Starting in ArcGIS Enterprise 10.8, released in February, ArcGIS Notebook Server administrators can use the Automate Notebook operation to run a notebook programmatically.
While this feature is currently limited to the ArcGIS Notebook Server Administrator Directory, Indhu previewed an upcoming feature in the notebook editor itself that allows authors to set a schedule for this automated notebook execution.
In their demo, Indhu specified certain parameters to be added to the notebook during each automated run. Then she scheduled it to run every hour, concurrent with the hourly data updates.
That’s it – once the schedule was set, Indhu didn’t have to keep manually running the notebook.
Bill then showed his notebook, which uses national data to check for potentially alarming outliers in air quality data and then automatically notifies the relevant agent.
His notebook started by checking whether any new datasets had arrived. If any had, he next validated them using the ArcGIS API for Python.
He then performed an outlier detection check on the air quality data. Any existing outliers were visualized on a map in the notebook.
Outliers in air quality data are not always proof of elevated pollution levels – sometimes they are just instrumentation errors.
To allow his scientists to check these outliers, Bill set up an automated notification system. First, he wrote code to generate a PDF report of each outlier incident and added the report as an item in his ArcGIS Enterprise portal, in a group intended for data collaboration.
The group was set up to share each item to ArcGIS Online using distributed collaboration, which creates a secure sharing pipeline between Web GIS systems. Using this, Bill could share the outlier reports with scientists even if they didn’t have access to his ArcGIS Enterprise deployment.
Then, he used a webhook – a new feature added in ArcGIS Enterprise 10.7 – to record each time a new outlier report was added to that group.
Bill connected this webhook using Microsoft Power Automate to a chain that emails his air quality scientists each time a new report is added to the group. The scientists can review each report as it comes in and determine whether action should be taken.

These tools – notebook scheduling, webhooks, and distributed collaboration – advance the abilities of ArcGIS Enterprise users to automate complex, lengthy tasks.
“We like to call it ‘intelligent automation,’” Bill says. “What achieves intelligent automation is automating end-to-end workflows with tools like these.”
Of course, it all started with the data. Bill and Indhu used public AirNow and state air quality data, openly available on the web. Anyone can use this data to create their own tools and content.
For the E.P.A. team, that’s all part of the mission to serve public health.
“We have the technology; we have the capabilities to provide information about the air quality in your area,” Naess says. “This gives us the ability to share that.”

Hi Scott, Where can I find Indhu’s Jupyter Notebook?