With ArcGIS for Excel, you can calculate distances and draw routes between coordinates in your Excel worksheet and features in an ArcGIS layer on ArcGIS Online or Enterprise, all without leaving your worksheet. In this article, you‘ll use ArcGIS for Excel functions to calculate both driving distances for logistics planning and straight-line distances for proximity analysis.
In this article, you’ll see two methods for calculating distances and visualizing those paths to the ArcGIS for Excel map –
- Driving Distance – Real world route distance using Road networks.
- Straight line (Geodesic) distance – Shortest distance between two points.
Method 1: Driving Distance
Use this method to calculate the actual driving distance between locations by leveraging ArcGIS Network Analyst behind the scenes, which uses road network data to determine real-world travel distances and times. It’s ideal for logistics, delivery route planning, and any scenario where there is real world travel distance. The =ARCGIS.FINDROUTE function automatically returns the route geometry.
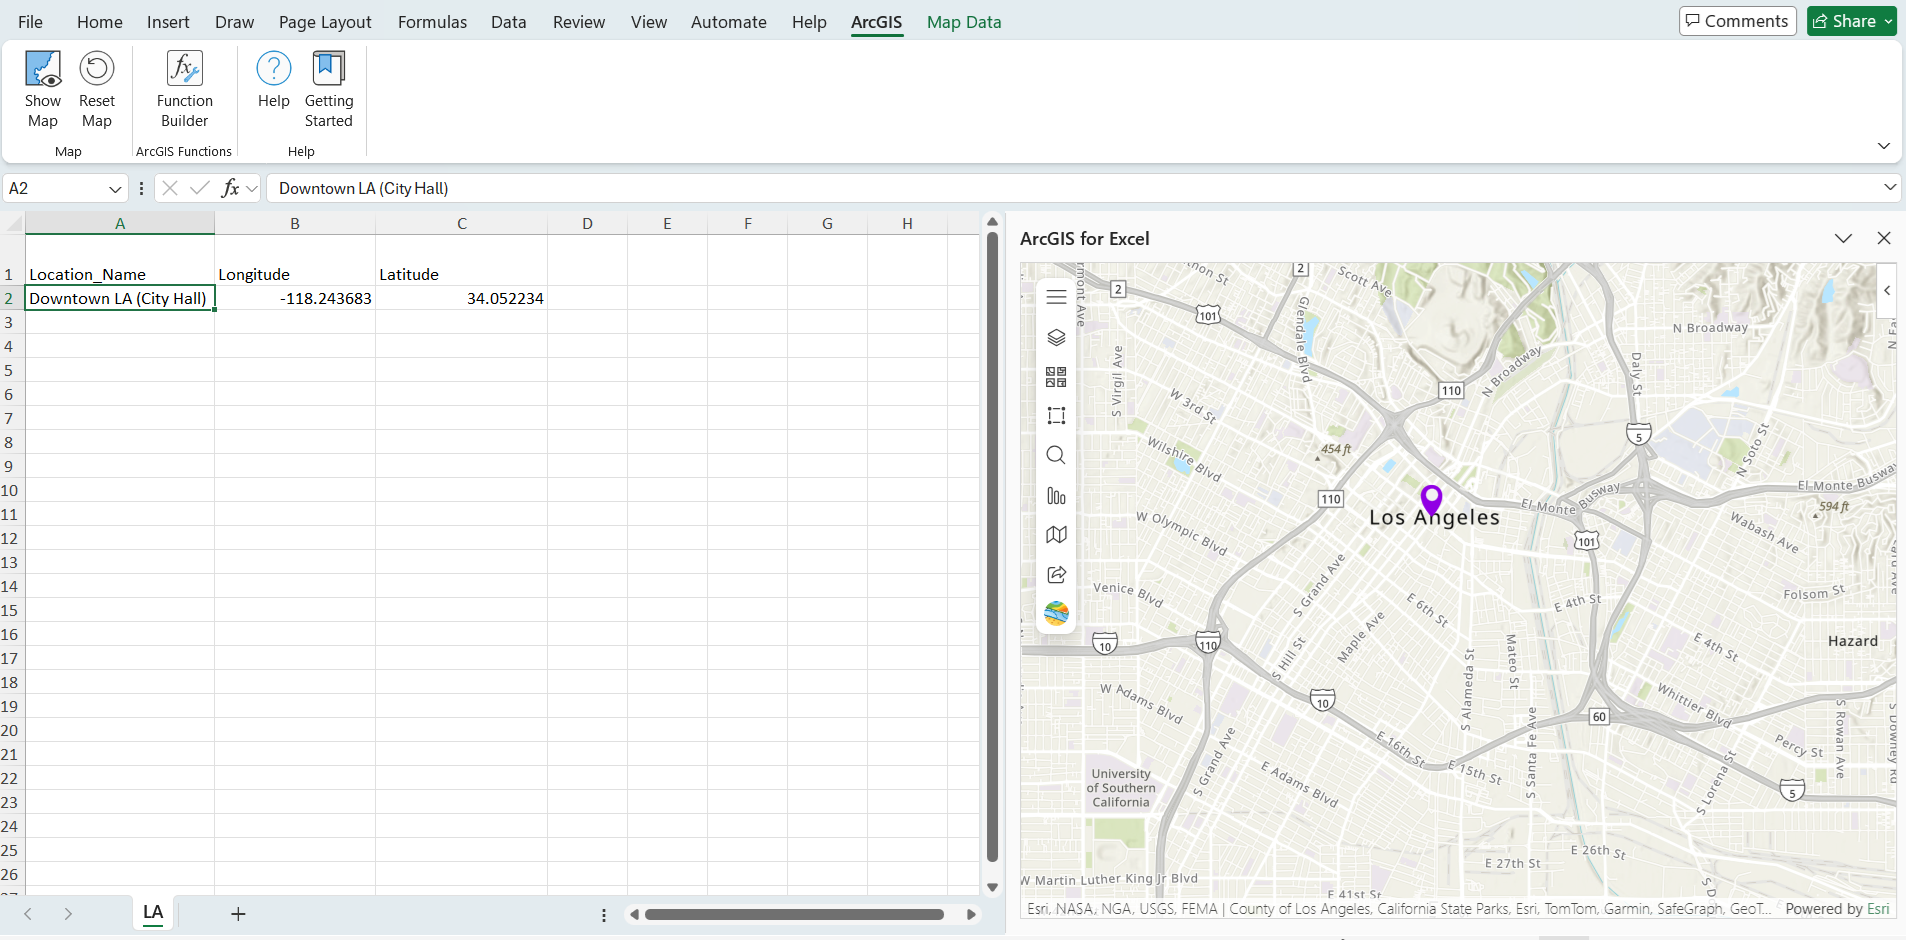
Step 1: Prepare the Data
In the Excel worksheet LA, Downtown LA (City Hall) coordinates are in columns B2 (longitude) and C2 (latitude).
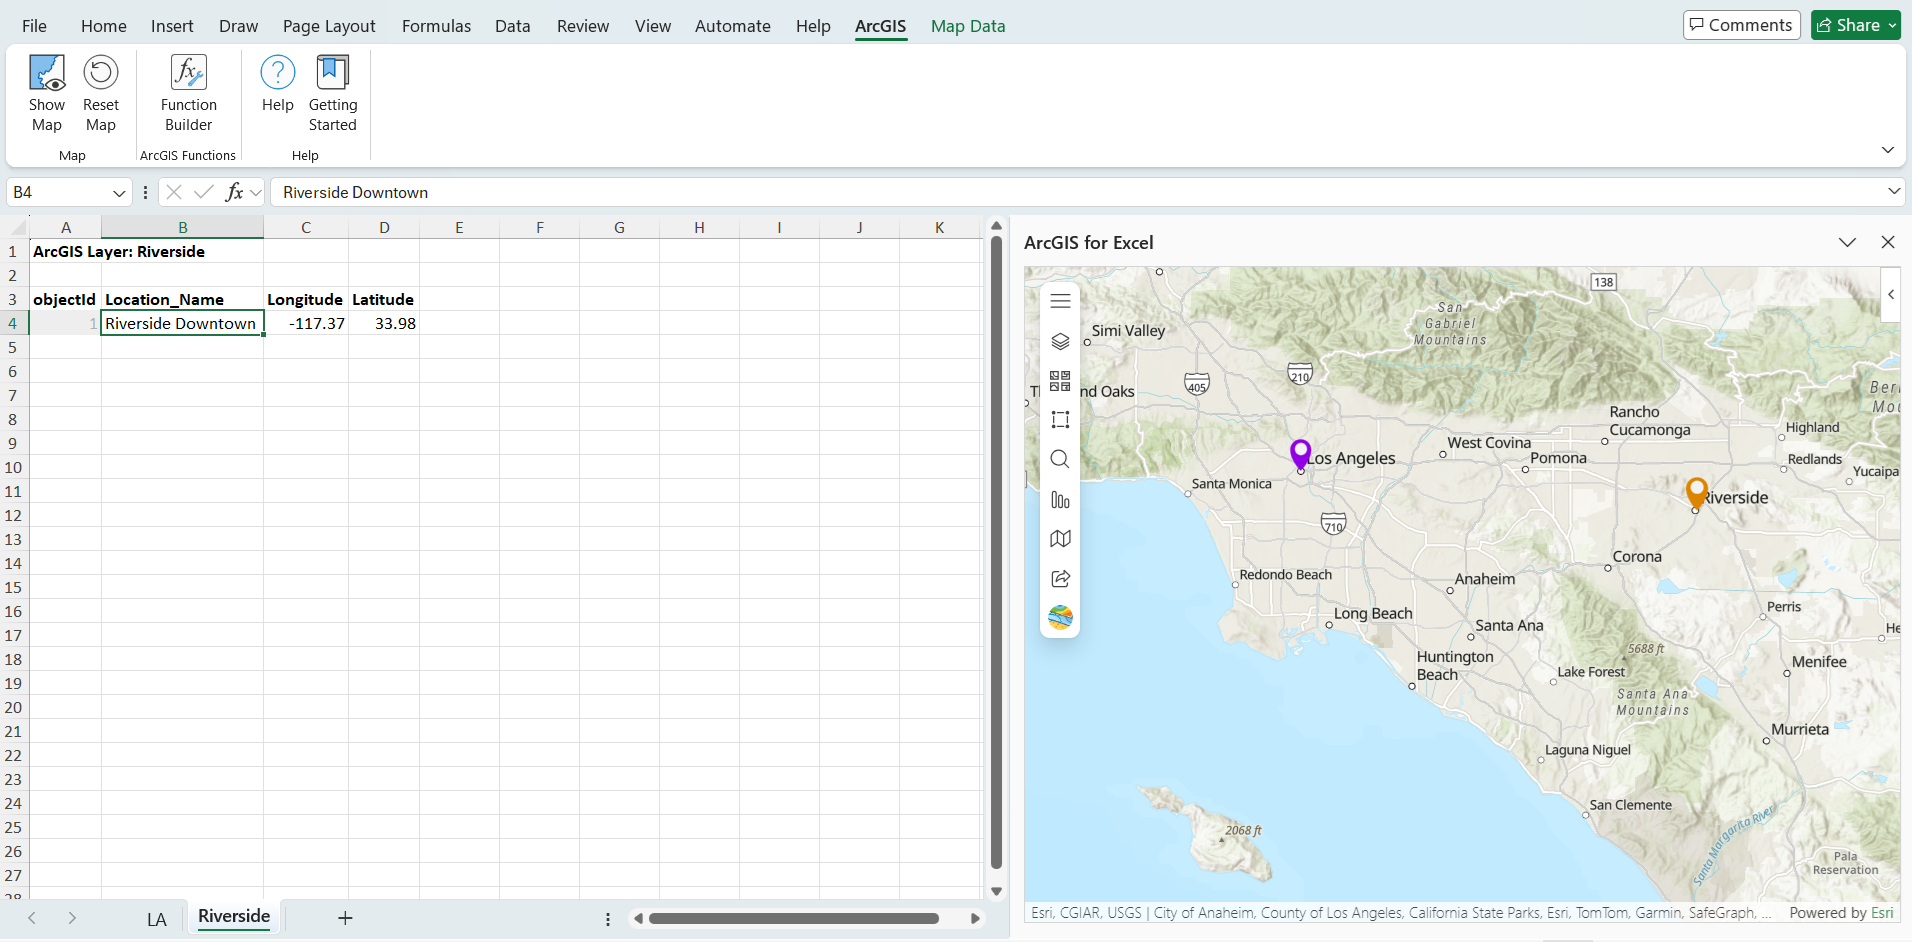
And the Riverside City Downtown coordinates are in the ArcGIS layer, and its attribute data table added to Excel. ArcGIS layer name is Riverside and, and longitude and latitude are in C4 and D4 columns.
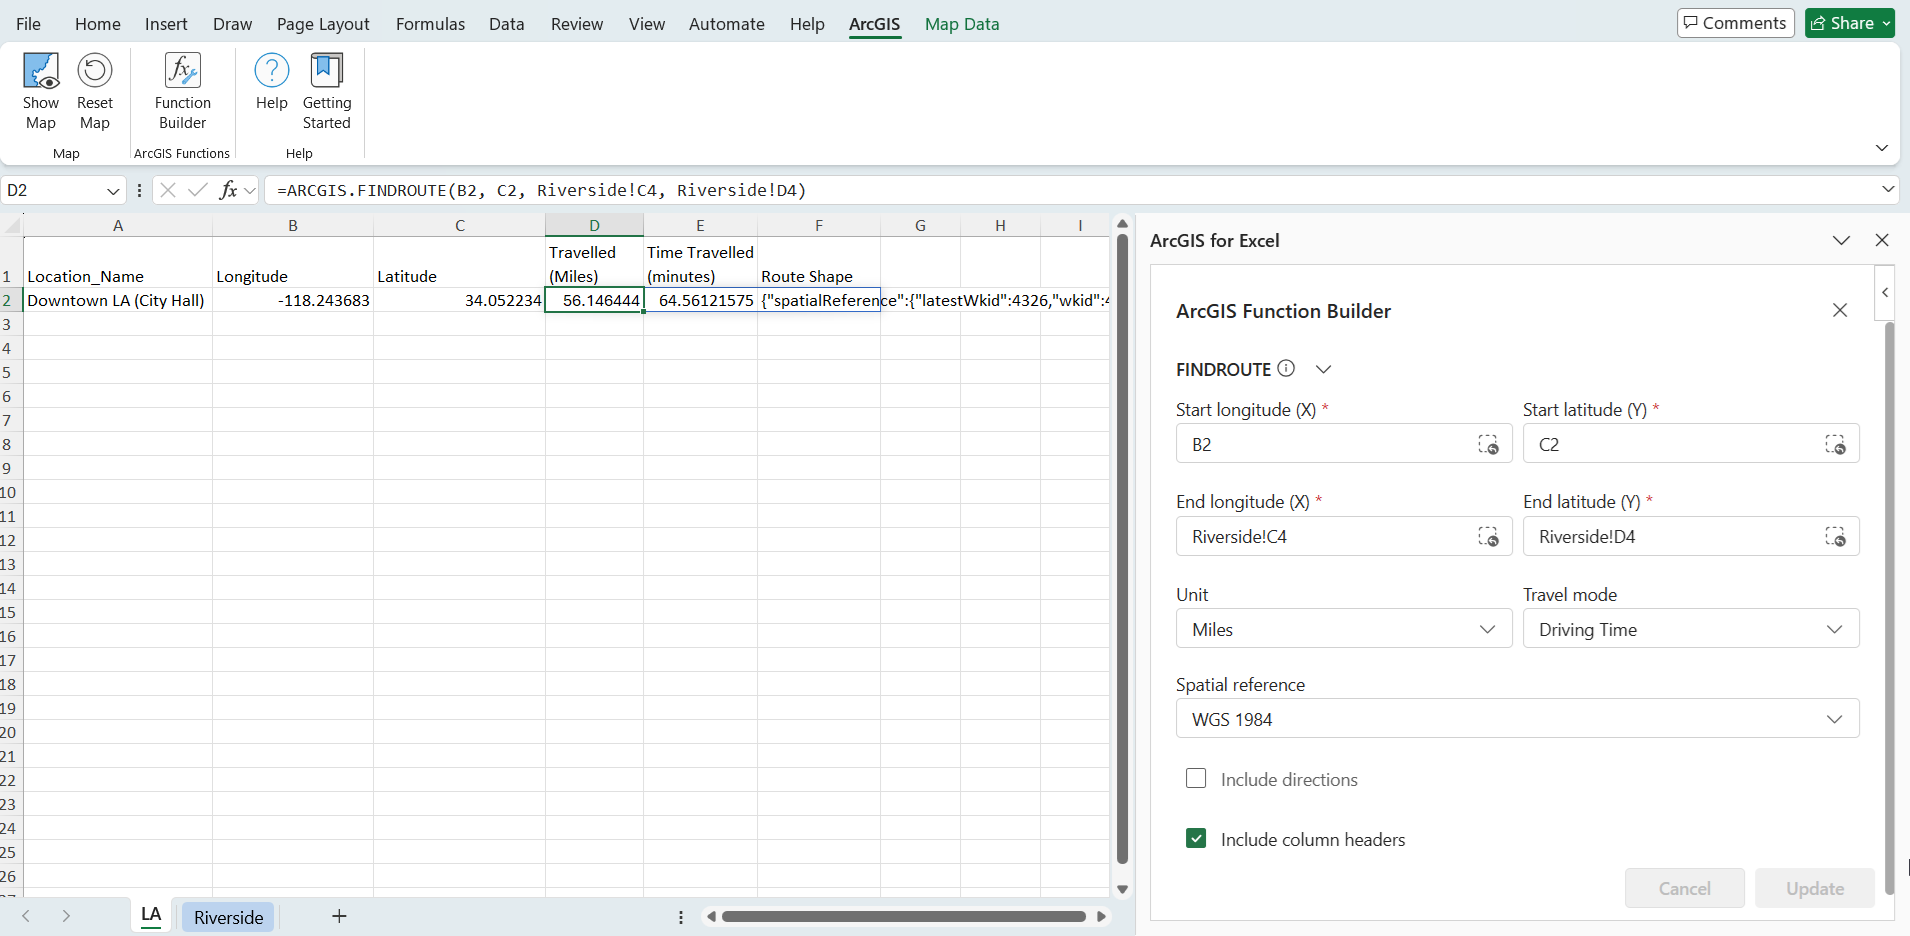
Step 2: Use the FINDROUTE Function
Use the ARCGIS.FINDROUTE function to calculate driving distance between locations:
=ARCGIS.FINDROUTE(from_longitude(X), from_latitude(Y), to_longitude(X), to_latitude(Y), [options])
To configure the function:
- For the location, select the Longitude and Latitude columns from your Excel data
- Select the Longitude and Latitude columns from your ArcGIS layer
- Change Travel mode to Driving Distance
B2 and C2 coordinates from the Excel LA worksheet and the Riverside Downtown coordinates from the ArcGIS layer sheet:
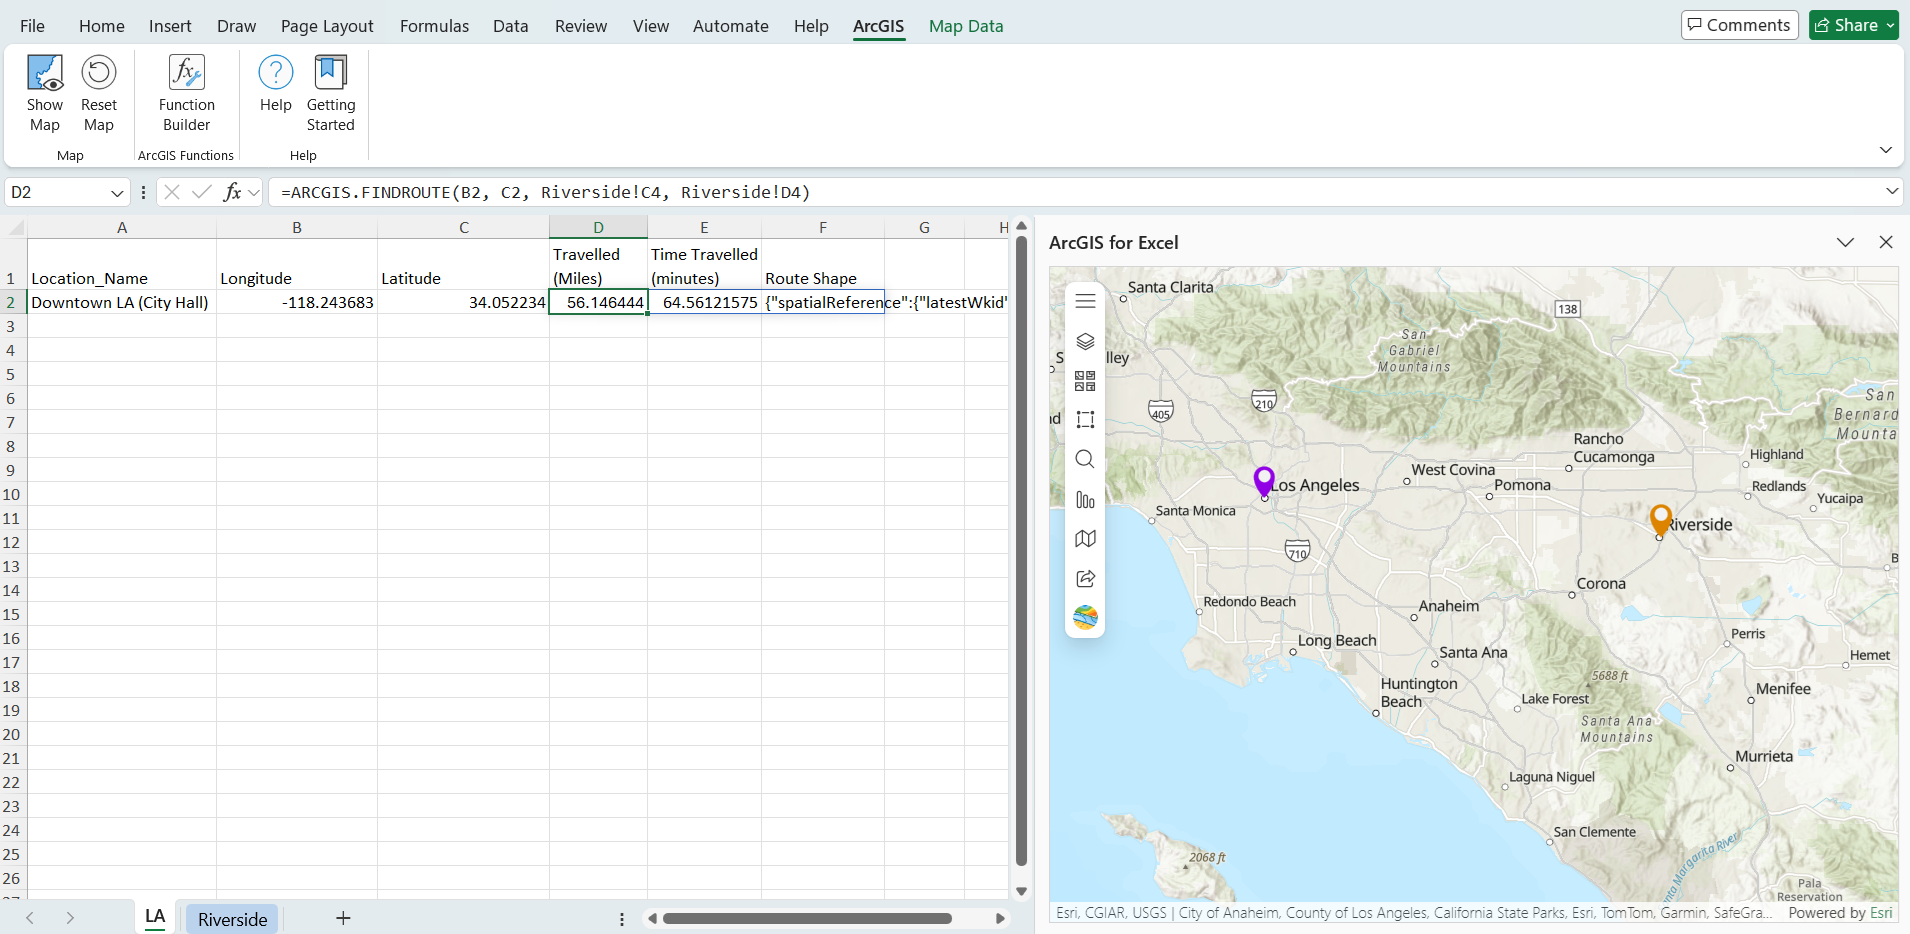
Your formula looks like: =ARCGIS.FINDROUTE(B2, C2, Riverside!C4, Riverside!D4)
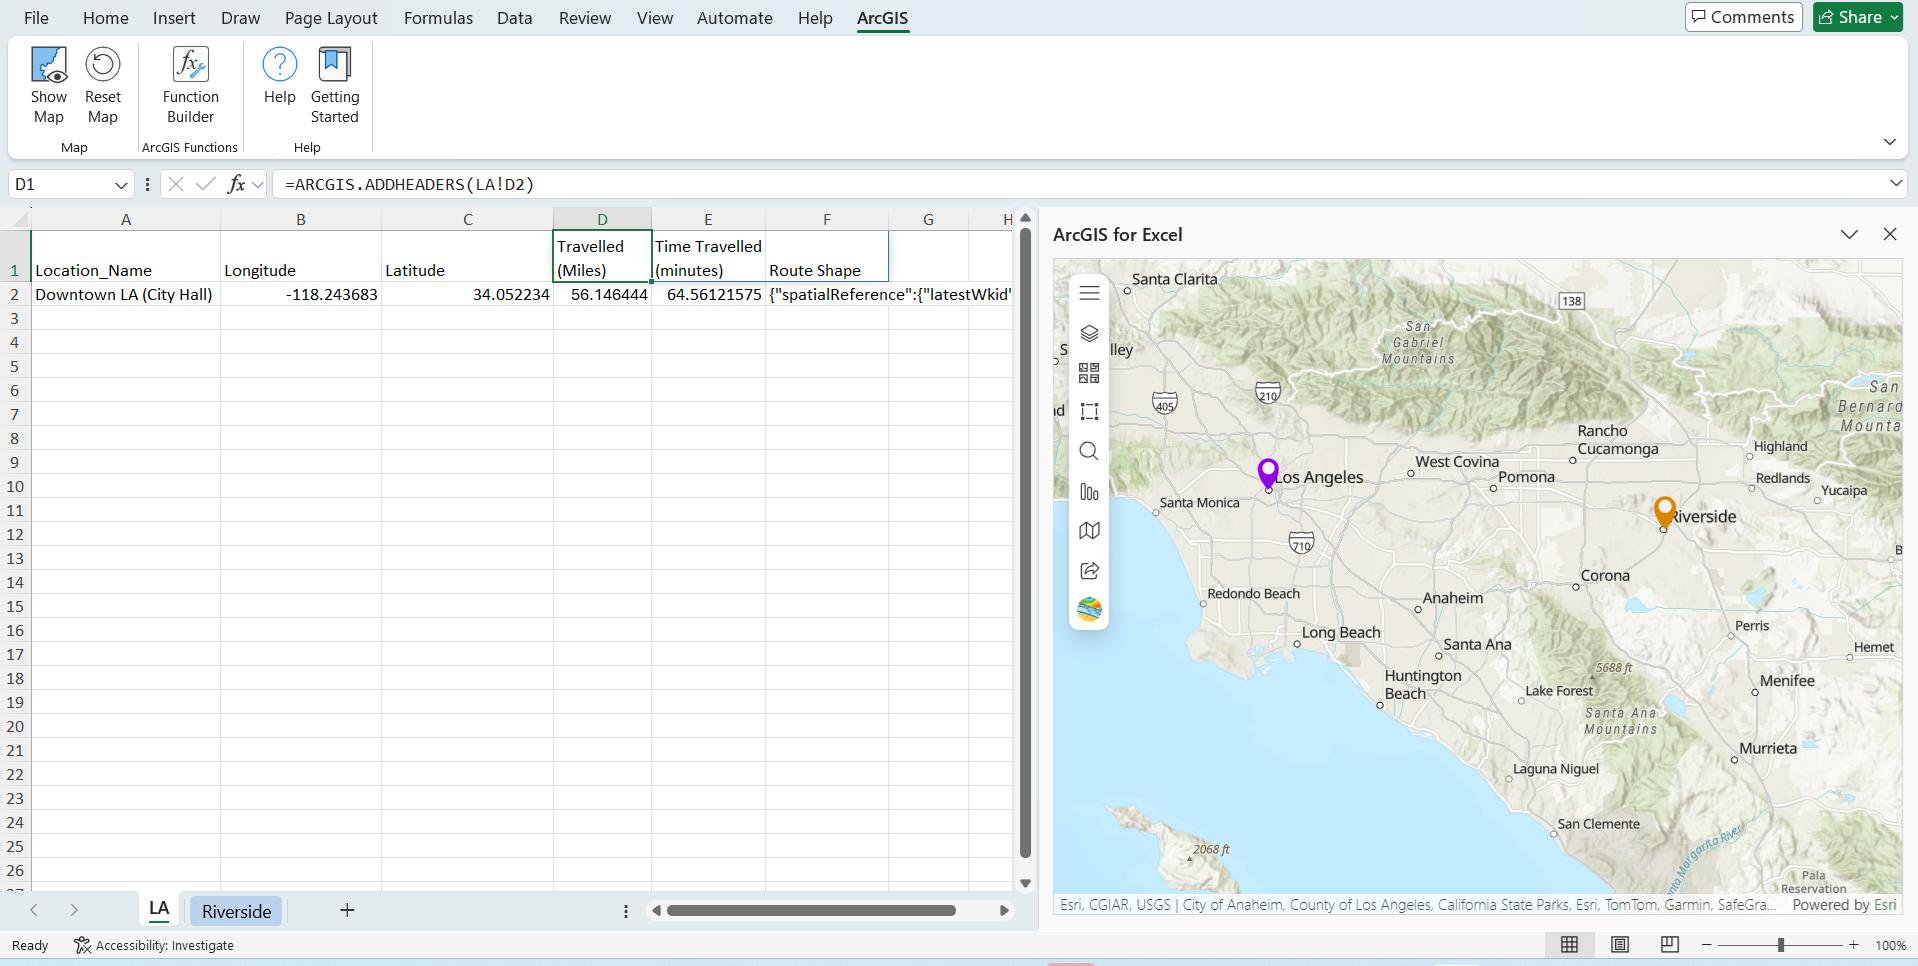
Applying the headers formula: =ARCGIS.ADDHEADERS(LA!D2)
The FINDROUTE function returns three columns of data: Distance, time, and Route Shape. In Route Shape column contains data in the EsriJSON format. Running the formula in the LA Excel worksheet.
Note – Function Builder can also be used to create ArcGIS for Excel Functions. ArcGIS for Excel Function Builder – https://doc.arcgis.com/en/excel/latest/workflows/build-functions.htm.
And the =ARCGIS.FINDROUTEBYADDRESS function calculates driving distance between addresses if you’re interested in using addresses instead of coordinates.
Step 3: Map the Route
The Geometries from the Route shape column can be used to render EsriJSON data to ArcGIS for Excel map to visualize routes on the map.
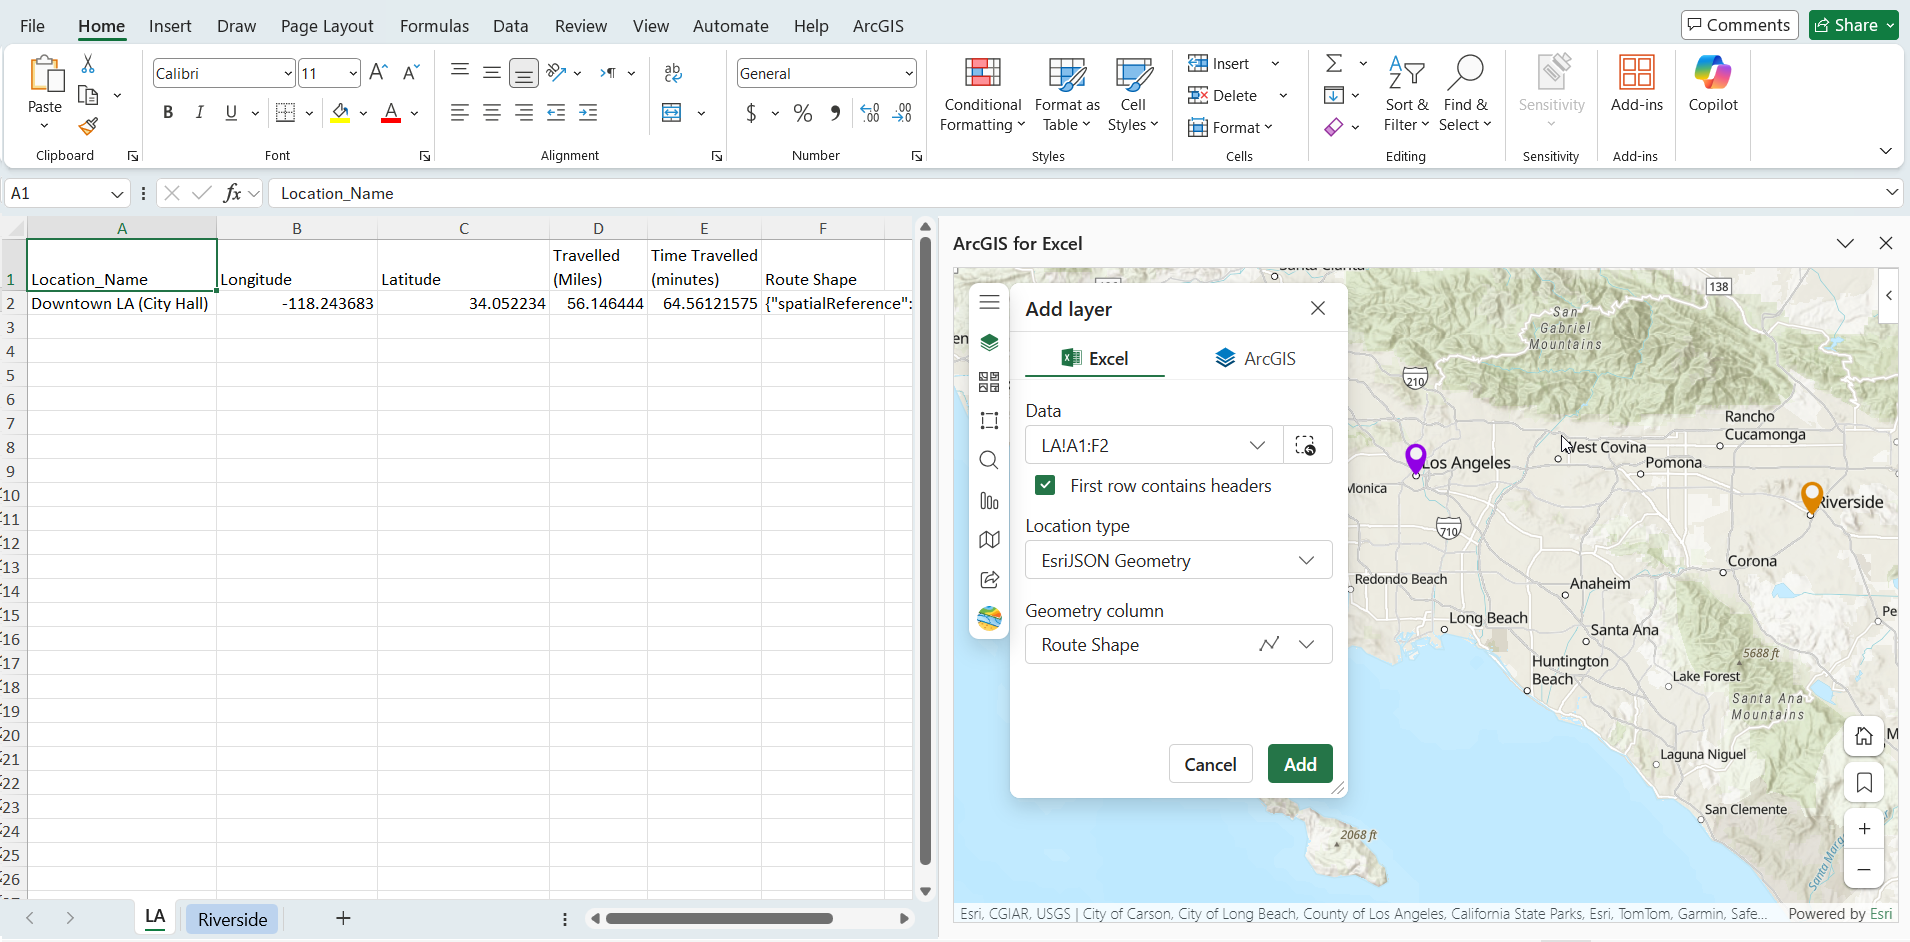
To add the Driving distance Route to the map:
- In the ArcGIS for Excel map, Click Add > Excel
- Select EsriJSON location type
- click Add
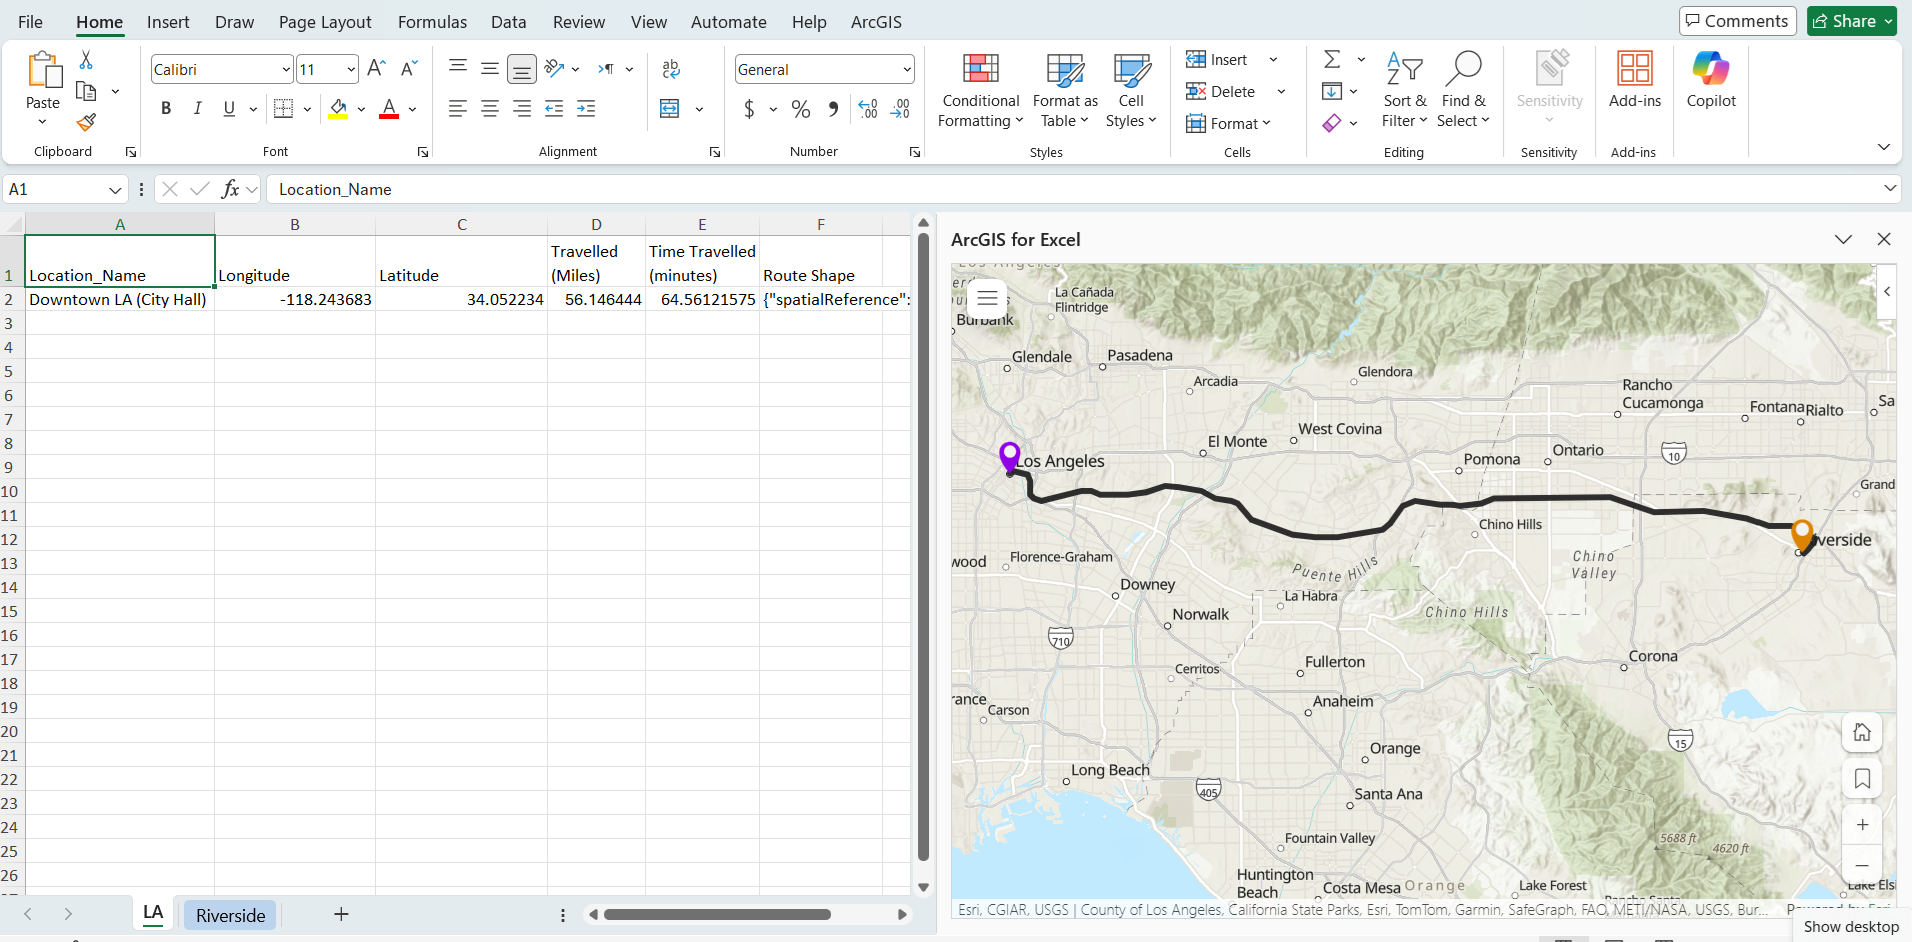
This displays the actual road paths between your locations, showing the driving route between Downtown LA and Downtown Riverside along with distance and time details.
Method 2: Straight line between two points
Use this method to calculate the shortest distance between two points on the Earth’s surface. It’s useful for spatial analysis and proximity calculations.
Step 1: Prepare the Data
In the Excel worksheet LA, Downtown LA (City Hall) coordinates are in columns B2 (longitude) and C2 (latitude).
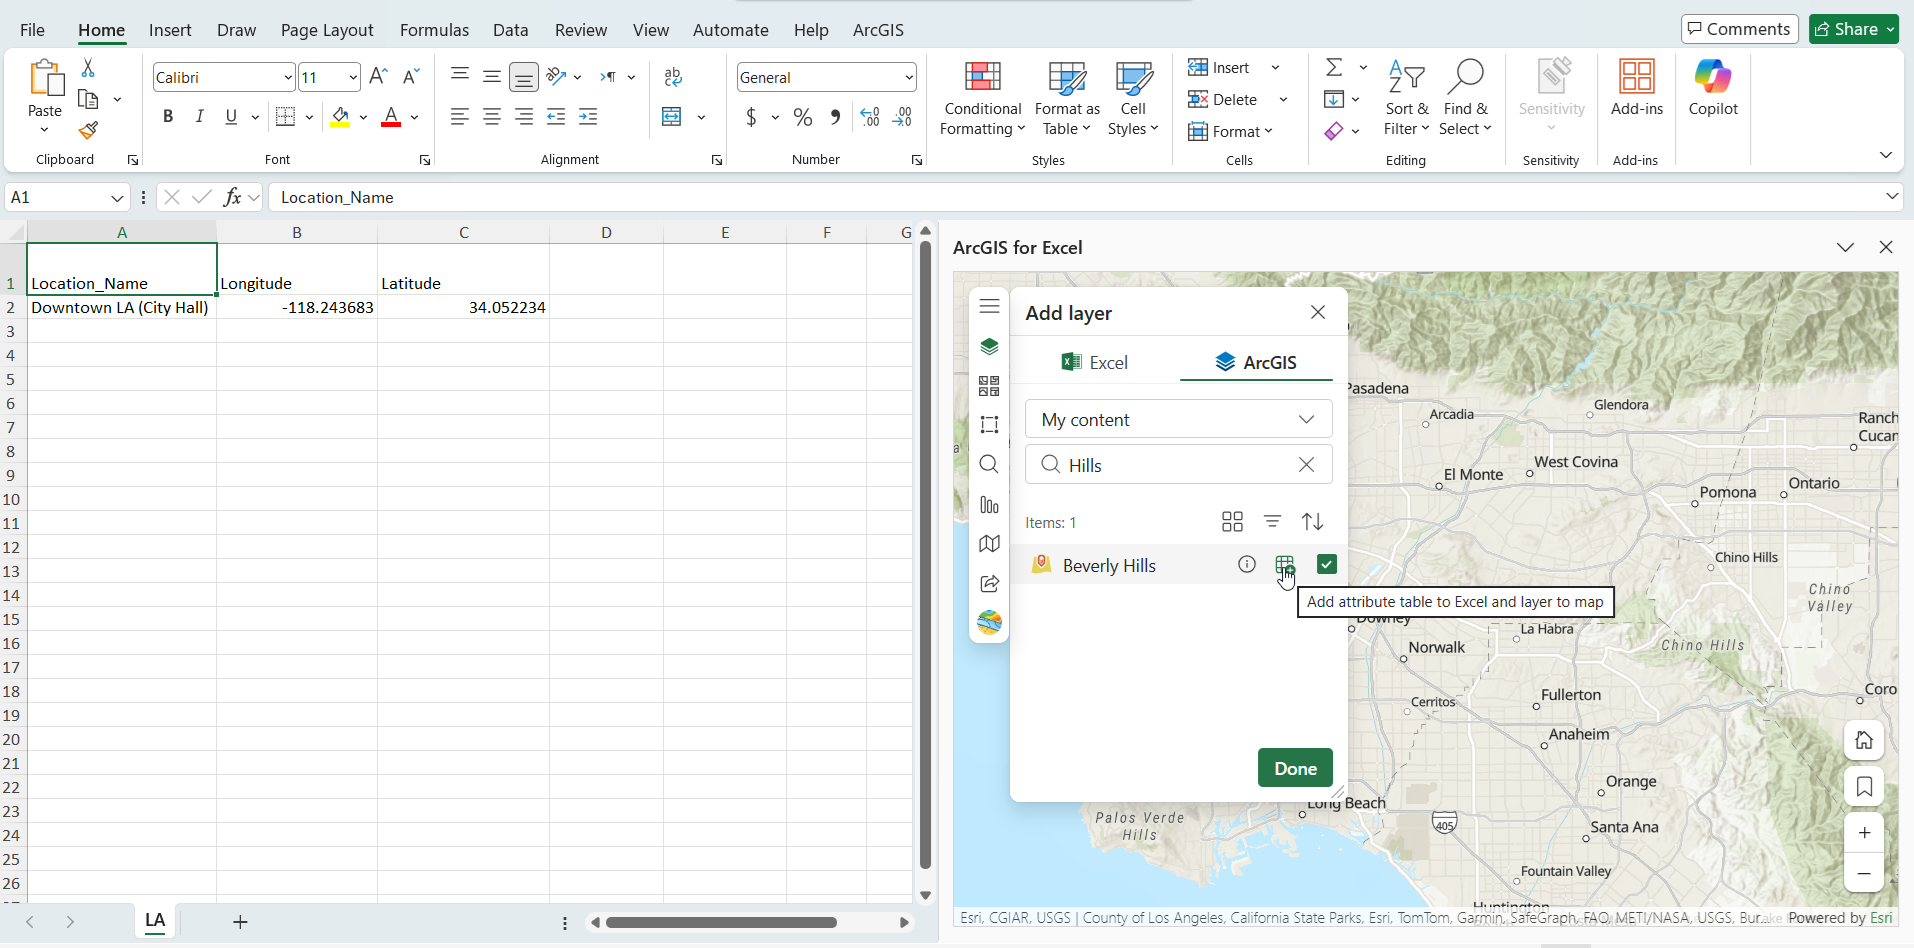
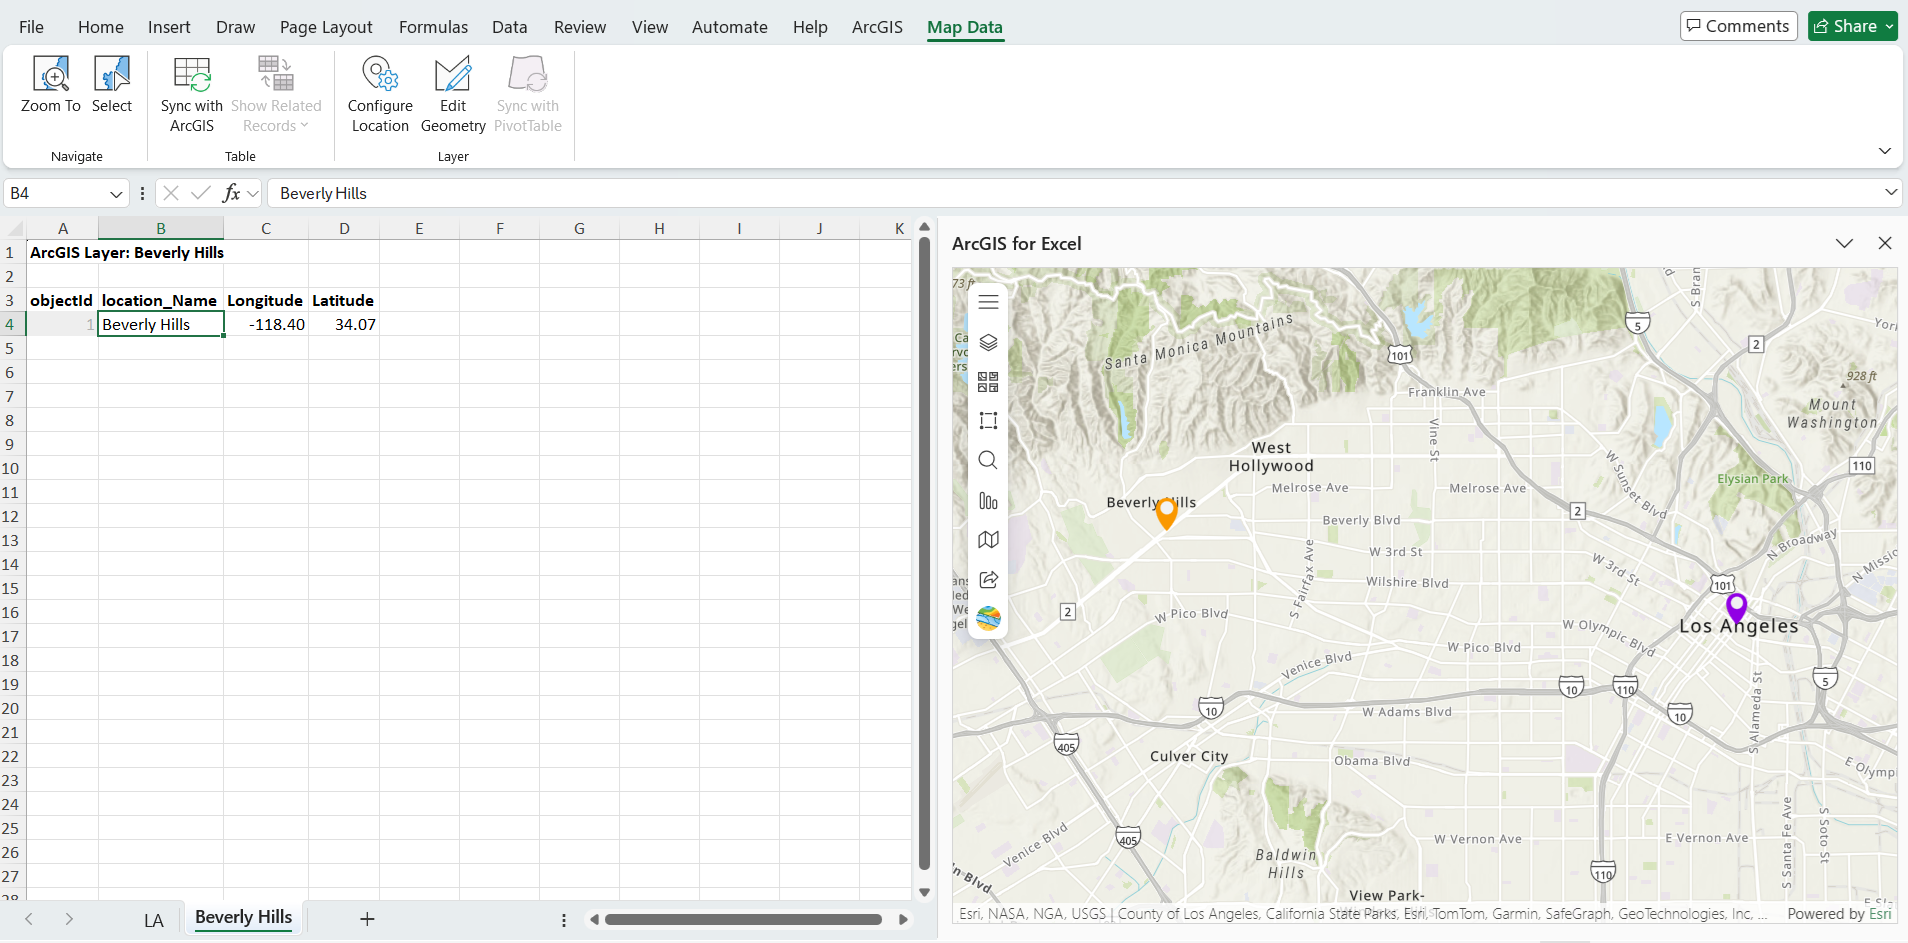
And the Beverly Hills coordinates are in the ArcGIS layer, and its attribute table was added to Excel. ArcGIS layer name is Beverly Hills and longitude and latitude are in C4 and D4 columns.
Step 2: Add WKT Geometry Column to Your Excel Data
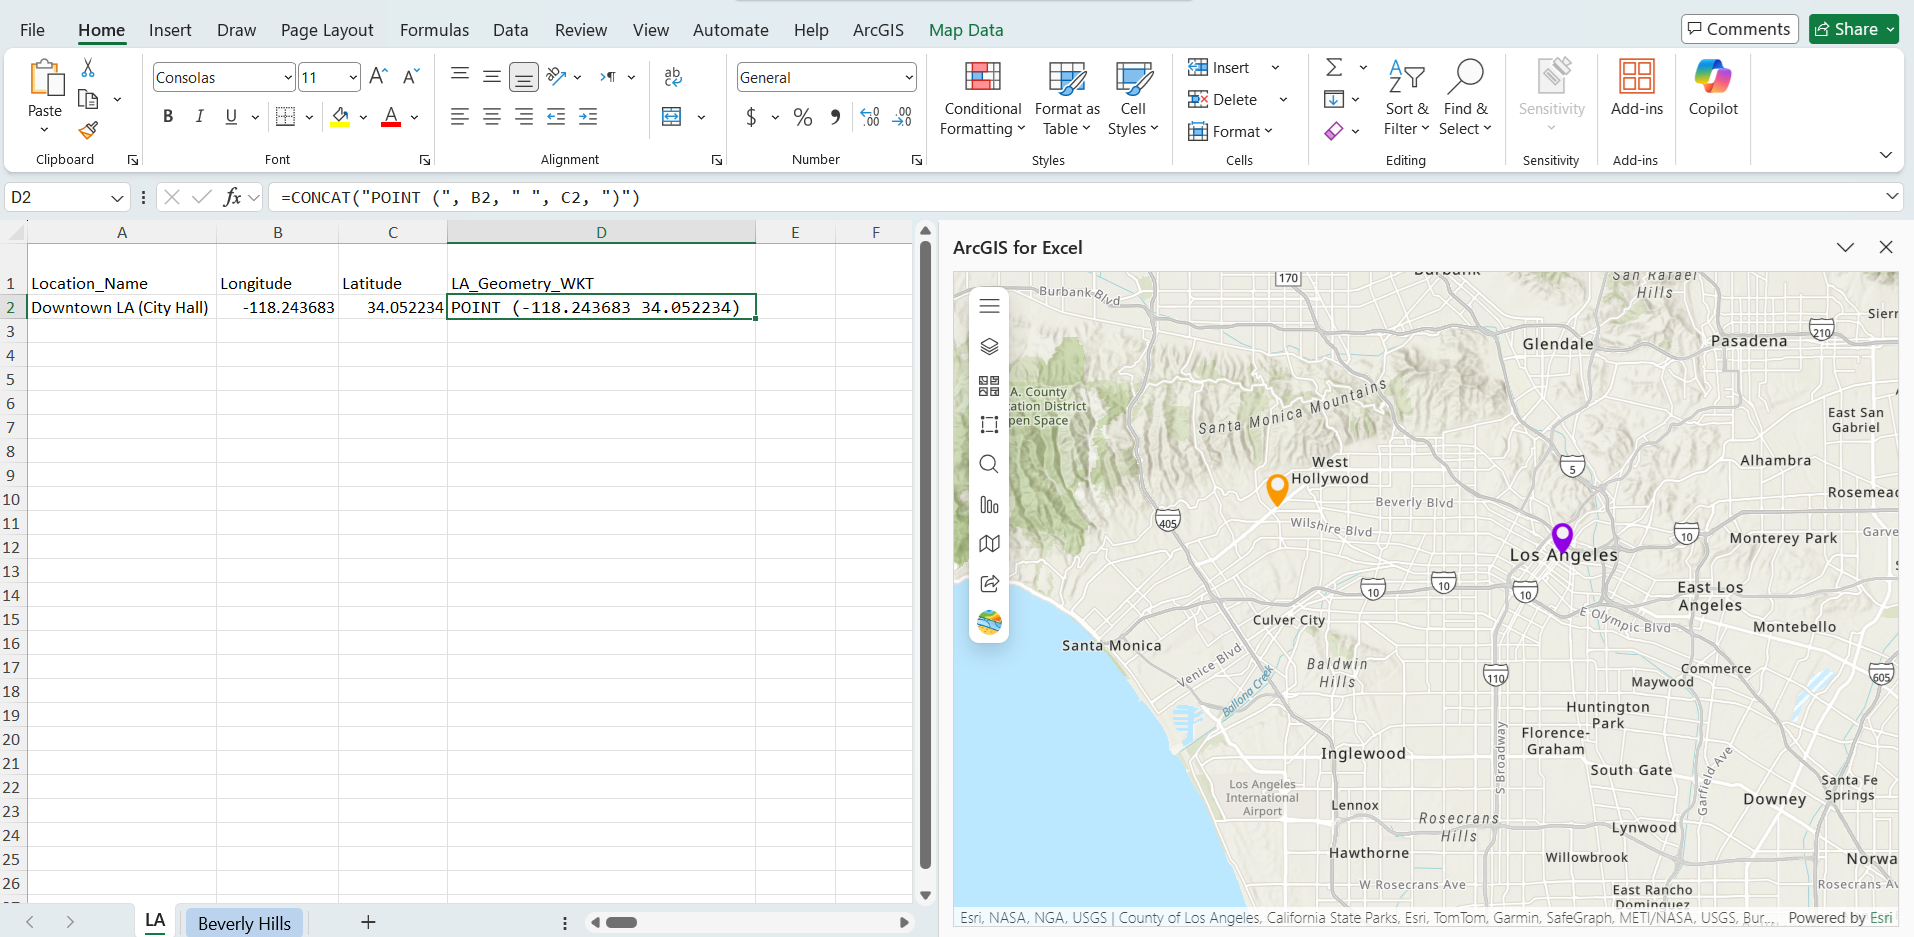
Convert the Downtown LA coordinates from the LA worksheet into Well-Known Text (WKT) geometry format. In a new column, use the CONCAT function to create WKT points. Longitude values are in the B column, and Latitude values are in the C column.
=CONCAT("POINT (", B2, " ", C2, ")")
This will return values like: POINT (-118.408075 33.942536)
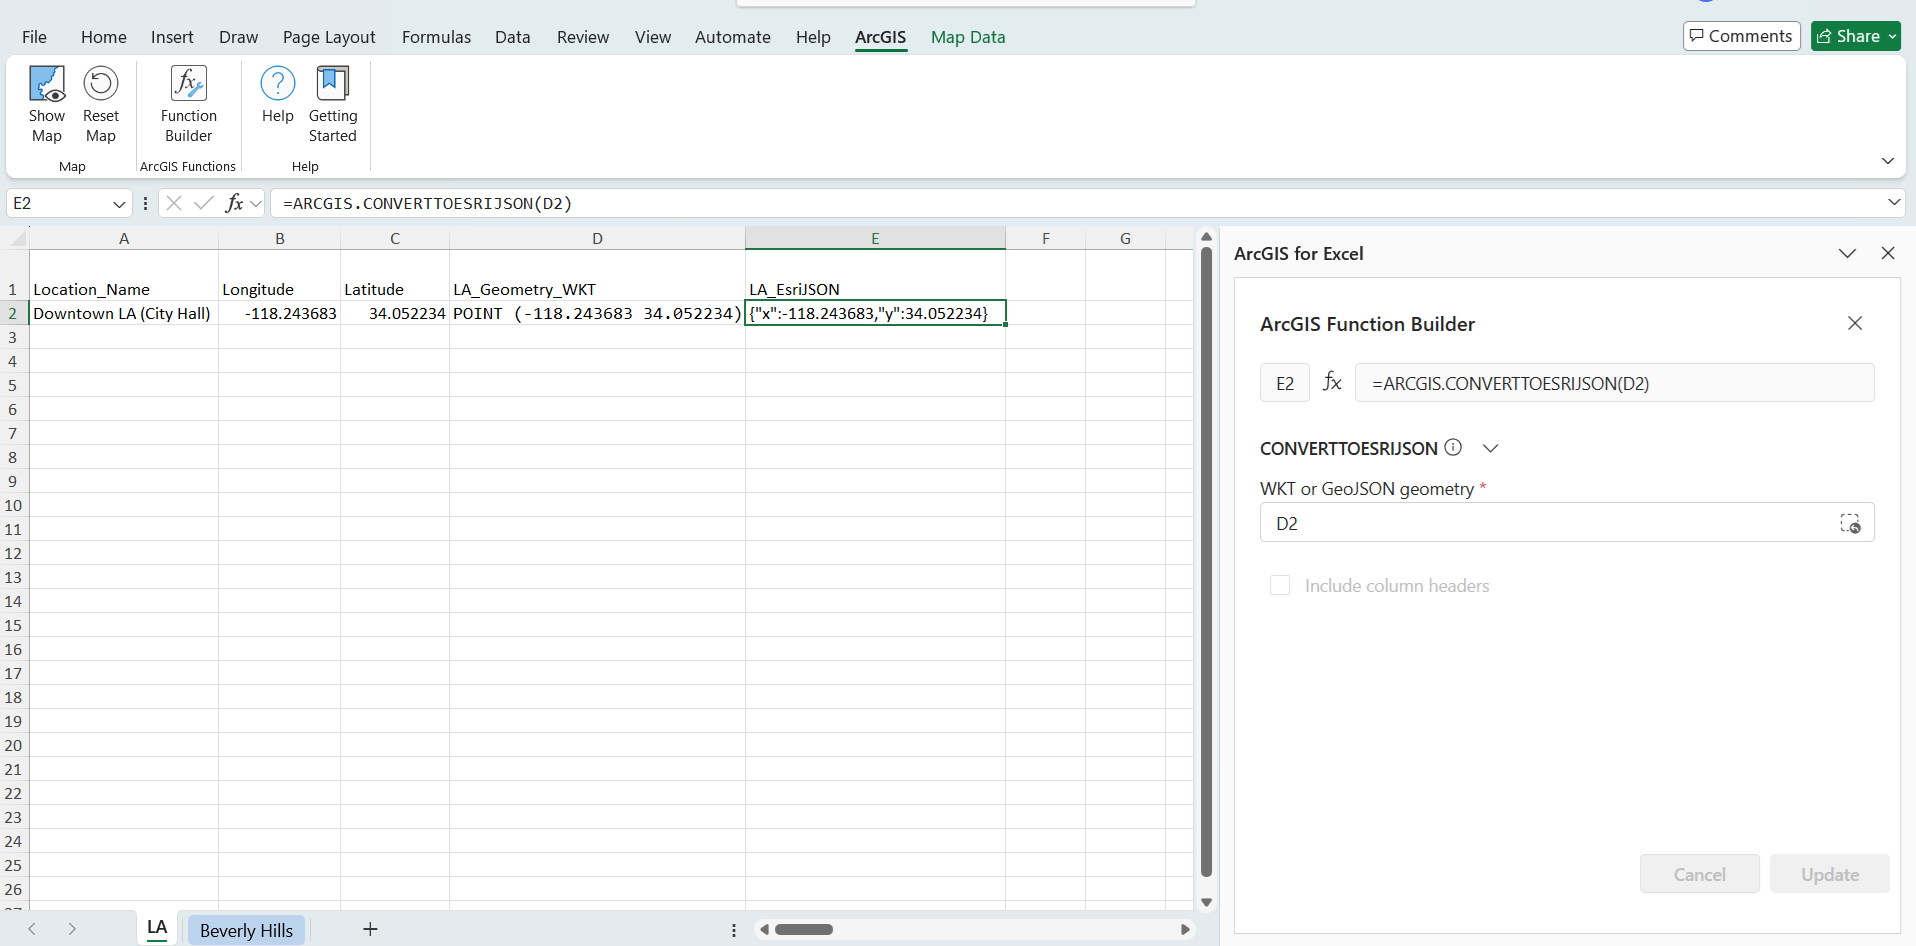
Step 3: Convert WKT to EsriJSON
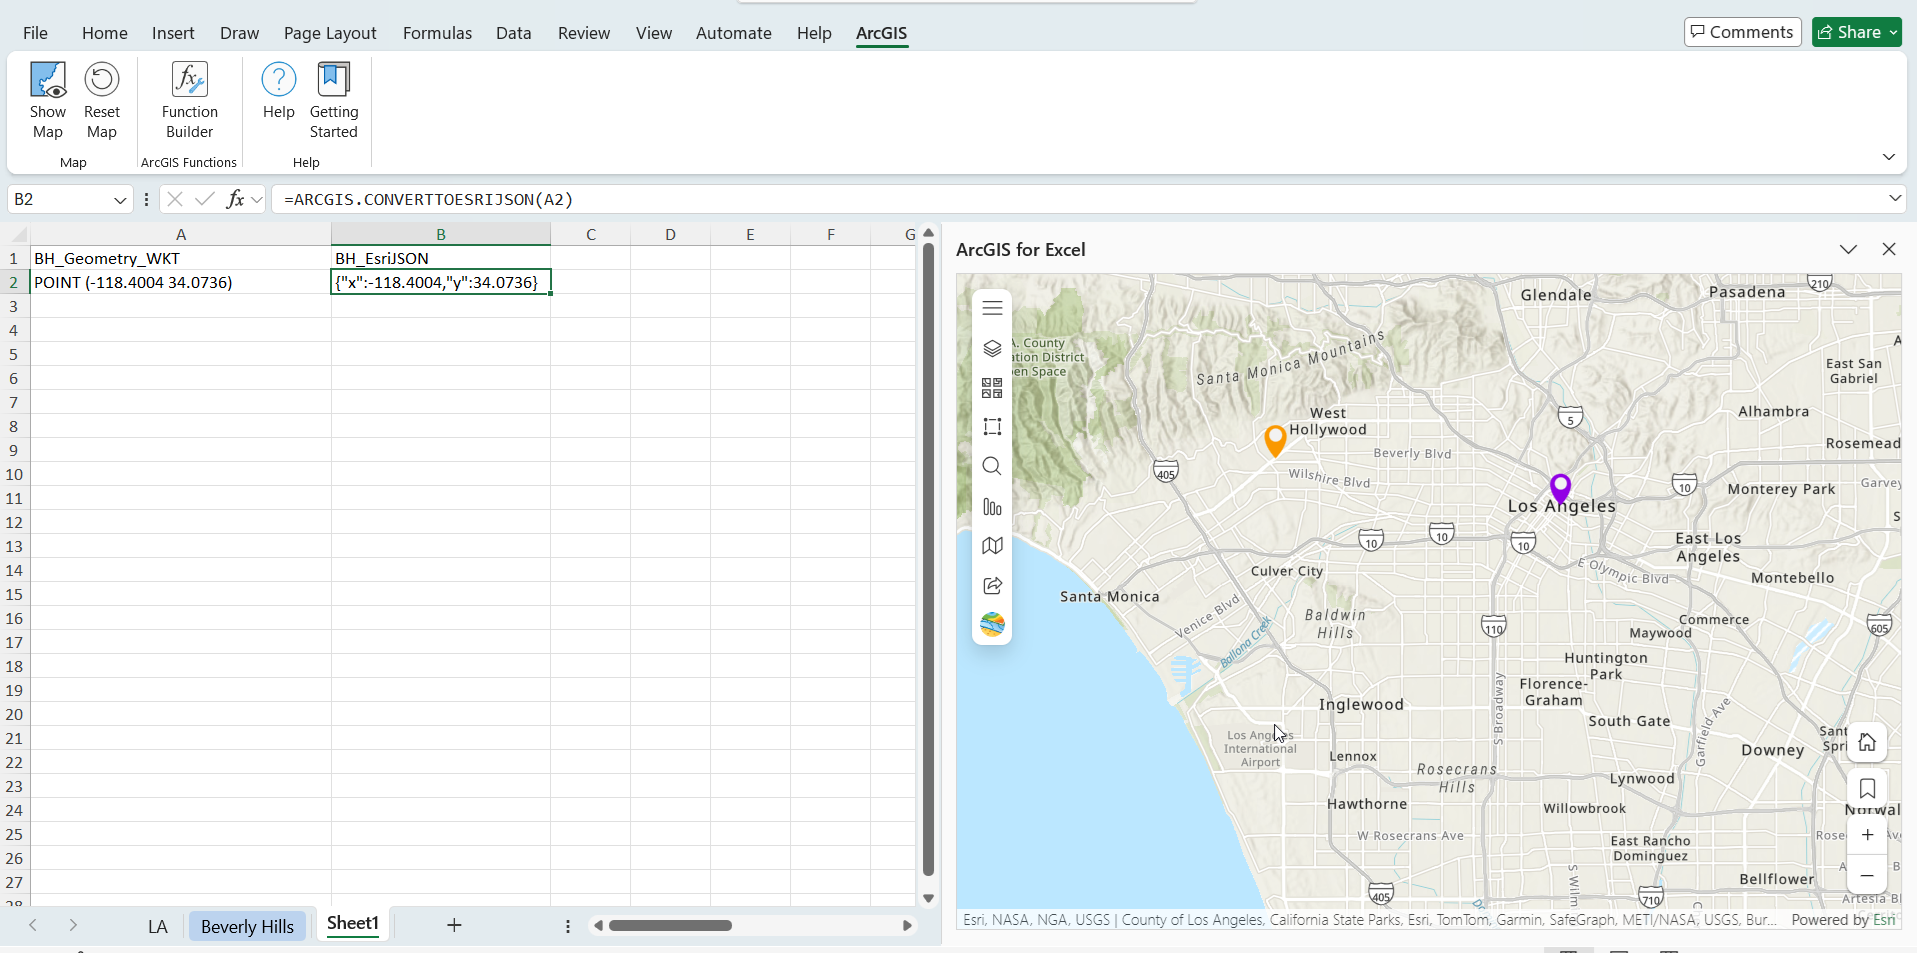
The distance calculation requires EsriJSON format. Use ARCGIS.CONVERTTOESRIJSON function from the Function Builder to convert WKT geometry.
=ARCGIS.CONVERTTOESRIJSON(D2)
Step 4: Create WKT for ArcGIS layer Coordinates
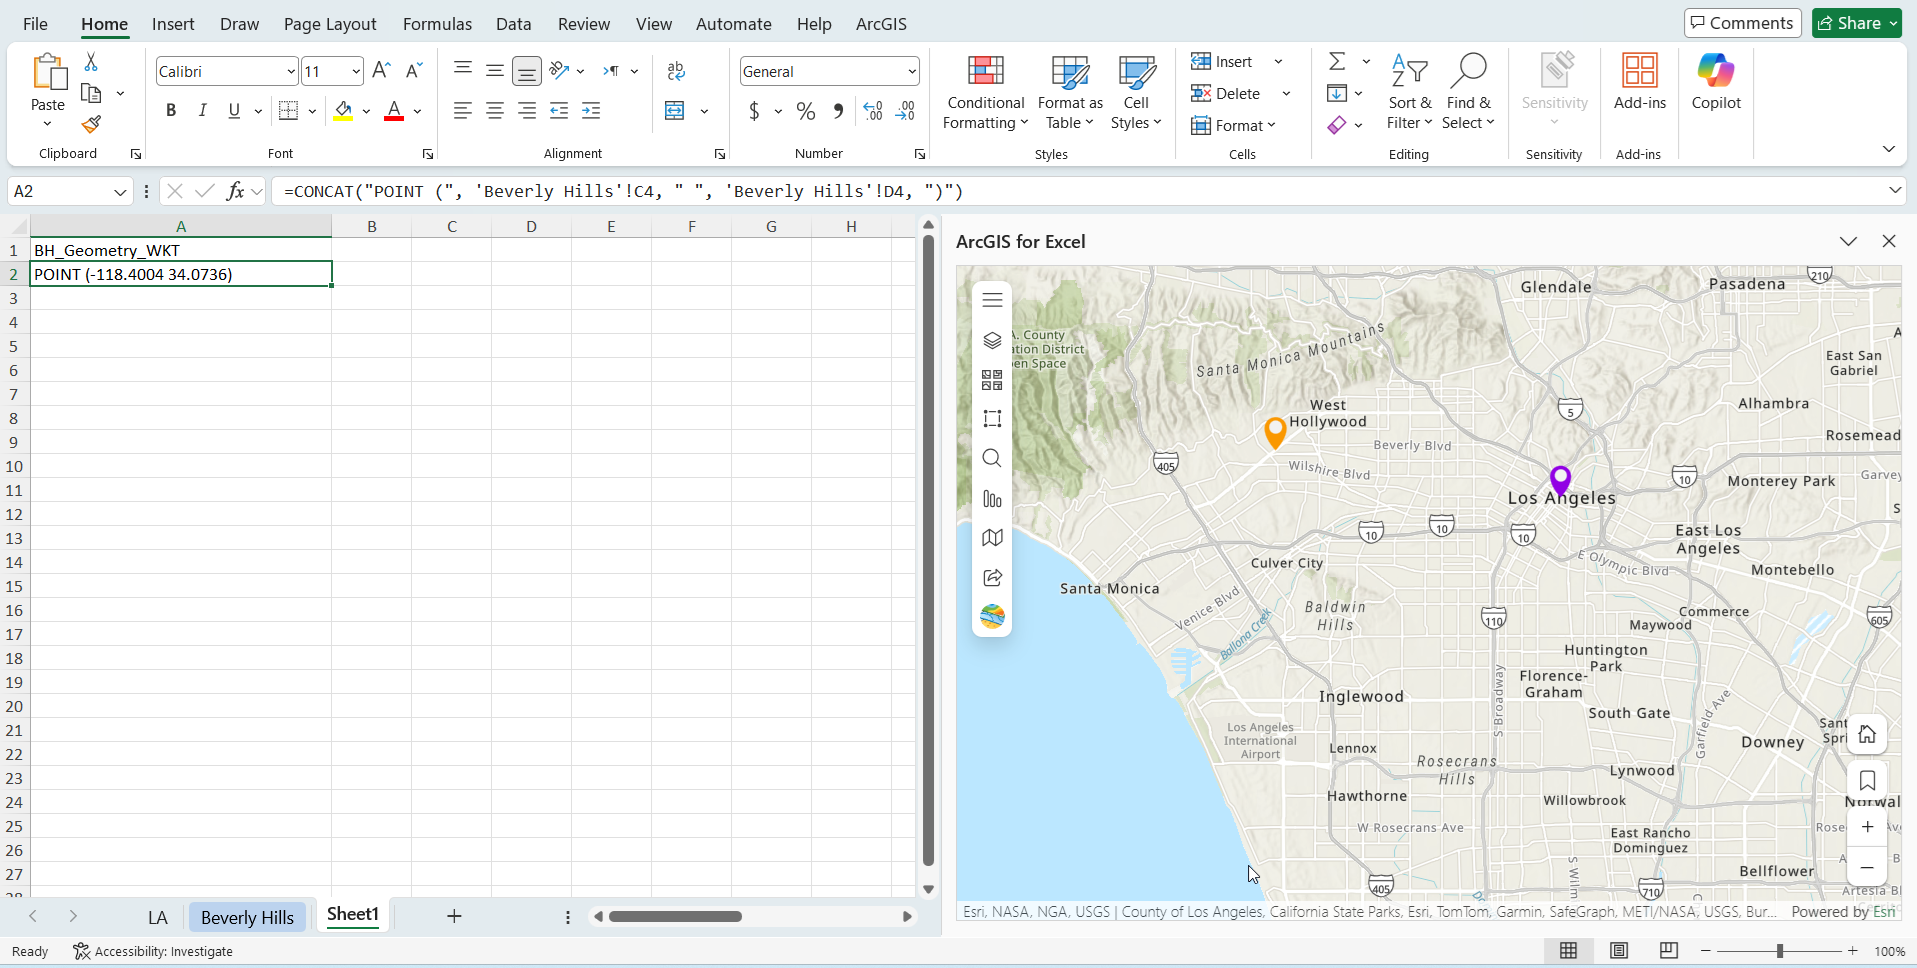
In a new worksheet, create WKT geometry for the ArcGIS layer coordinates by referencing the longitude and latitude columns from the Beverly Hills sheet:
=CONCAT("POINT (", 'Beverly Hills'!C4, " ", 'Beverly Hills'!D4, ")")
This returns values like POINT (-118.4004 34.0736) for Beverly Hills location.
Now convert ArcGIS Layer data WKT to EsriJSON in the new worksheet –
=ARCGIS.CONVERTTOESRIJSON(A2)
Step 5: Calculate the distance between coordinates in Excel and in an ArcGIS layer
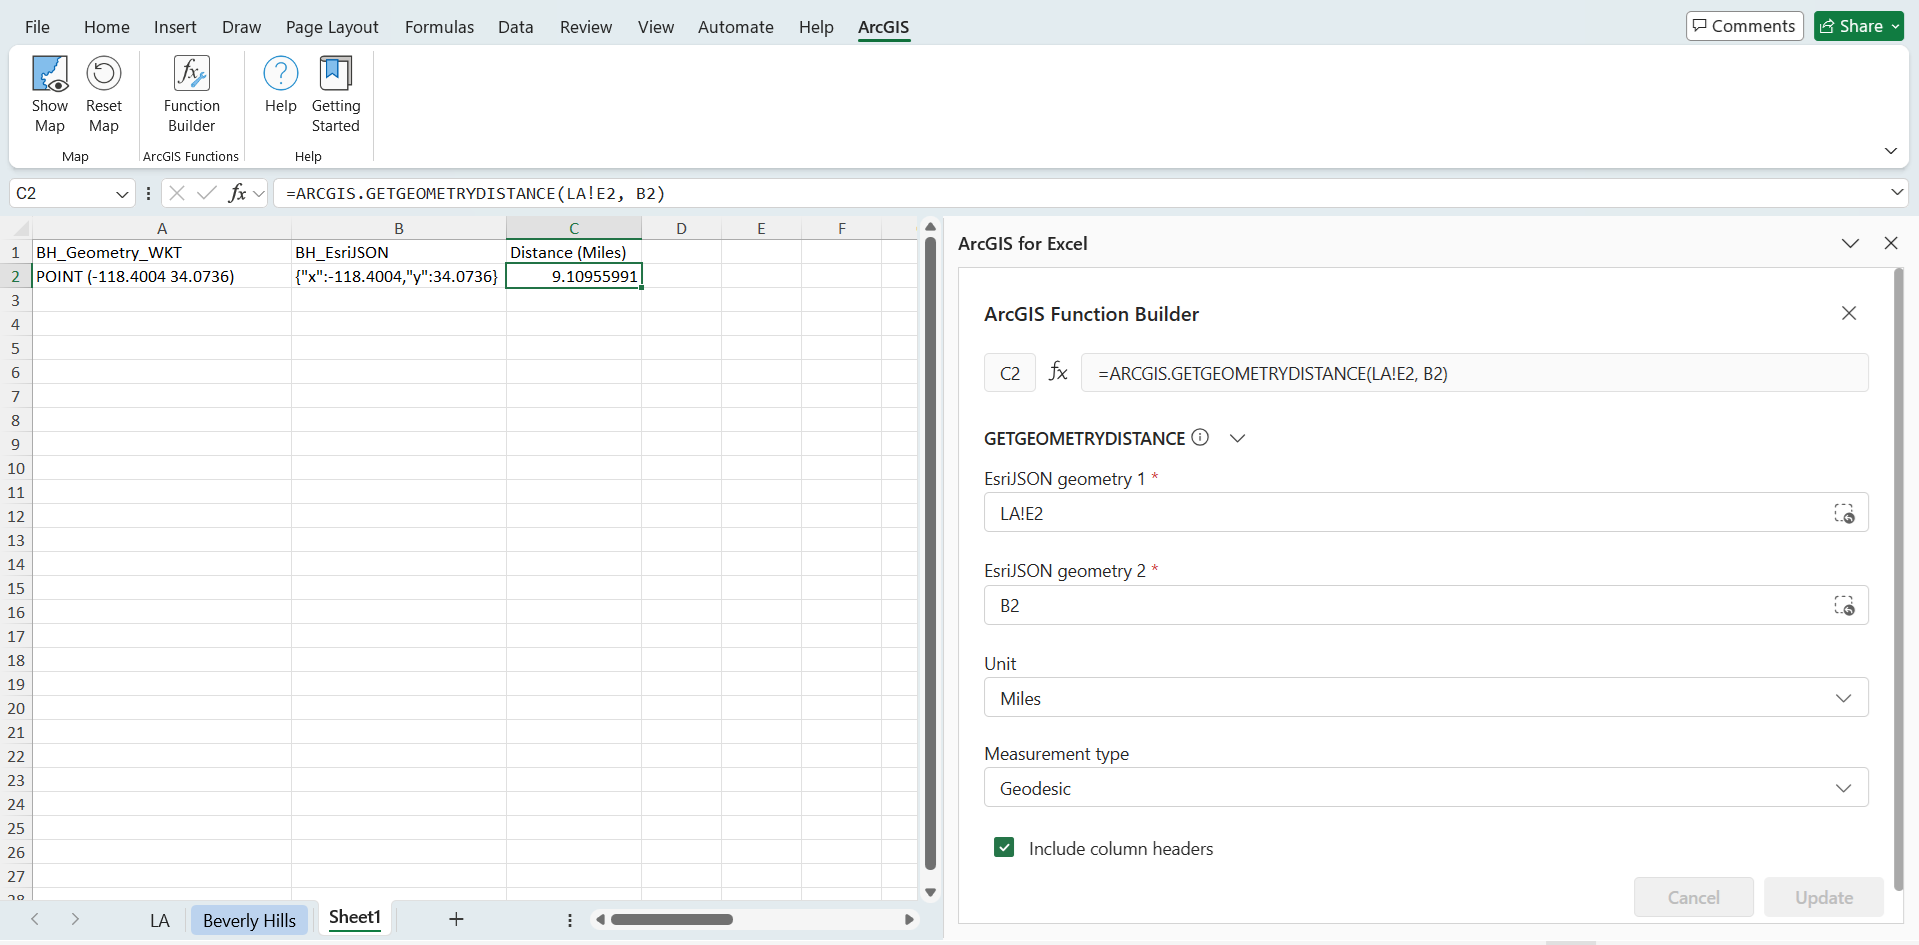
Use the ARCGIS.GETGEOMETRYDISTANCE function to calculate the straight-line distance between the two geometries:
=ARCGIS.GETGEOMETRYDISTANCE(LA!E2, B2)
Here, B2 is the EsriJSON geometry from the ArcGIS layer (Beverly Hills), and LA!E2 is the EsriJSON geometry from your Excel data (Downtown LA). This function returns the distance value in miles (by default).
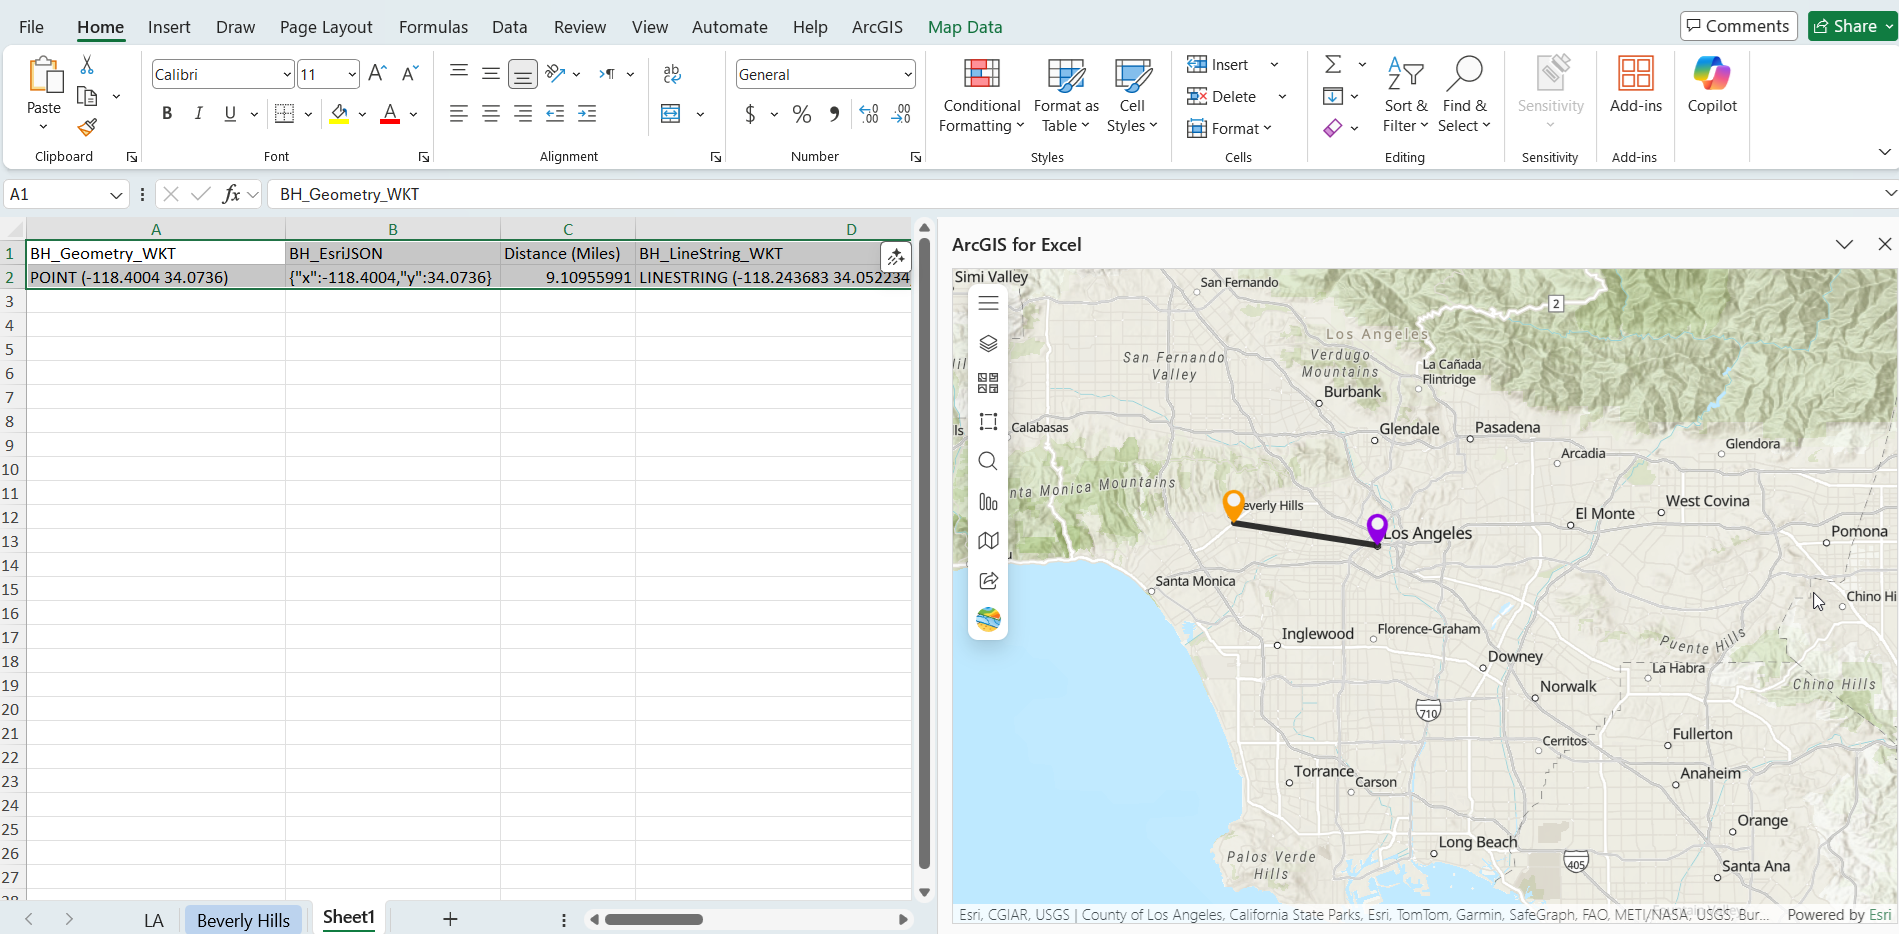
For example, the straight-line distance from Downtown LA to Beverly Hills is approximately 9.1 miles.
Step 6: Create a Line to Visualize the Distance on the ArcGIS for Excel map
The ARCGIS.GETGEOMETRYDISTANCE function returns only a distance value, not a geometry. To visualize the straight line between the two points on the ArcGIS for Excel map, you need to create a LINESTRING geometry.
Use concatenation to create a WKT LINESTRING connecting the two points:
="LINESTRING (" & X1 & " " & Y1 & ", " & X2 & " " & Y2 & ")"
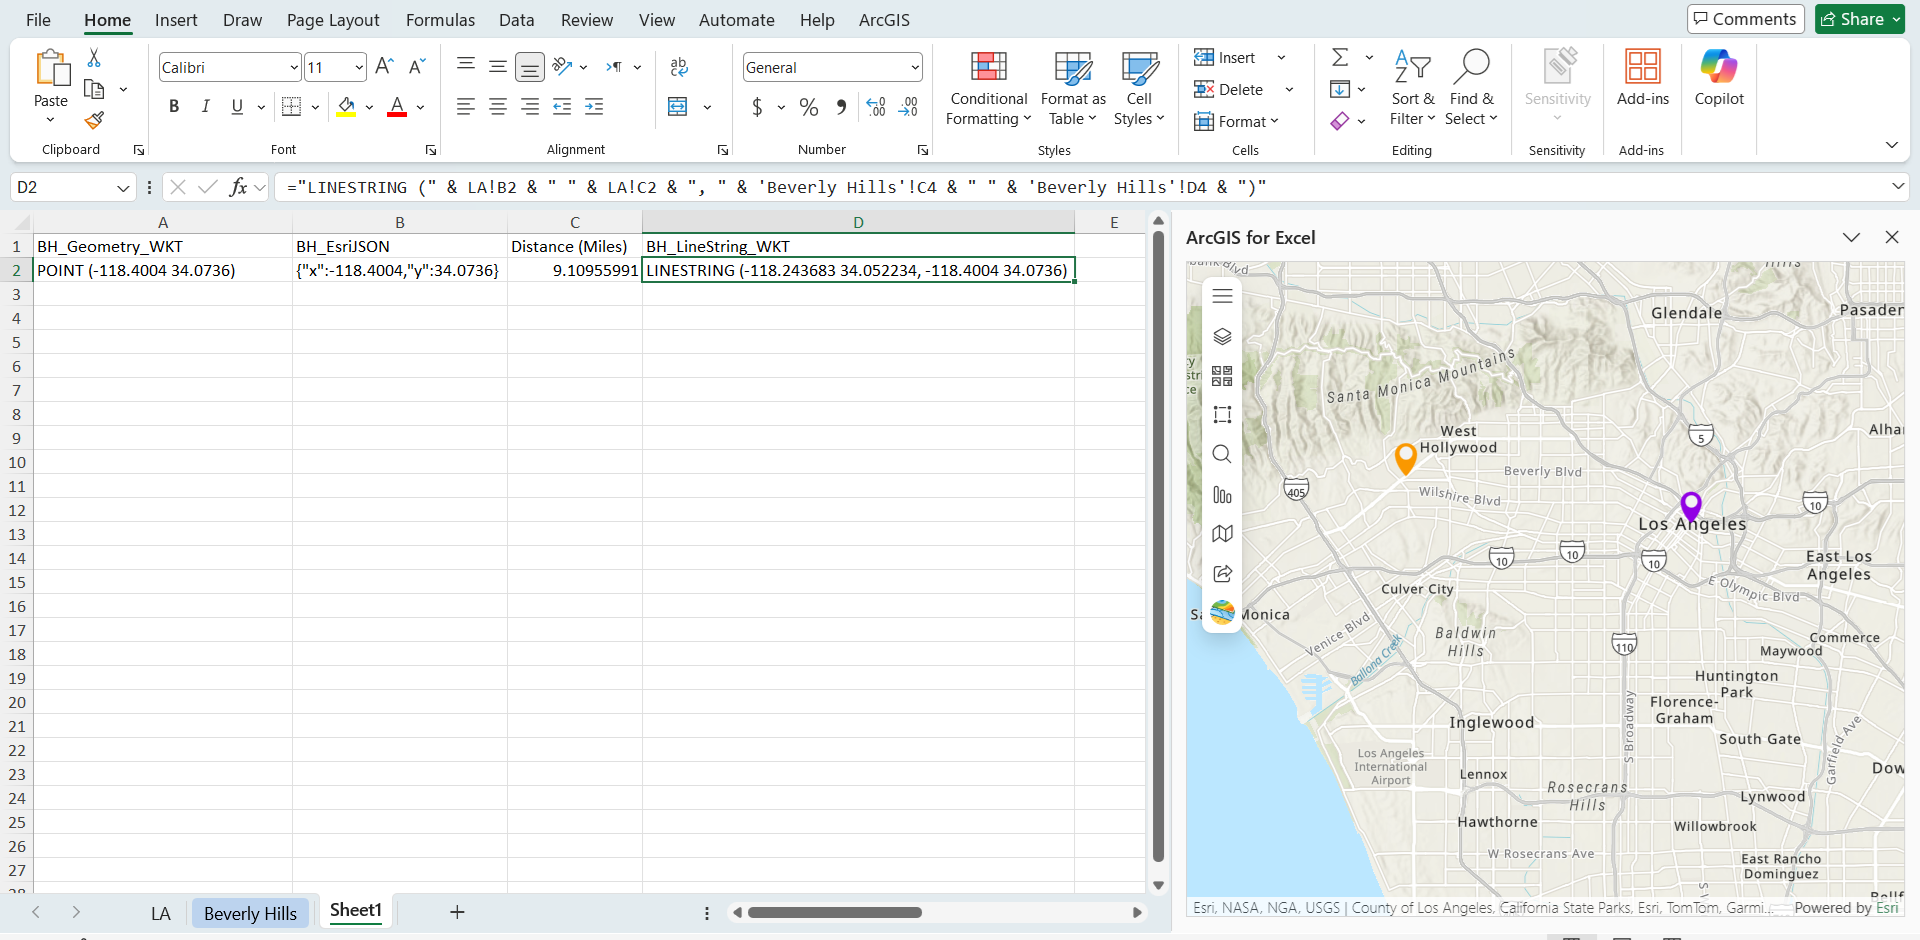
For example – now in the new sheet, reference the LA coordinates from the Excel worksheet and the Beverly Hills coordinates from the ArcGIS layer sheet:
="LINESTRING (" & LA!B2 & " " & LA!C2 & ", " & 'Beverly Hills'!C4 & " " & 'Beverly Hills'!D4 & ")"
This returns values like: LINESTRING (-118.243683 34.052234, -118.4004 34.0736)
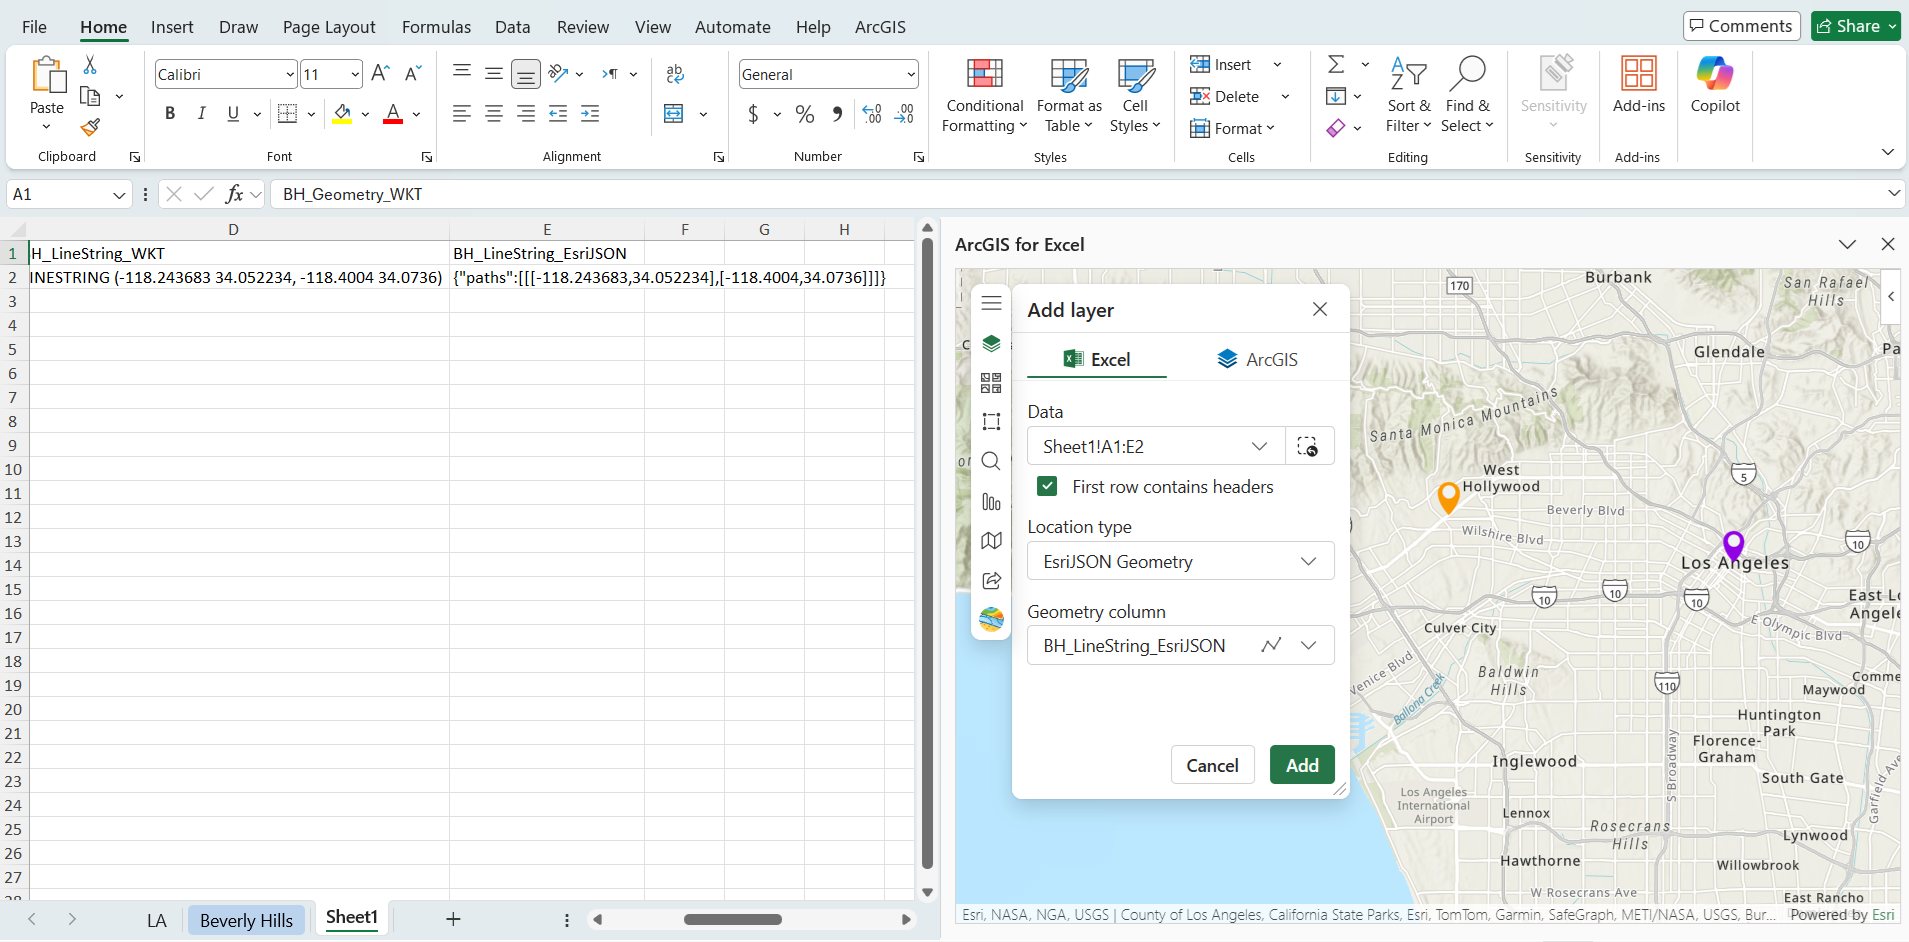
Step 7: Convert LINESTRING to EsriJSON and Add to Map
Convert the WKT LINESTRING to EsriJSON format:
=ARCGIS.CONVERTTOESRIJSON(D2)
Where D2 contains the WKT LINESTRING from Step 6.
To add the Straight line to the map:
- In the ArcGIS for Excel map, Click Add > Excel
- Select EsriJSON location type. In the Geometry column, select the EsriJSON column you created above.
- click Add
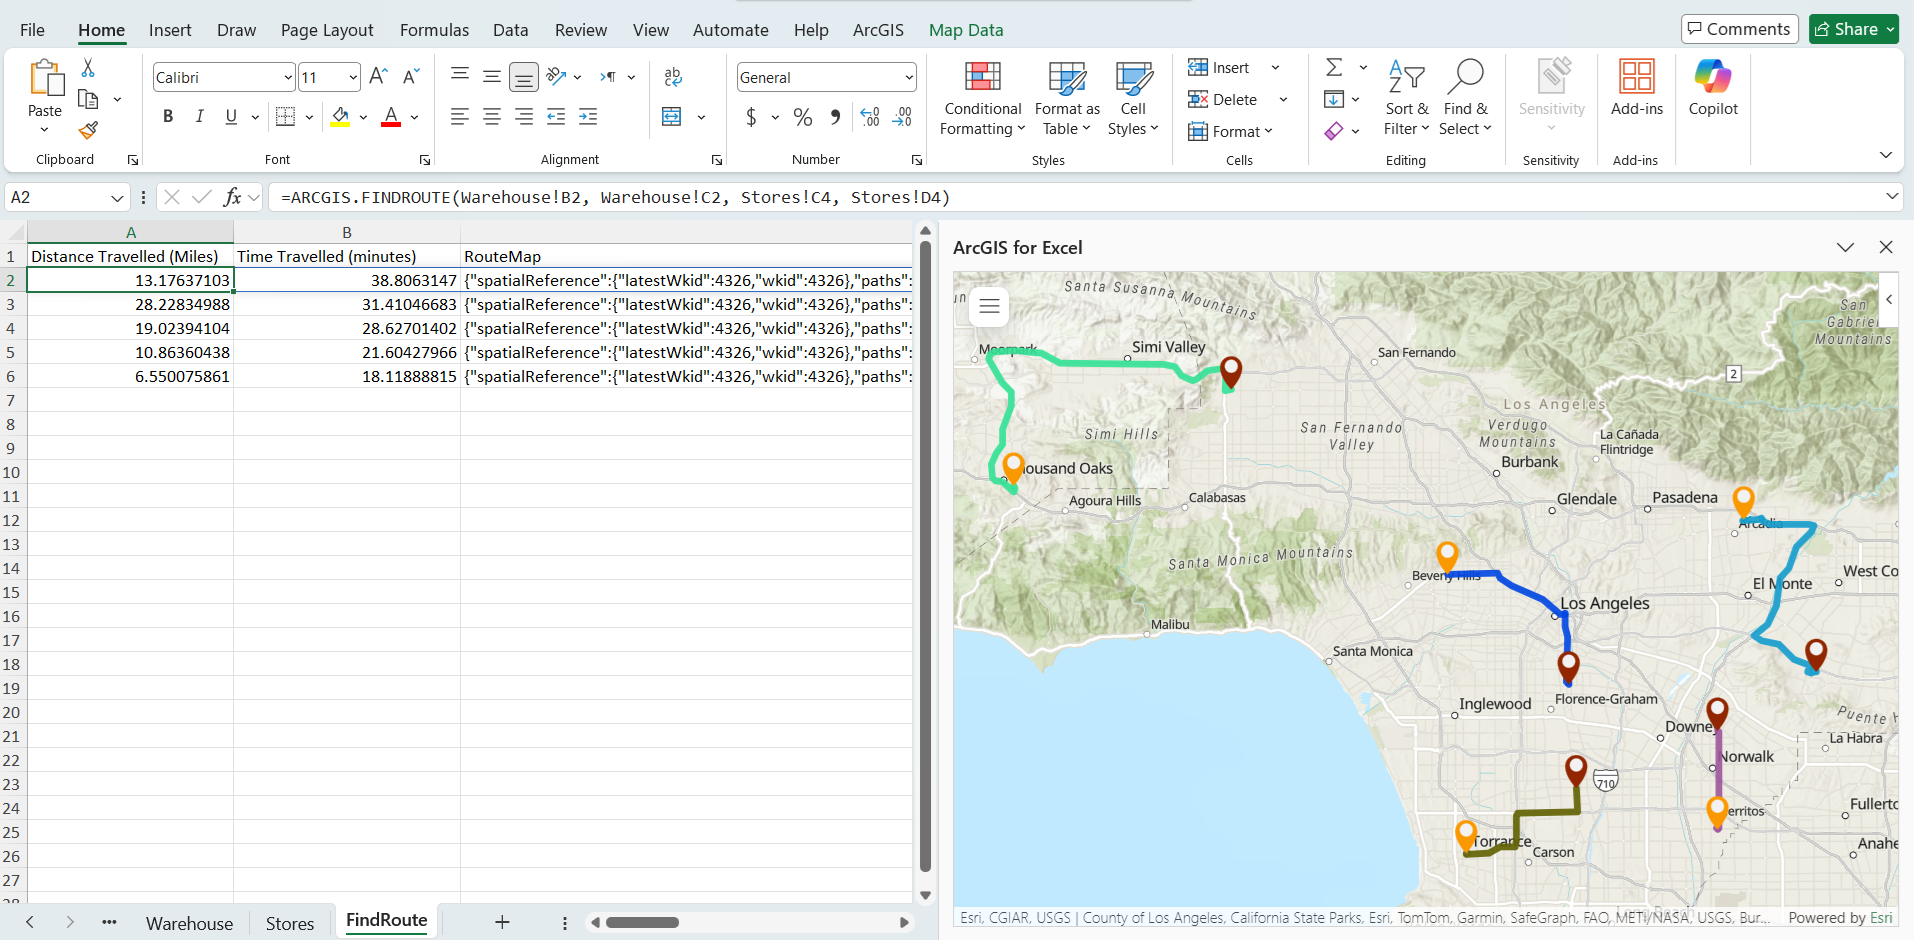
The above examples show a simple case with a single route between two locations, but this approach can of course be extended to data with multiple locations and, therefore, multiple routes. Below, you can see an example of multiple driving routes calculated in ArcGIS for Excel. Each brick red pin represents a warehouse, and each orange pin represents its assigned store. The colored lines show the driving route between coordinates in the Excel worksheet and coordinates in the ArcGIS layer data using the ARCGIS.FINDROUTE function.
Conclusion
ArcGIS for Excel provides powerful geospatial functions that allow you to perform distance calculations directly within your spreadsheet environment. Whether you need simple straight-line distances for proximity analysis or detailed driving distances for logistics planning, these functions integrate seamlessly with your existing Excel workflows and ArcGIS data.


Article Discussion: