As drought continues to be a concern in many parts of the world, it’s easy to forget that other parts combat stormwater runoff regularly. To illustrate, almost a quarter of the continental United States is currently in a drought, while some of the remaining states look to green infrastructure initiatives for help with stormwater. The historical grey infrastructure that consists of gutters, pipes, and tunnels is not a viable one according to the United States Environmental Protection Agency (US EPA). The infrastructure is aging, and its large-volume capacity is diminishing.
Grey vs. Green
Green infrastructure provides social and economic benefits. Its aesthetics in regions or neighborhoods have cascading effects. More greenery promotes outdoor recreation which improves public health overall and fosters community building. Measures such as urban tree canopies can boost property values.
While grey infrastructure directs the flow of collected stormwater, green infrastructures absorb stormwater where it falls. The objectives have shifted from managing the flow and capacity to the impact on water quality and ecosystems. The data generated can be used to choose suitable locations for green infrastructure practices. By visualizing the data, the impact of potential scenarios at various scales can be analyzed.
What makes an infrastructure green?
A green infrastructure has many attributes and benefits. Green roofs reduce runoff volumes, regulate building temperatures, and provide urban wildlife habitats. Permeable pavements cool surface temperatures, also reduce runoff volumes, and improve water quality. Rain gardens or planter boxes support ground water recharge, pollutant removal, and runoff detention. Vegetated swales, or “bioswales” has shown promise in research to lessen peak flows, reduce pollutant loads, and enhance wildlife biodiversity . However, according to the US EPA, the performance of bioswales is sensitive to design. Urban tree canopies can enhance not only habitats, but also property values. They mitigate air pollution, reduce runoff quantity, and reduce energy use.
There is also an interest in rainwater harvesting and research into it is ongoing for water conservation and stormwater management purposes, as well as the benefits of constructed wetlands.
Open GeoPlanner’s green infrastructure template
This type of pioneering work calls for unique tools. ArcGIS GeoPlanner’s green infrastructure template contains an arsenal that facilitates the planning for green infrastructure.
Ensure you have an ArcGIS organization account with the GeoPlanner app and follow along to learn what GeoPlanner and the green infrastructure template has to offer.
Step 1 – Browse to https://geoplanner.arcgis.com/ in a browser and sign in with your ArcGIS organization account.
Step 2 – Click the Create new button to create a new project.

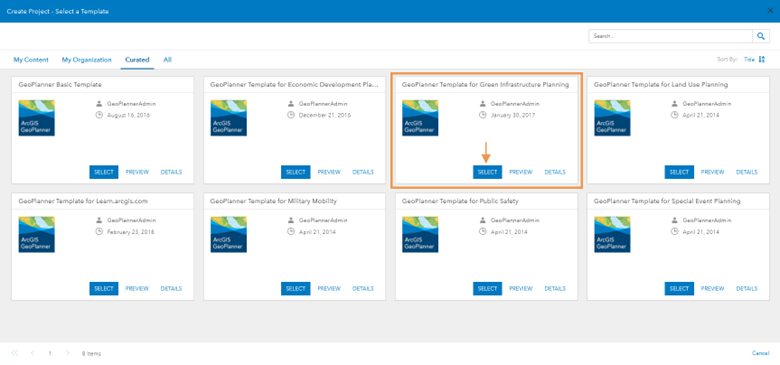
Step 3 – Look for the GeoPlanner Template for Green Infrastructure Planning and click the Select button.
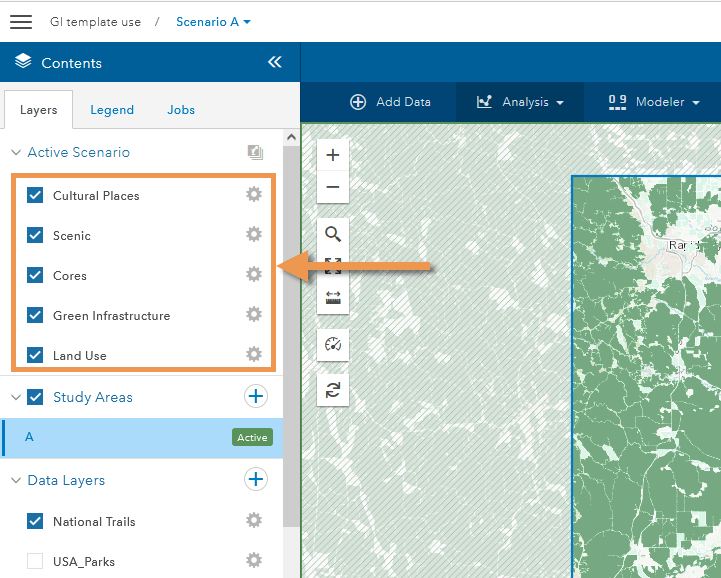
Step 4 – Review the Active Scenario section in the Contents pane. These are the scenario layers and are sometimes referred to as design layers because they house the features that you create on the map for your design.
Step 5 – Review the Data Layers in the Contents pane to learn what kind of data sets are included with the green infrastructure template.
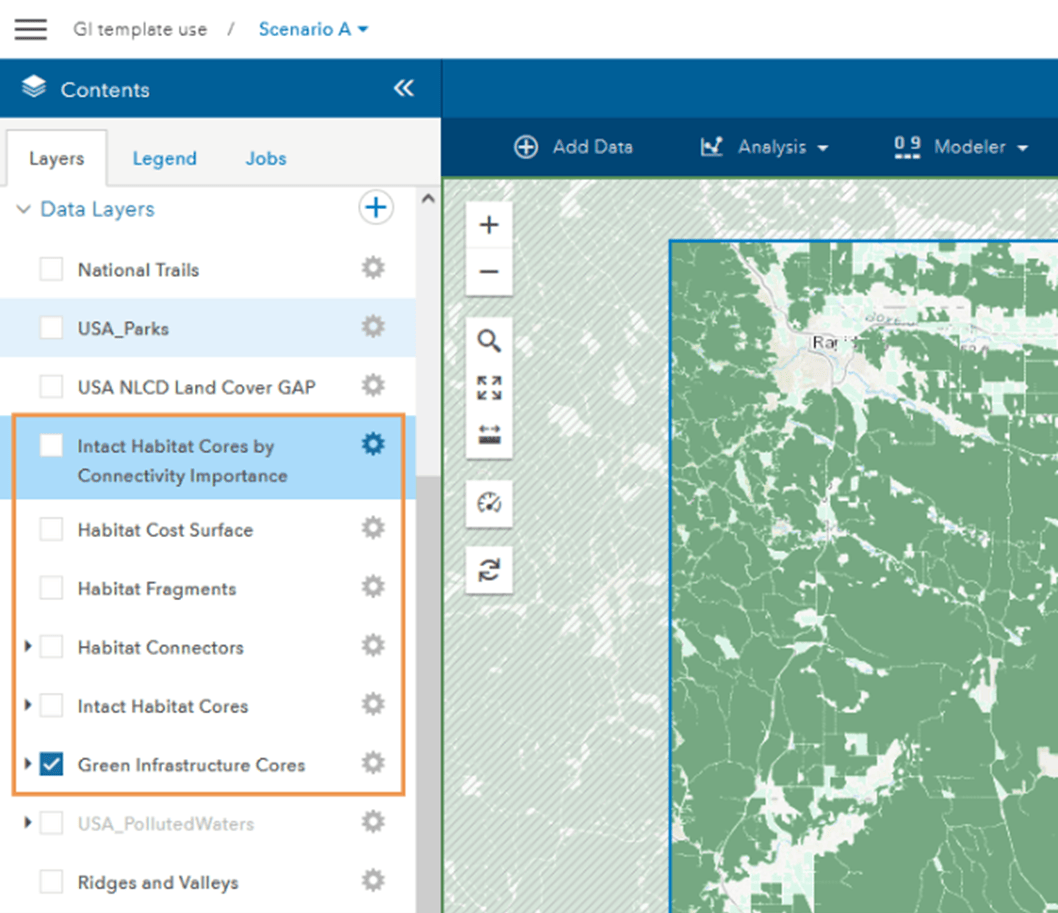
Among the datasets included in the template’s Data Layers are five that were generated as part of Esri’s Green Infrastructure initiative: Intact Habitat Cores, Habitat Connectors, Habitat Fragments, Habitat Cost Surface, and Intact Habitat Cores by Betweeness.
Image layers may have limitations, but other layers such as the USA_Parks feature layer can be imported into your scenario layers to immediately work with them without having to create them.
Step 6 – Click the Design tab to open the design tools and click the pencil icon to review the included preset feature symbology.

The template includes intuitive symbology and when you place any of these items on the map, they appear in their respective scenario layer.
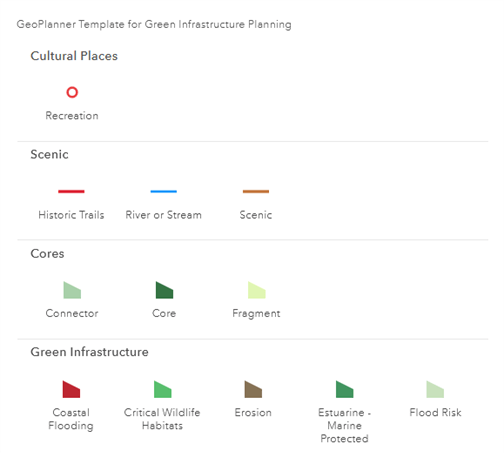
This enables you to drop in or sketch out features in your scenario, without spending time creating symbology that conveys green infrastructure elements.
Step 7 – From a corresponding scenario layer, open a scenario layer’s table to see attributes, or fields, for the features you add on the map.
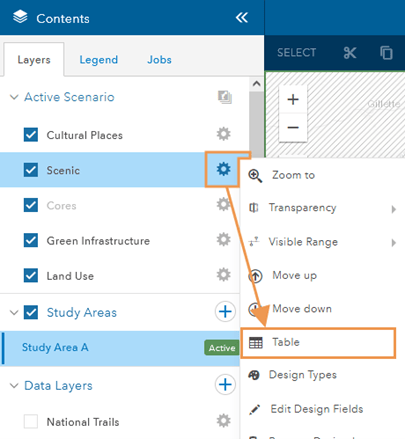
These attribute fields are also included with the template, and you can easily add more design fields to meet your organization’s needs as well. Some data layers, such as feature services, also have a table on which you can review features and their attributes.

Step 8 – Create a new scenario that we can import data layer to and modify.
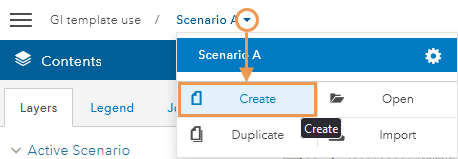
Step 9 – Fill in the new scenario’s details and click CREATE.
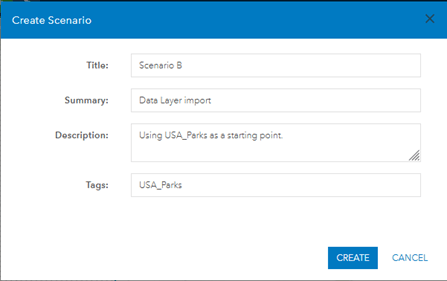
GeoPlanner allows you to compare multiple scenarios in one project so you can visualize proposed changes. This can be useful when considering how changes will impact existing green infrastructure, for example, Green Infrastructure Cores. These are minimally disturbed natural areas at least 100 acres in size and greater than 200 meters wide.
When looking at the map in GeoPlanner’s green infrastructure template, an organization can turn the Green Infrastructure Cores data layer on to note boundaries while working on changes to another layer. For example, say the USA_Parks data layer needs to be expanded but remain within the boundaries of the cores. The green infrastructure template in GeoPlanner contains both layers and by importing USA_Parks polygon to modify it, you can bring it into your scenario layers and make tweaks.
Step 10 – Ensure that the data layers are checked on and your new scenario is active.
Step 11 – Click on the Design tab.
Step 12 – Click on the Select Feature tool.
Step 13 – Ensure that you’re using the Select option and not Multi-Select.
Step 14 – Click a feature from the USA_Parks data layer and in the pop-up that appears, click Import.
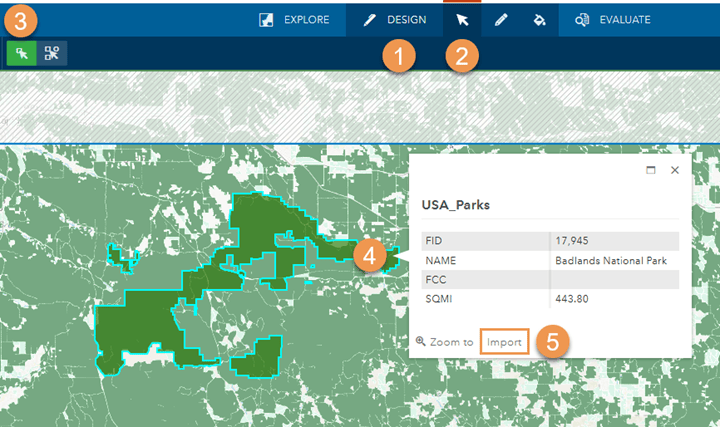
Step 15 – Use the drop-down arrows to specify which scenario layer the feature should be imported to and what type of feature it is. Then click Import.
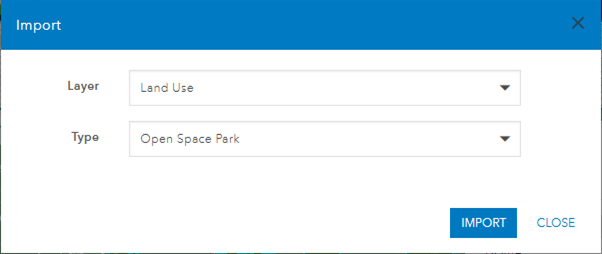
The feature is imported into the scenario layer that was specified and you can now make adjustments to it there.
Step 16 – Turn off the USA_Parks Data Layer as it is now a duplicate, and use the selection tool to double-click the imported feature on the map.
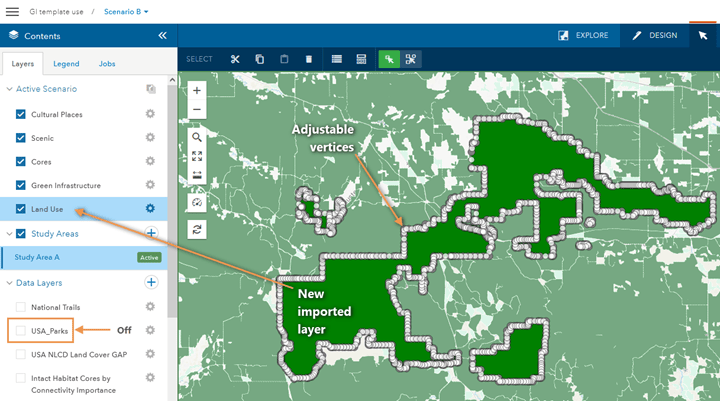
You can adjust as necessary while observing the underlying intact cores layer. Adding a dashboard can help meet specific criteria. For example, if your proposed changes need the area to remain above a 70 percent threshold, a dashboard provides real time charts to gauge the percentage of your modifications.
Step 17 – Click the Dashboard icon on the map.

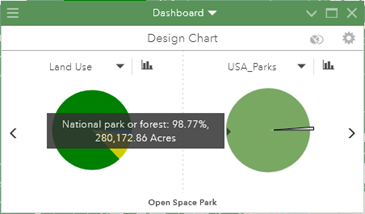
The Design Chart appears. The primary left side shows what the scenario layer specified contains. Currently, the imported USA_Parks into the Land Use scenario layer as Open Space Park is the only item, so our Land Use scenario layer is 100 percent Open Space Park.
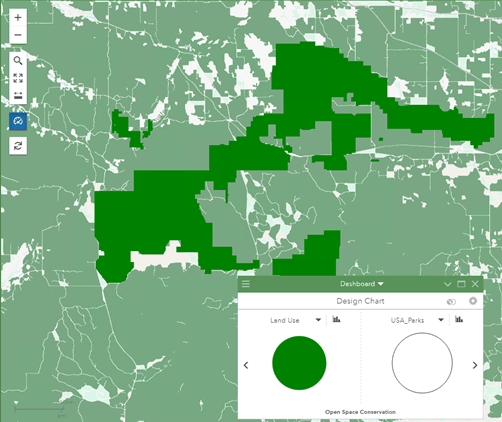
Step 18 – Add more features to see the primary chart update in real time.
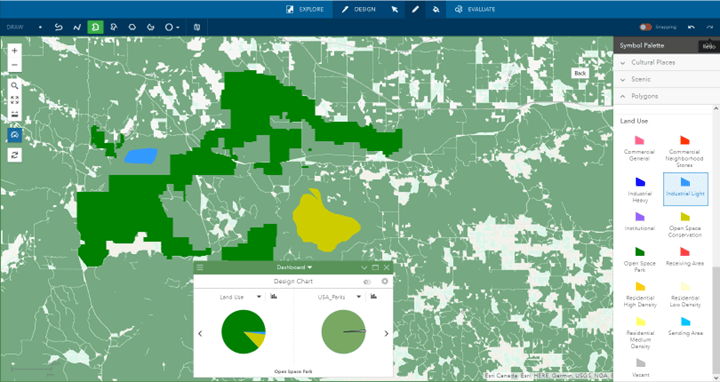
The secondary chart on the right of the dashboard further breaks down the type that is clicked in the primary left chart. For example, in the previous image the Open Space Park category was selected in the left chart, by hovering over the right chart, I can see that 98.77 percent is national park forest and there is no data for the remaining area (1.33 percent). The USA_Parks polygon serves as an underlying assessment layer.
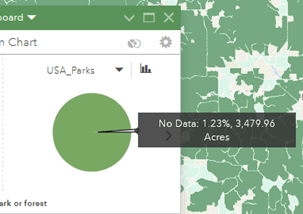
If more Open Space Park that cover regions without data is drawn on the map, the secondary chart updates automatically.
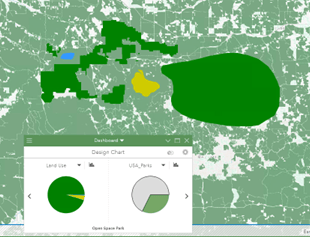
Reviewing the values in the dashboard as features are added or modified helps meet any requirements an organization may be targeting.
GeoPlanner’s green infrastructure template is built for planners to hit the ground running when it comes to green infrastructure, and like all the GeoPlanner templates, it can be customized for an organization’s needs. The steps outlined here are intended to get someone new to GeoPlanner and green infrastructure started but read on for more resources involving the rest of the iceberg.
Resources
Learn more about the GeoPlanner green infrastructure template and how you can quickly create green infrastructure elements to visualize and evaluate proposed planning on the GeoPlanner Resources site. You can also visit the GeoPlanner video resources site to watch GeoPlanner and more of its tools in action. Find out more on how to plan and contribute with green infrastructure in mind on Esri’s Green Infrastructure website.
Information about drought and EPA found on the following government sites:
- https://www.drought.gov/
- https://www.epa.gov/green-infrastructure


Article Discussion: