This blog explores the Sea Surface Temperature layer hosted in the Living Atlas of the World. It highlights how you can summarize and analyze it to gain valuable insights into trends and patterns.
Sea Surface Temperature is a key measurement for weather and climate prediction, ocean forecasts, tropical cyclone forecasts, and coastal applications such as fisheries, pollution monitoring, and tourism. For example, scientists use sea surface temperature maps to forecast El Niño and La Niña events.

Because water absorbs and loses heat more slowly than landmasses, the ocean helps balance global temperatures by absorbing heat in the summer and releasing it in the winter. Without the oceans to help regulate global temperatures, the Earth’s climate would be bitterly cold, much like Mars.
The Sea Surface Temperature layer in the Living Atlas is multidimensional, containing information about temperature across time. It provides global daily sea surface temperature measurements between 1981 and May 22, 2023.
You can visualize and analyze this layer in ArcGIS Pro or include it in web maps or apps you publish online. You can apply raster functions to convert between Celsius and Fahrenheit, create contours for temperature gradients, or apply a complex raster function chain for more advanced analyses. In addition, analysts can use the layer as an input to geoprocessing tools and ModelBuilder. By default, the temperature units are degrees Celsius. The layer works like a rolling repository of Sea Surface Temperature available locally on your desktop.
We can use this layer to observe the changes over time in Sea Surface Temperature (using the Zonal Statistics as Table geoprocessing tool).
 trends from 1981 to 2023.")
This chart shows day of the year global SST temperatures in degrees Celsius from 1981 to 2023. Note the highest values occurred very recently, starting in March 2023.
We can use multidimensional analysis to understand where significant trends occur (using the Generate Trend Raster geoprocessing tool).

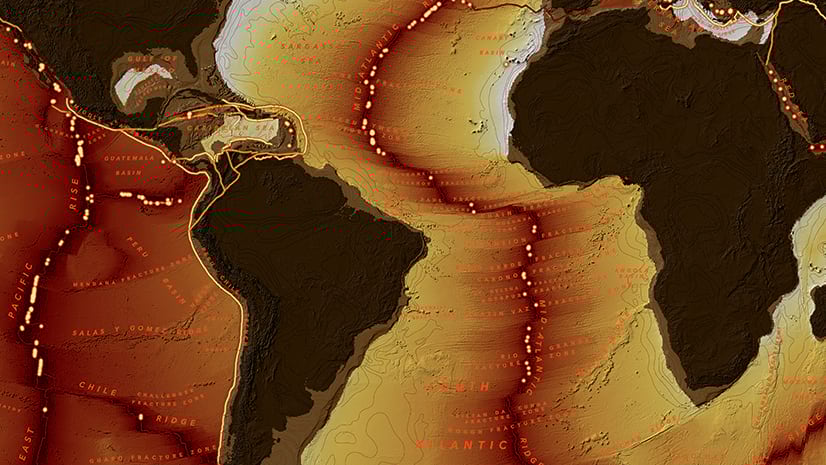
This map shows the areas experiencing the most change over the long term. The only places experiencing a cooling trend are the Arctic and Antarctic regions due to glacial melt and the area off of Chile and Peru where the Humboldt current transports the cold water from the Antarctic.
We can also assess specific regions of interest using this layer, such as the North Atlantic region between 0-60N and 0-80W (using the Zonal Statistics as Table geoprocessing tool).

This allows us to understand regional trends, associate other environmental data, and estimate impacts. Note the winter and summer patterns displayed in the chart.


This information can also be used for environmental attribution (using the Sample geoprocessing tool) to enrich observational data with SST measurements to help understand preferred habitat types in a species distribution modeling workflow.
What can you do with his layer?
- While we explored trends in sea surface temperature in the North Atlantic, the SST layer is global, and you can examine trends in your favorite ocean.
- The ocean’s ability to store and absorb heat significantly impacts global climate and weather patterns, but it also has local For example, coastal areas can be more temperate since ocean waters release heat slower than the land. Using the same geoprocessing tools mentioned in this blog, summarize a coastal region’s long-term land temperature trends and compare them to trends in sea surface temperature in the surrounding area.
- Identify and explore unusual sea surface temperature events using the Generate Multidimensional Anomaly


Article Discussion: