Newly-released 2020-2024 American Community Survey (ACS) five-year estimates from the U.S. Census Bureau are now available in ArcGIS Living Atlas. These ready-to-use layers enable GIS analysts to begin to explore, map, and analyze many demographic, social, economic, and housing topics. The multi-scale layers have data for state, county, and tract levels. Free access to these layers in ArcGIS Living Atlas significantly reduces the time GIS users spend downloading, processing, and joining data.
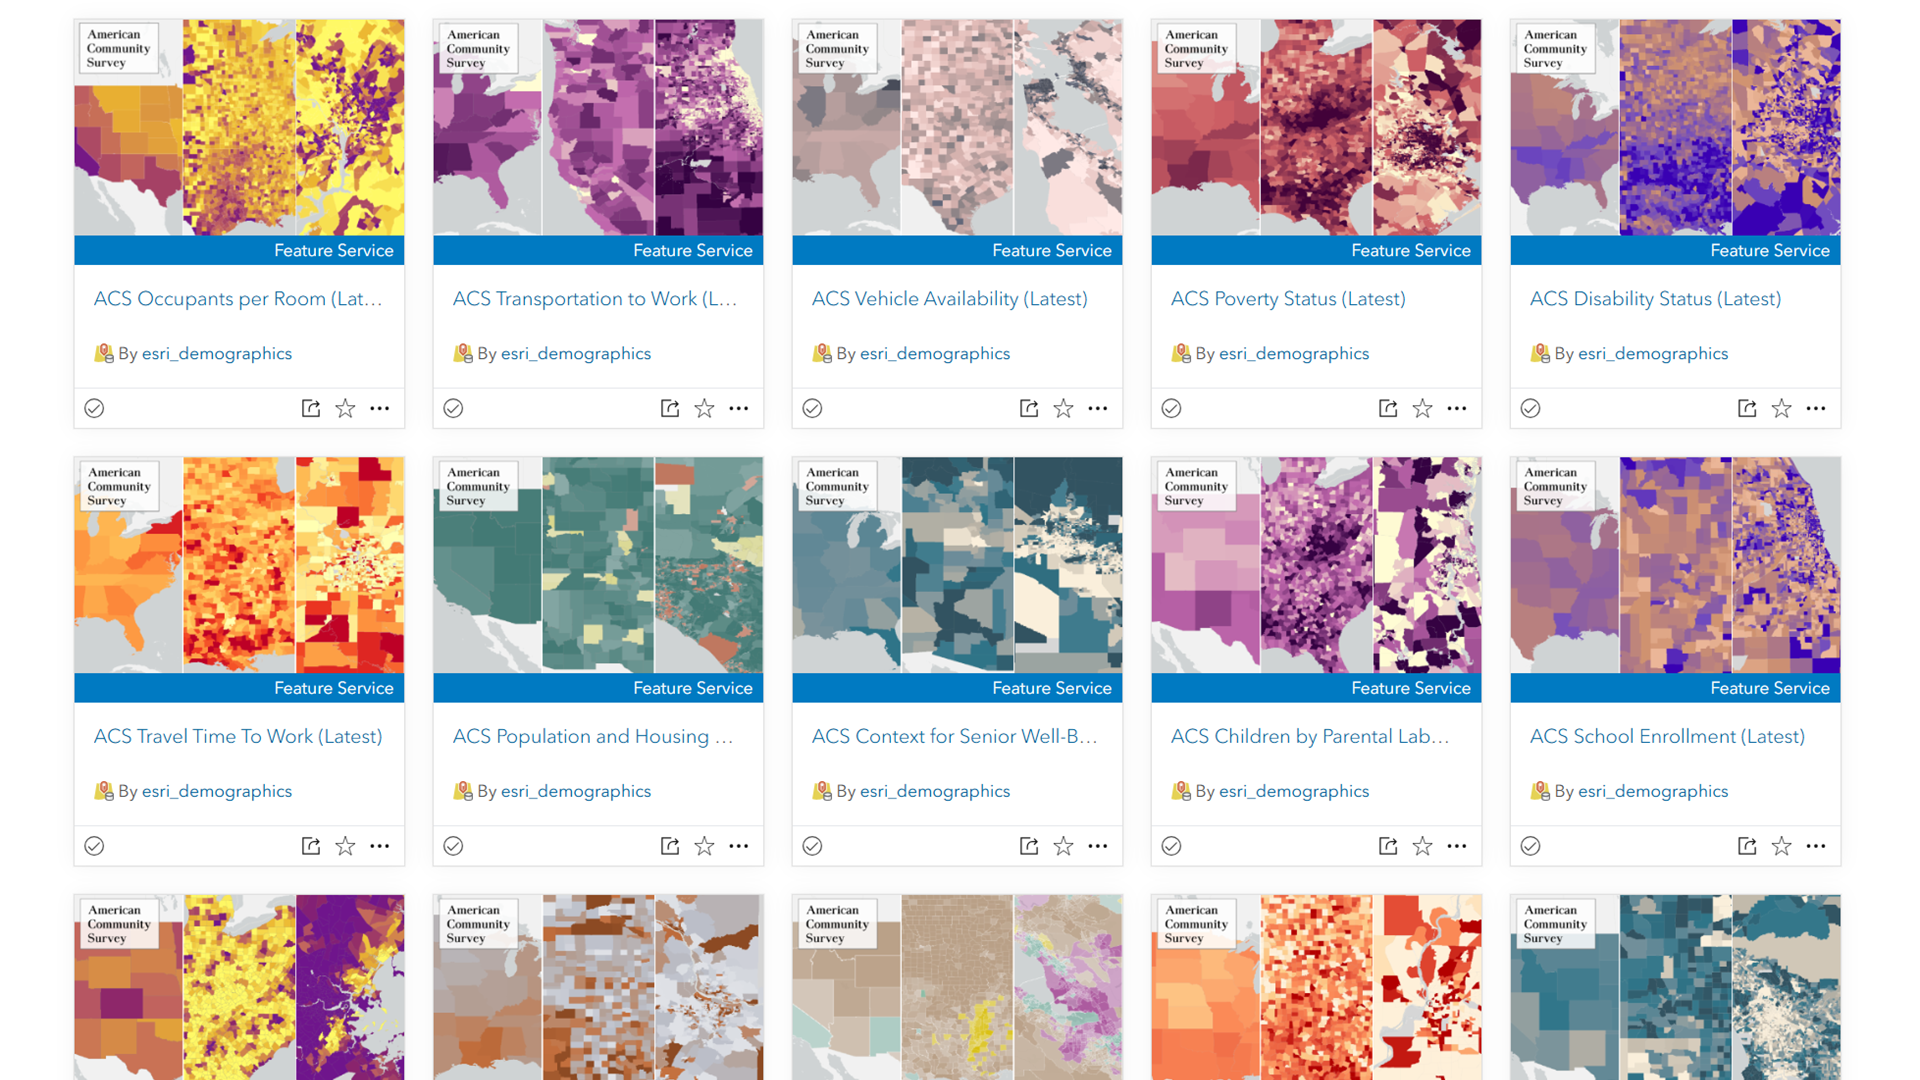
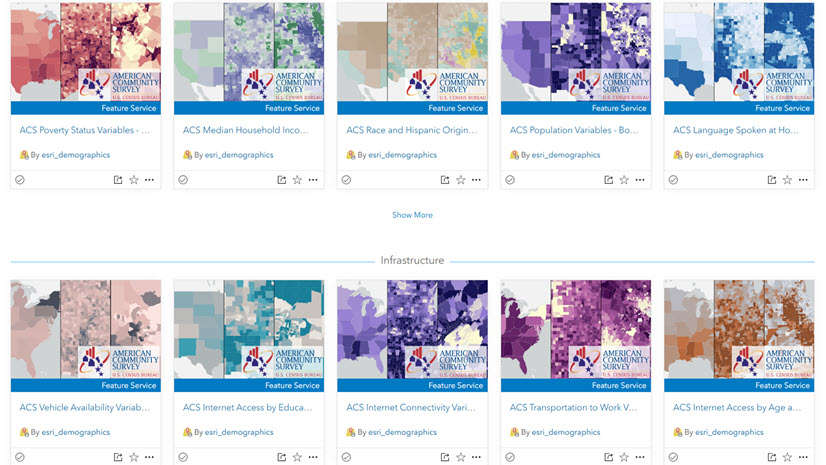
The Census ACS layers in Living Atlas cover many topics on population, housing units, income, education, health insurance, veteran status, and more. More than 100 layers are available, each focusing on a specific topic. Each topic’s layer is hosted as both boundaries and centroids for your spatial analysis, mapping, charting, and visualization. Each layer is symbolized to show an interesting attribute, and configured with an informative pop-up. With these, you can immediately see important patterns anywhere within the U.S. and Puerto Rico. Use the layers to create your own customized web maps and applications to tell all kinds of stories about your community.
Additional benefits of these layers:
- They are sourced directly from the U.S. Census Bureau API.
- Source table names are documented in the Item Page, and the original Census field names are used throughout.
- The boundaries are trimmed along coastlines, lakes, and major rivers to enable cartographically pleasing maps of Census data.
- Additional attributes are already calculated for your convenience, such as percentages and their related margins of error.
- Each field is fully documented with a human-readable field alias and a long field description that explains what the field is. This information comes from Census’ technical documentation. By adding this information directly into the service, all GIS users have access to it from within ArcGIS products and can know what a field means without having to go find a metadata document.
- Data undergoes rigorous quality assurance (QA) checks at each step, comparing every value in every layer to the source.
Updated data is available in new layers
Living Atlas has provided ACS layers, maps and apps to the GIS community as a free resource since December 2018. The new layers utilize hosted feature layer views. This eliminates layer downtime during data updates, while increasing the ability to conduct quality assurance.
The original layers were created seven years ago, which is an eternity in software standards. The original layers were updated in-place each year, requiring down time of at least a few hours per layer. They were created in Map Viewer Classic, before layer views even existed. Still, these original layers serve the GIS community well and will continue to be available through January 2027.
In order to prepare for future capabilities, and to eliminate annual downtime for users, we have transitioned the way we do the ACS update this year. This year, instead of updating the ACS layers in-place (risking downtime), we have created net new layers as hosted feature layer views. This approach puts this popular content on a better path for future years.
Here you will find a one-to-one list of old-to-new item IDs. Stay tuned for more blogs and resources about multiple ways to make this one-time transition to the new layer views.
Additional improvements this year
More attributes and content
- We added a layer called Specific Asian Groups a few years ago, enabling users to map groups such as Filipino, Korean, and Asian Indian. This year, Afghan has been added as an additional group. The entire table has been restructured, therefore when you map groups/attributes that were available previously, their field name may have changed. We suggest reviewing and updating any maps using this layer to reflect the new fields.
- This year we are introducing a new layer on occupants per room (crowded housing),with breakdowns by age of householder, race of householder, and owner/renter status.
 housing units have 1.01 or more occupants per room, and are therefore considered crowded, which is 17.4% (+/- 8.4%) of all occupied housing units. (Pop-up continues on to present the most common age group of householders living in crowded housing, as well as breakdowns by owner-occupied/renter-occupied and race/ethnicity of householder.)")
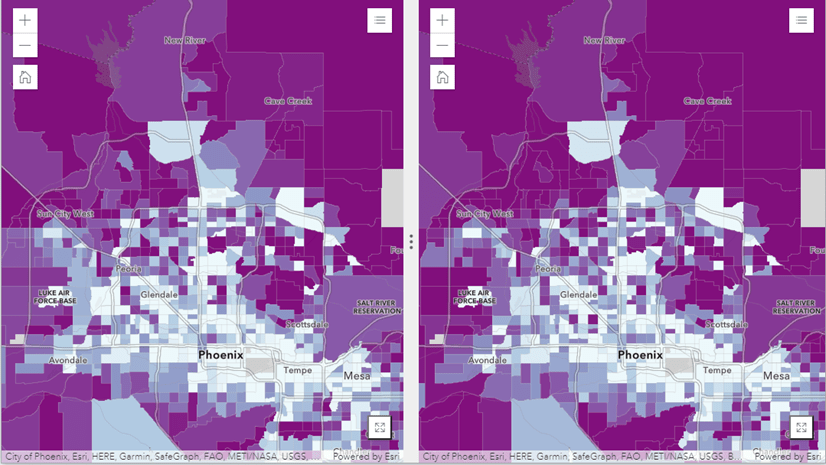
Updated symbology
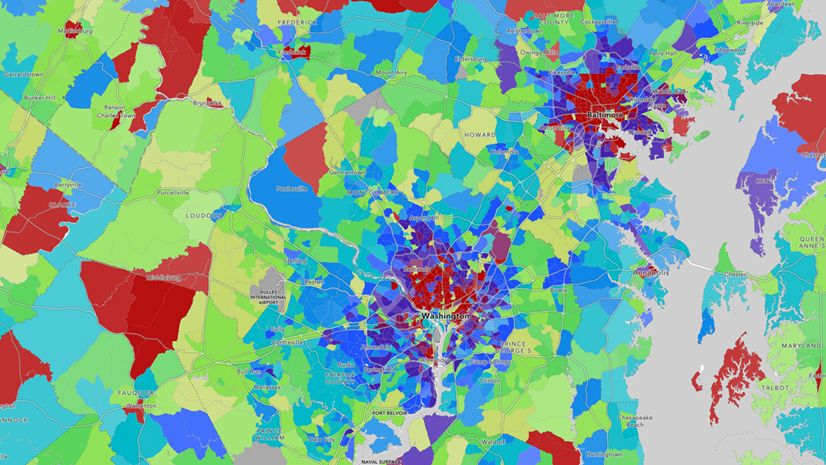
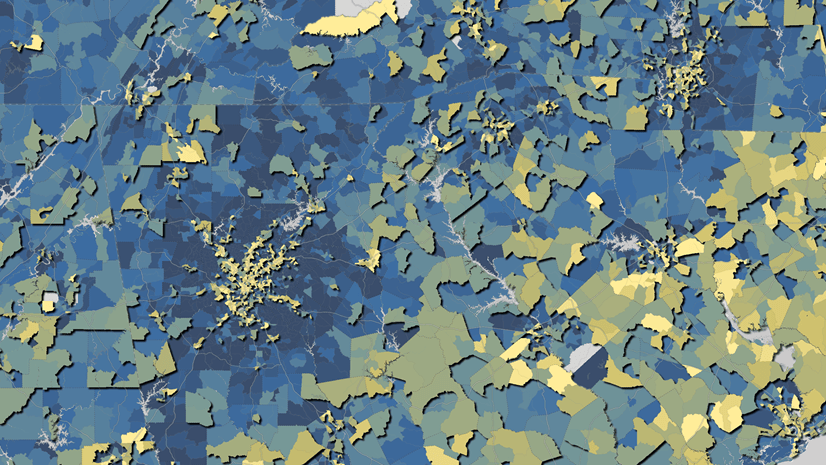
Many layers had their cartography adjusted to a more modern color ramp, with more contrast between high and low values. For all layers, the breakpoints have been adjusted, informed by the latest period’s distribution of the data values, as we have done for previous updates.

Focused web maps help answer specific questions
In addition to the layers, there are many pre-configured web maps that shed light on specific policy questions, all available in ArcGIS Living Atlas. There are more than 200 maps using ACS data in Living Atlas that are being updated to the newest layers in the coming weeks. Some examples include:
- What are the most popular commute alternatives?
- What is the predominant type of fuel used to heat homes?
- What percentage of housing units are single-family detached?
These web maps can be used in Story Maps, Hub sites, Dashboards, Instant Apps, Experience Builder, and other configurable apps. You can easily apply a filter to these web maps to highlight your community.
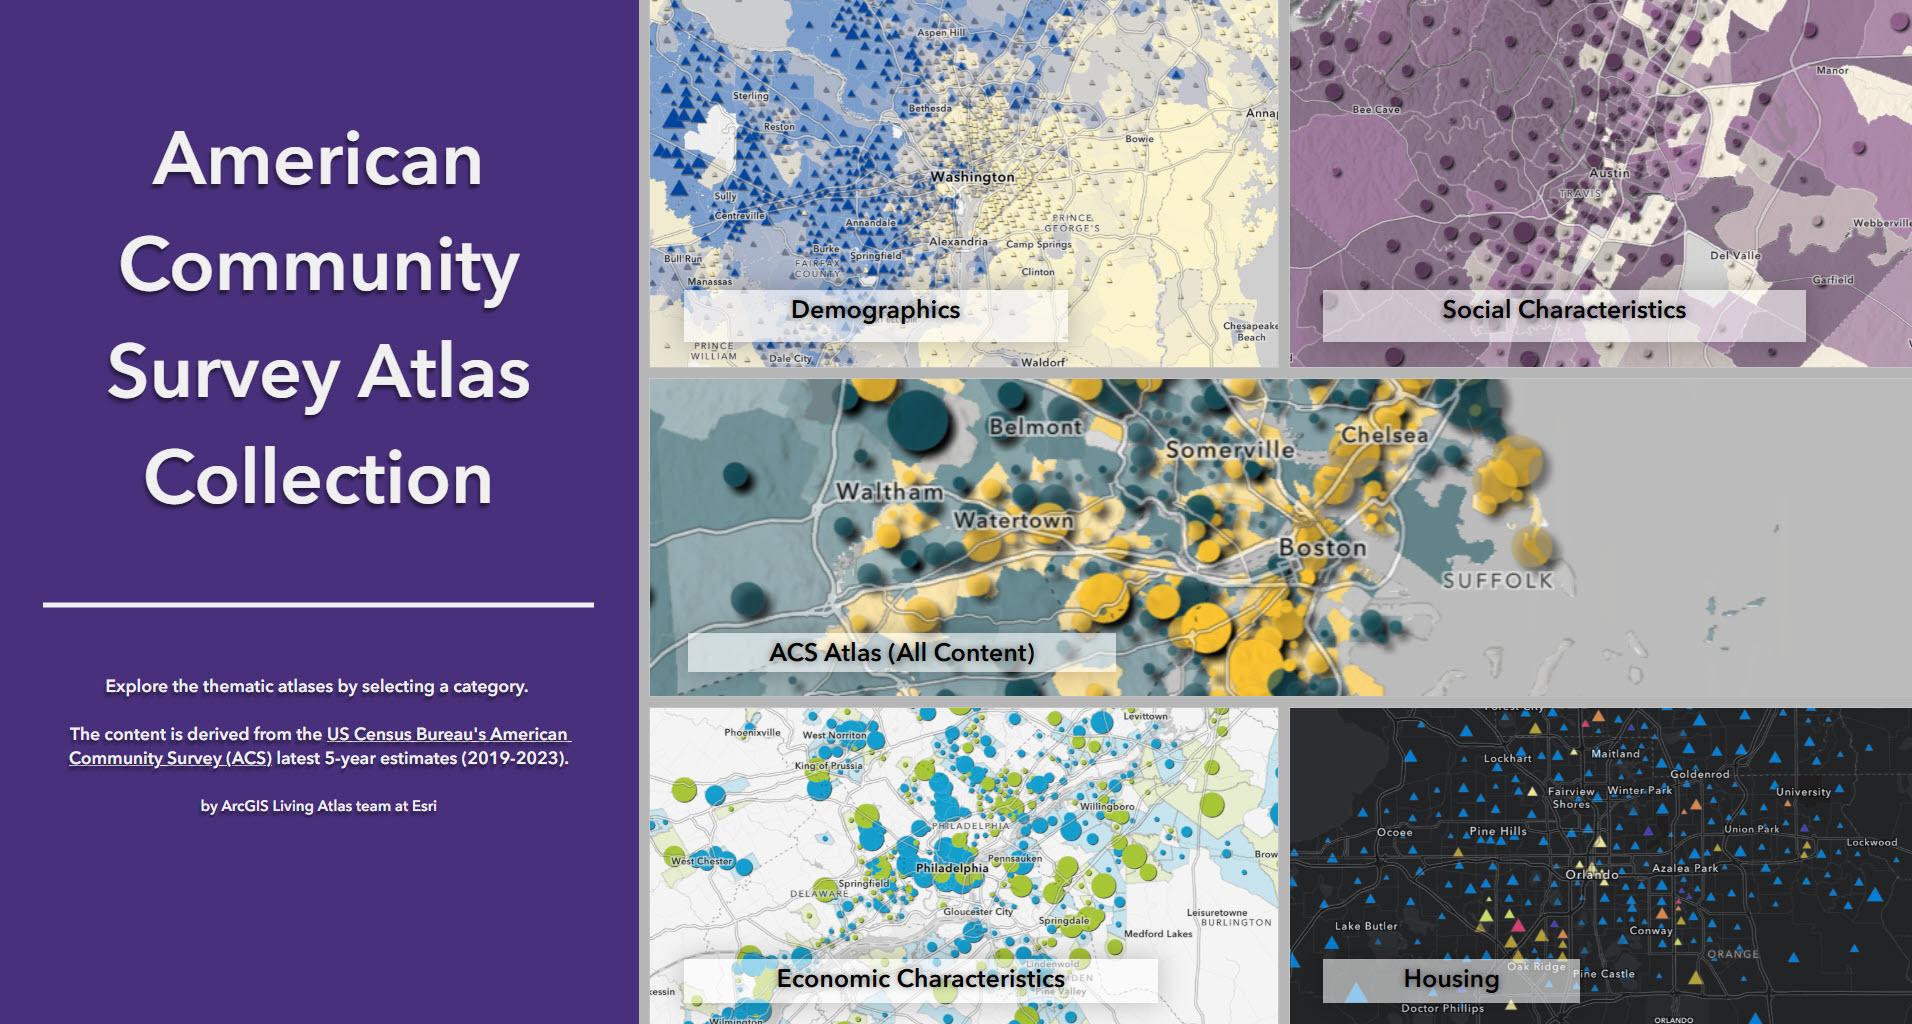
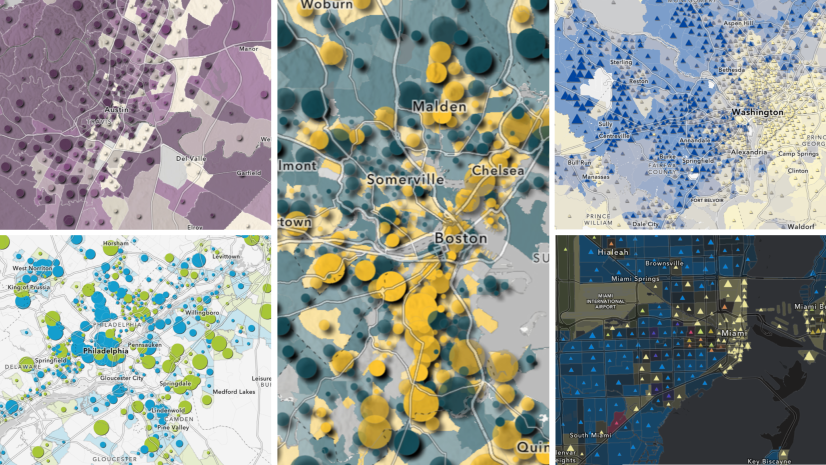
We also maintain an Atlas of these maps and layers. Explore the Atlas to see examples of the types of policy topics these layers can answer. Also, explore how these maps take advantage of numerous capabilities in Map Viewer including cartographic effects, informative pop-ups, blend modes, and more.

Article Discussion: