The 2018-2022 American Community Survey (ACS) five-year estimates are now available within ArcGIS Living Atlas. These ready-to-use layers empower people to instantly begin to explore, map, analyze, and download the data at state, county, and tract levels. Having these layers in ArcGIS Living Atlas for free saves GIS users many hours or even days of download and data processing time.
The Census ACS enables local officials, businesses, and researchers to understand what’s taking place in their communities and helps community programs allocate resources. Many federal agencies are required to use American Community Survey (ACS) data, and many non-profits rely on ACS data when applying for grants for their operations and decision-making, so access to the latest available data is critical. Census ACS data is used by everyone from regional planners and program administrators to entrepreneurs and big companies looking for their next location to set up shop, something that can lead to more local jobs.
Since 2018, the ArcGIS Living Atlas Policy Mapping team provides to the GIS community a set of free layers that contain a wealth of data from the U.S. Census Bureau’s American Community Survey (ACS). On December 7th, 2023, Census released its updated five-year estimates (2018-2022). Within days of that release, the Policy Mapping team updated the ACS layers already available in Living Atlas with the newest figures. Maps and apps that already use these layers will automatically reflect the most recent Census ACS data.
Access the Latest Census ACS Data
The Census ACS layers in Living Atlas cover a wide range of topics on population, income, education, health insurance, language, race and ethnicity, and more. These layers contain data for states, counties, and census tracts. More than 100 layers are available, each focusing on a specific topic. Each topic’s layer is hosted as both boundaries and centroids for your spatial analysis, mapping, charting, and visualization. These layers are free to use and can be downloaded to your local drive as needed. Each layer already shows an interesting subject on the map, with an informative pop-up so that you can immediately see important patterns anywhere within the U.S. and Puerto Rico. You can also easily use the layers to create your own customized web maps and applications to tell an endless number of stories about the population or housing in your area.

Additional benefits to these layers:
- They are sourced directly from the U.S. Census Bureau API.
- Data undergoes rigorous QA checks at each step, comparing every value in every layer to the source.
- Source table names are documented.
- The original Census field names are used throughout.
- The boundaries are trimmed along coastlines, lakes, and major rivers to enable cartographically pleasing maps of Census data.
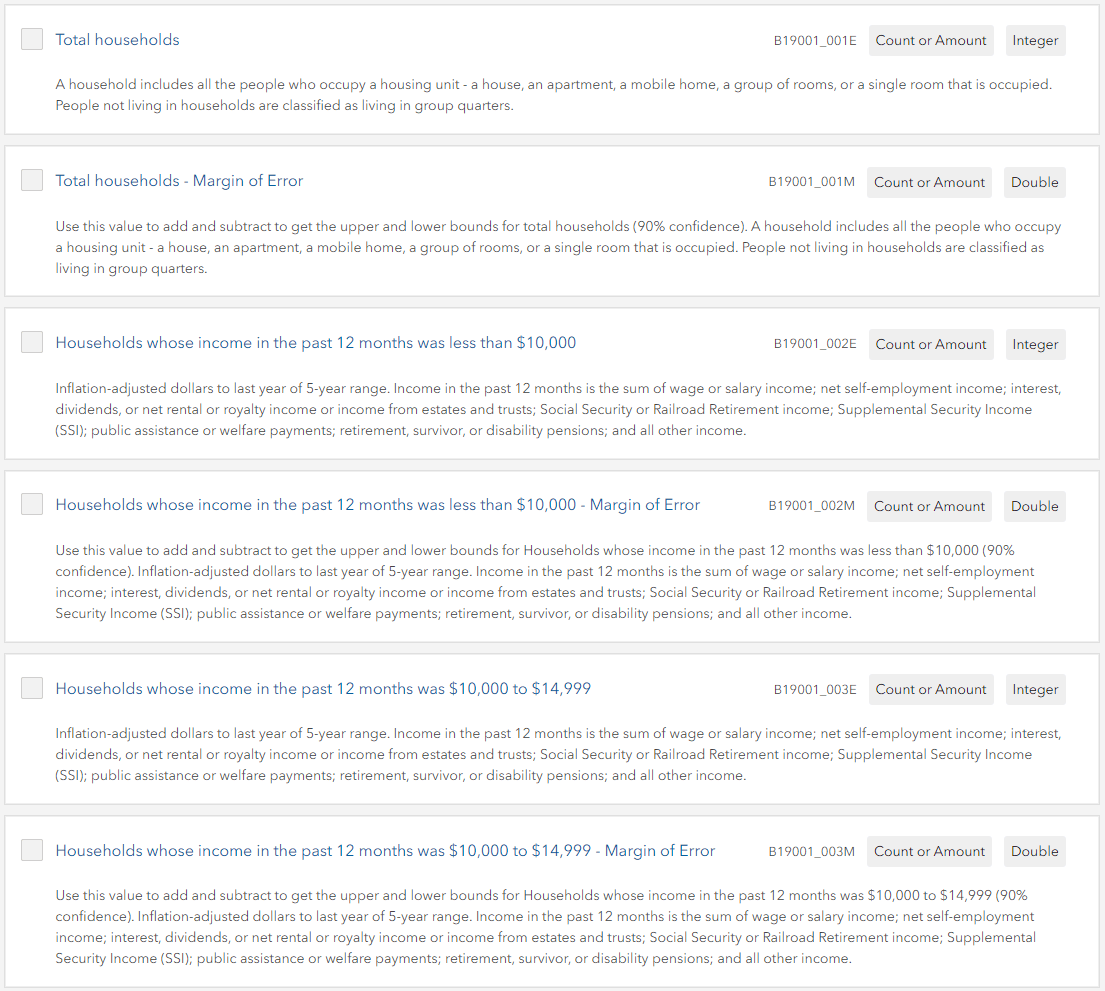
- Additional attributes are already calculated for your convenience, such as percentages and their related margins of error.
- Each field is fully documented with a human-readable field alias and a long field description that explains what the field is. This information is sourced directly from Census metadata documents. By adding this information directly into the service, all GIS users have access to it from within ArcGIS products and can know what a field means without having to go find a metadata document.
Layer Enhancements and Changes
Census Attribute Availability:
We added a layer called Specific Asian Groups a few years ago enabling users to map groups such as Filipino, Korean, and Asian Indian. This year, Census has restructured Table B02018 to include an additional five groups: Mien, Singaporean, Sikh, Kazakh, and Uzbek. The entire table has been restructured, therefore when you map groups/attributes that were available previously, their field name will change. We suggest reviewing and updating any maps using this layer to reflect the new fields.
Census Boundary Changes:
There is an additional geographic change for the state of Connecticut, rather than a data content change. Connecticut has worked with the Census Bureau to better align their counties to their regional planning entities. This allows the state to better coordinate activities and services for their constituents. Connecticut counties (known locally as “planning regions”) went from 8 to 9 total. All Connecticut counties and all tracts within these new counties have a new FIPS code whose first five digits reflect the new county. For those of you who are familiar with Connecticut, your maps will look different. If you have any filters or queries on the FIPS or NAME fields, they will need to be updated with the new data. However, your maps using Living Atlas layers will have the most updated boundaries and data values.
Enhancements Just Released
- New data – The layers now contain the most current 5-year estimates offered by the U.S. Census Bureau. They now show 2018-2022 vintage estimates.
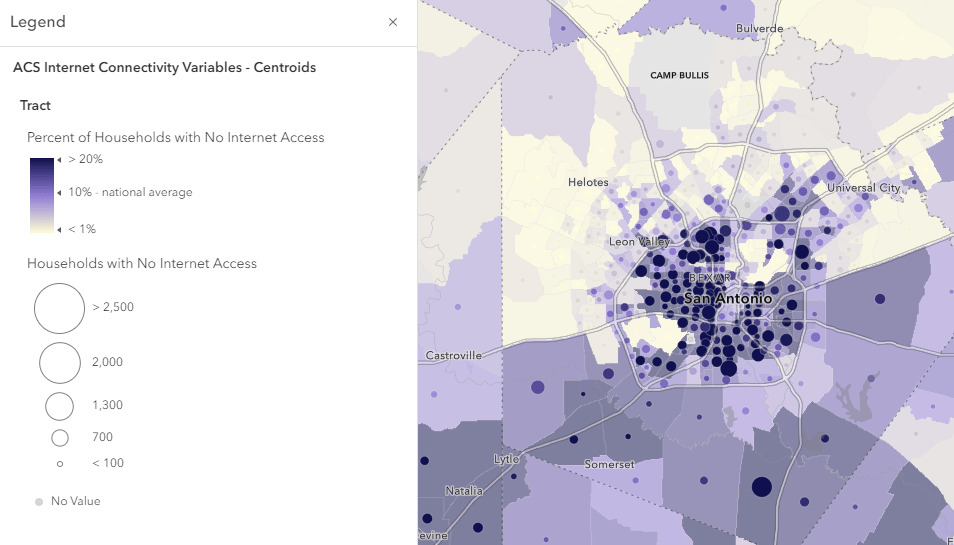
- Updated cartography – Many of the layers had their cartography adjusted to highlight the newest national rate of the attribute being mapped. For layers with this update, the legend clearly states the national figure, helping create reference for the map reader.
- New boundaries – The boundaries layers always reflect the current TIGER boundaries that match the newest Census ACS figures. In this update, the 2022 TIGER boundaries are used in the layers. 2020 areal hydrography sourced from Census was used to shoreline polygons near the ocean, Great Lakes and selected other water bodies.
Using these layers today
The American Community Survey (ACS) helps local officials, community leaders, and businesses understand the changes taking place in their communities. The ACS layers in Living Atlas provide many of the popular variables directly within the ArcGIS platform. Being able to access these brand-new data values directly within Living Atlas makes it easy to start understanding the changes taking place in your community or areas of interest through maps and further analysis.
Find the layers in ArcGIS Online and ArcGIS Pro:
Learn where to find these layers and start using them within your mapping and analysis workflows. Check out this story map to learn how.
Get started:
Learn how to make a map about your community in four easy steps in this blog. You’ll have your own web map of your area in minutes!
Update your existing ACS maps:
When the new ACS figures are released by the Census and updated in Living Atlas, it’s time for you to check your web maps that use one of these ACS layers to see where you need to make updates to your map’s symbology and pop-ups. If you are using an ACS layer from Living Atlas and have not modified it at all, then you will appreciate knowing that your layer has already been updated, with new data, updated symbology, and updated pop-ups.
If you are using an ACS layer from Living Atlas and have modified its symbology, popups, etc., you’ll appreciate that the data has been updated, but your symbology and popups kept your modifications. To confirm, check out the layer properties in Map Viewer to see what properties are stored in the source layer or stored in the web map. The attribute data in the latest five-year ACS layers changes each December and is automatically reflected in existing maps. After this release, verify that your map’s symbology breakpoints and popups show what you intend them to show with the updated data.
Important Changes to Note in Your Maps:
Changes may be particularly noticeable for any currency values such as earnings, income, median contract rent, and median home value maps. See this blog on inflation to understand how your maps may be affected.
For maps of Connecticut or maps using Specific Asian Groups layers, please see the detailed change notes above under Layer Enhancements and Changes.
Understand and use Margins of Error:
We created a Learn Path full of resources that walk through different ways to incorporate margins of error (MOEs) into maps. This lightweight app helps you get a quick sense of how reliable estimates are for each tract, and how they become more reliable as you aggregate tracts using the boundary of a neighborhood or other shape. Check out this blog to learn more.


Article Discussion: