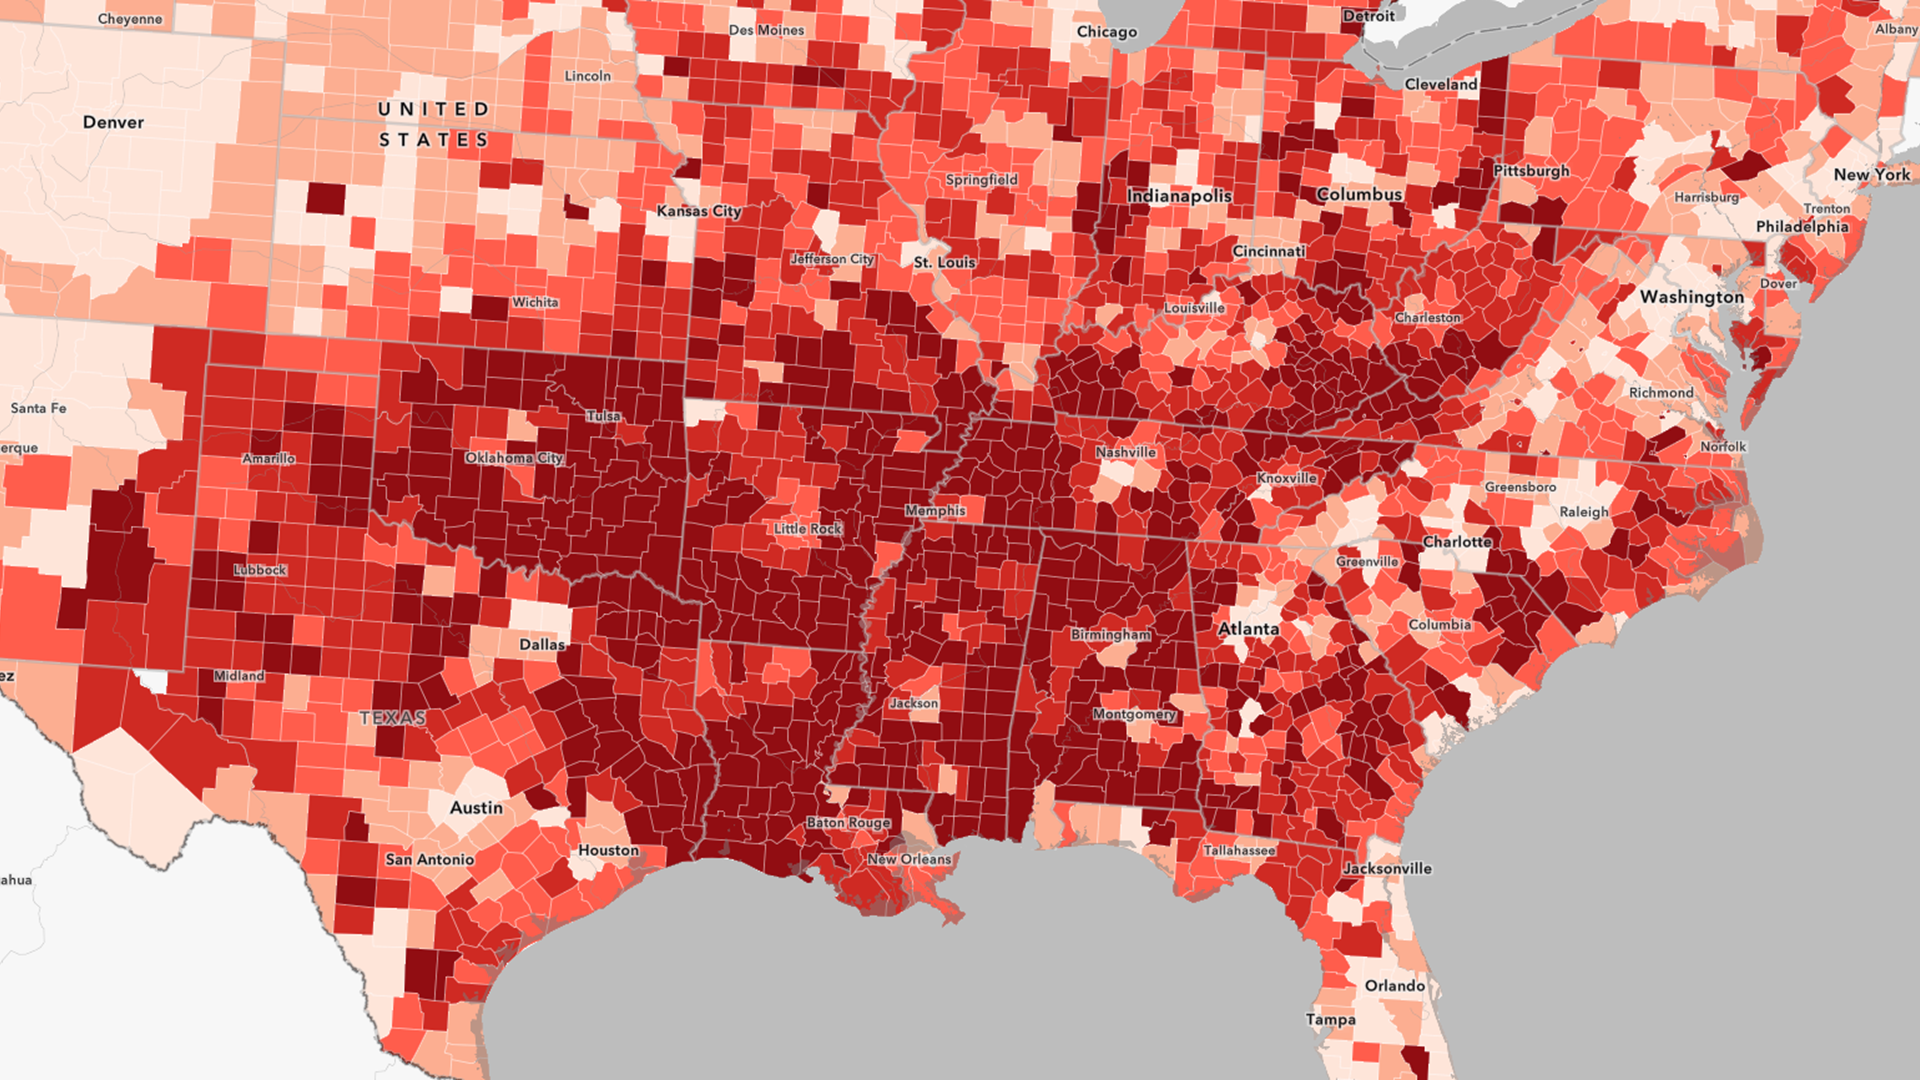
Cardiovascular disease is a serious concern for health professionals. One person dies every 34 seconds from cardiovascular disease, and cardiovascular disease was responsible for 1 in every 3 deaths in 2023 (CDC heart disease fact sheet). The cost of healthcare services and medications is in the hundreds of billions. The regional patterns in cardiovascular disease risk are strong. Whether you work in the treatment and healthcare space, or the prevention space, you can use high-quality data and maps for informing operational decisions, measuring progress, and evaluating programs.
New feature layers
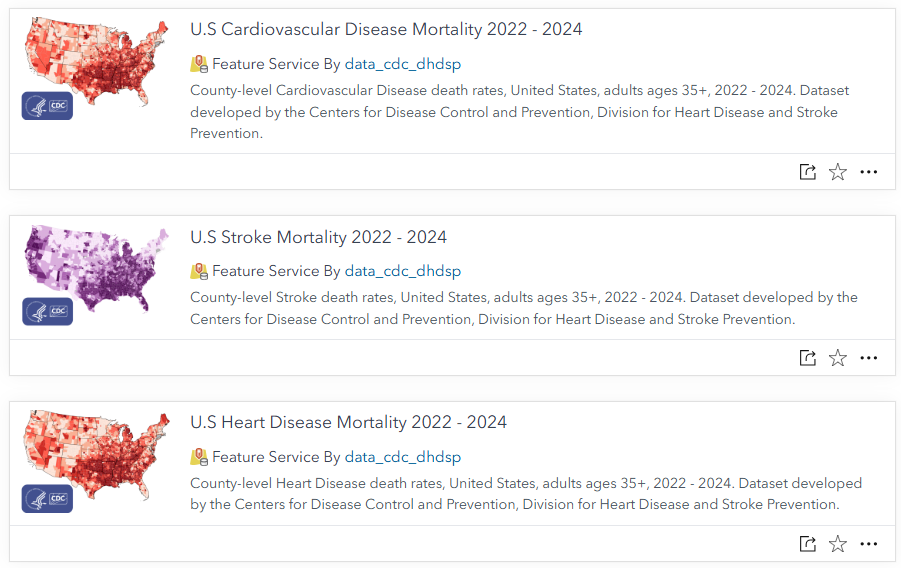
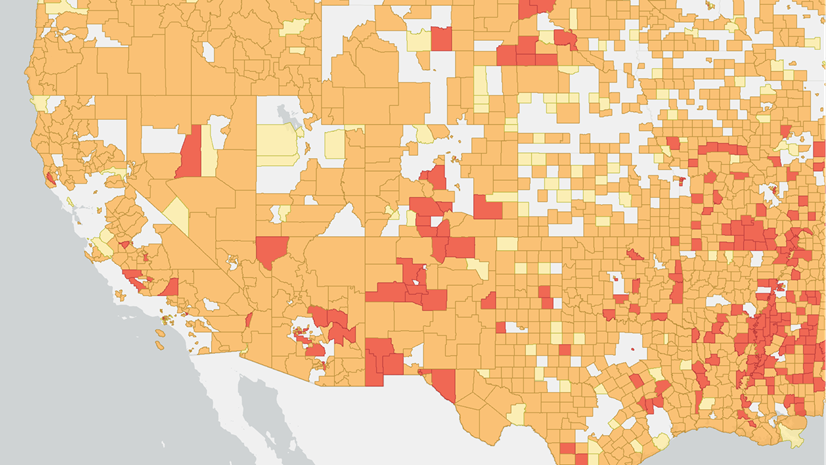
The Centers for Disease Control’s Division for Heart Disease and Stroke Prevention has provided important new feature layers for mortality from Cardiovascular Disease, Heart Disease, and Stroke. These layers track death rates for adults age 35+ at the county level. These new layers use mortality data from 2022-2024. Pooling three years of mortality data enables reliable county-level rates by sex, age group, and race/ethnicity.
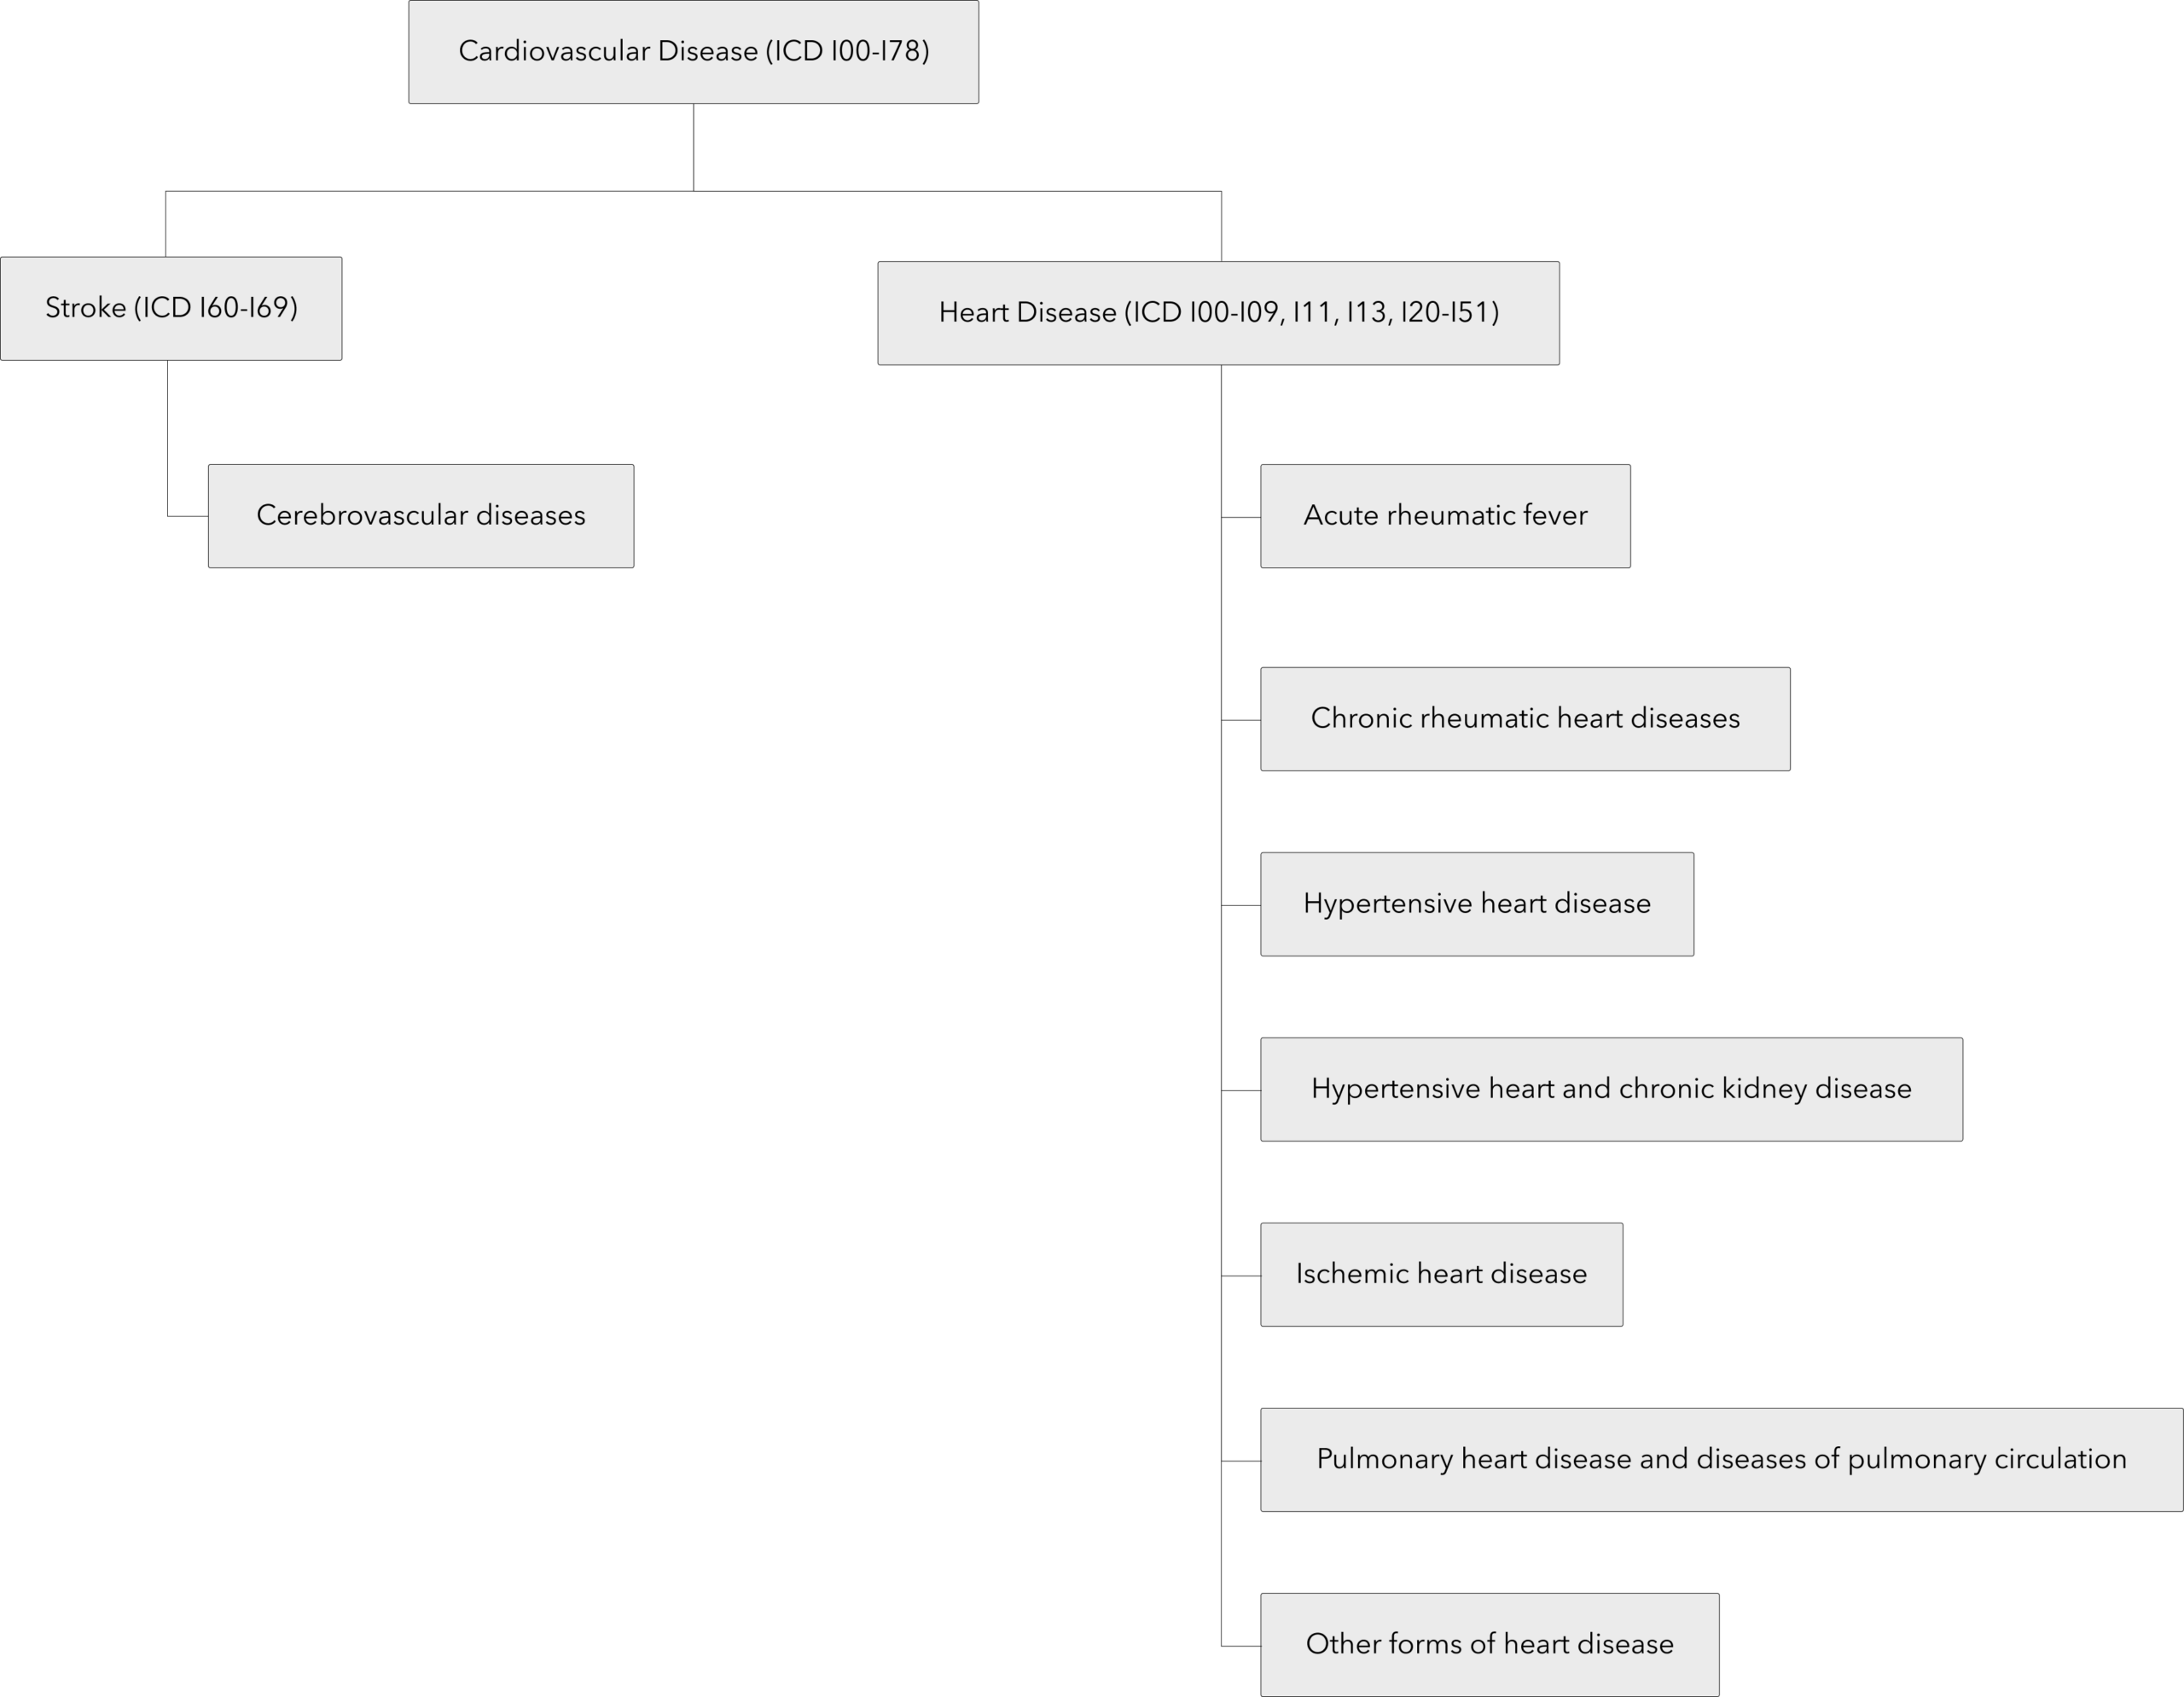
The International Classification of Diseases (ICD) provides a standardized coding system for death statistics throughout the world. It uses a hierarchical structure that nests specific individual conditions into broad groups. In this case, cardiovascular disease mortality is the broadest condition, encompassing International Classification of Diseases (ICD) codes I00-I78. Within the broad group of cardiovascular disease is stroke mortality for cerebrovascular diseases (ICD codes I60-I69), and heart disease mortality for acute & chronic rheumatic conditions, hypertension, and pulmonary & ischemic heart diseases (ICD Codes I00-I09, I11, I13, I20-I51).
Questions you can answer
Use these layers in maps that answer questions important to health monitoring, such as,
- Which age-sex-racial group is at the highest risk for cardiovascular disease in my county? Is it the same or different from the group at highest risk in my state?
- How does cardiovascular disease mortality differ between the East and West coasts?
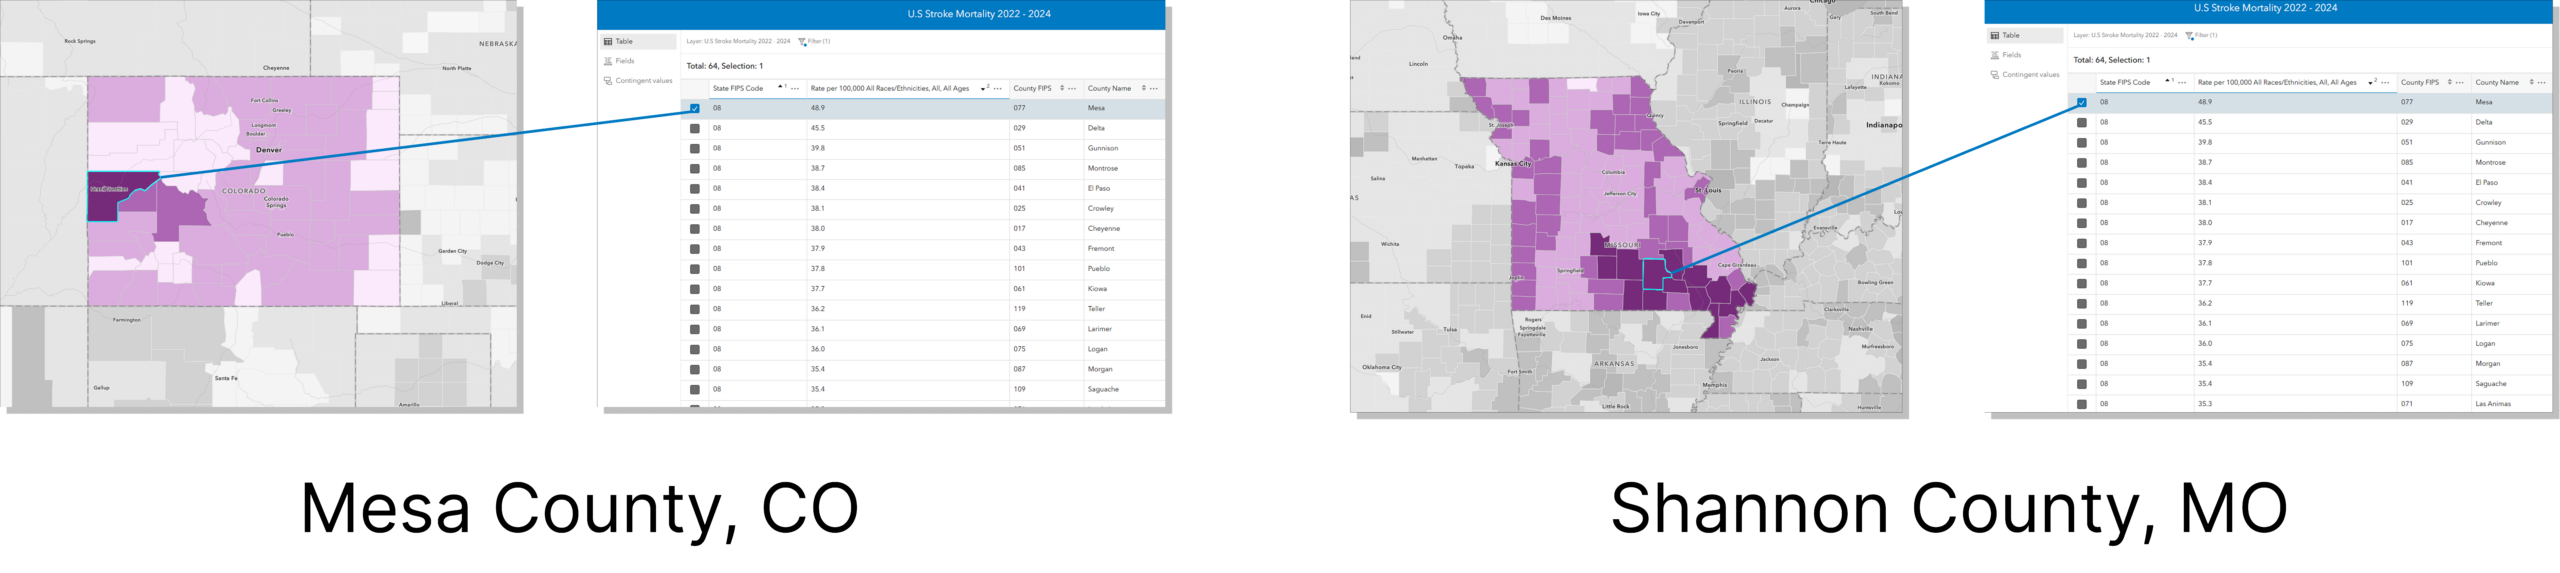
- What county within my state has the highest stroke mortality?
Combine with other datasets
These layers include state and county FIPS codes for convenient joining to other county-level datasets. Other layers in Living Atlas layers of the American Community Survey (ACS) can provide broader socioeconomic context, such as ACS Poverty Status, ACS Health Insurance Coverage, and ACS Context for Senior Well-Being.
These layers can be compared with Heart Disease Mortality and Stroke Mortality layers from the previous vintage (2021-2023) to monitor trends over time. Layers are available in Living Atlas from even older vintages. As the ICD codes get updated with advances in diagnoses, users should pay specific attention to the ICD code versions specified in the layer’s description to ensure direct comparisons. Crosswalks are available to help data analysts compare ICD-9 to ICD-10, as well as guidance for comparing between revisions.
We also encourage you to combine the cardiovascular layers with datasets from your own organization. Point locations such as facilities, sites, or establishments can be spatially joined or intersected with the polygons in the layers from CDC for more insights. Spatial analyses–such as those used to determine Spatial Autocorrelation (Global Moran’s I)–can reveal broader relationships the counties of a study area.
Cardiovascular disease risk demonstrates important geographical patterns. It is interconnected with obesogenic environments that have unsafe built environments, few recreational spaces, transportation infrastructure that favors driving over active commuting, low-quality grocery stores and restaurants, and more (Statement from American Heart Association).
Thank you, CDC
The geographic community is fortunate to have these datasets provided by the CDC, we thank them for their continued efforts in sharing health data publicly. CDC is one of many contributors to ArcGIS Living Atlas. Explore ArcGIS Living Atlas to see the largest collection of geographic content available to support your work.




Article Discussion: