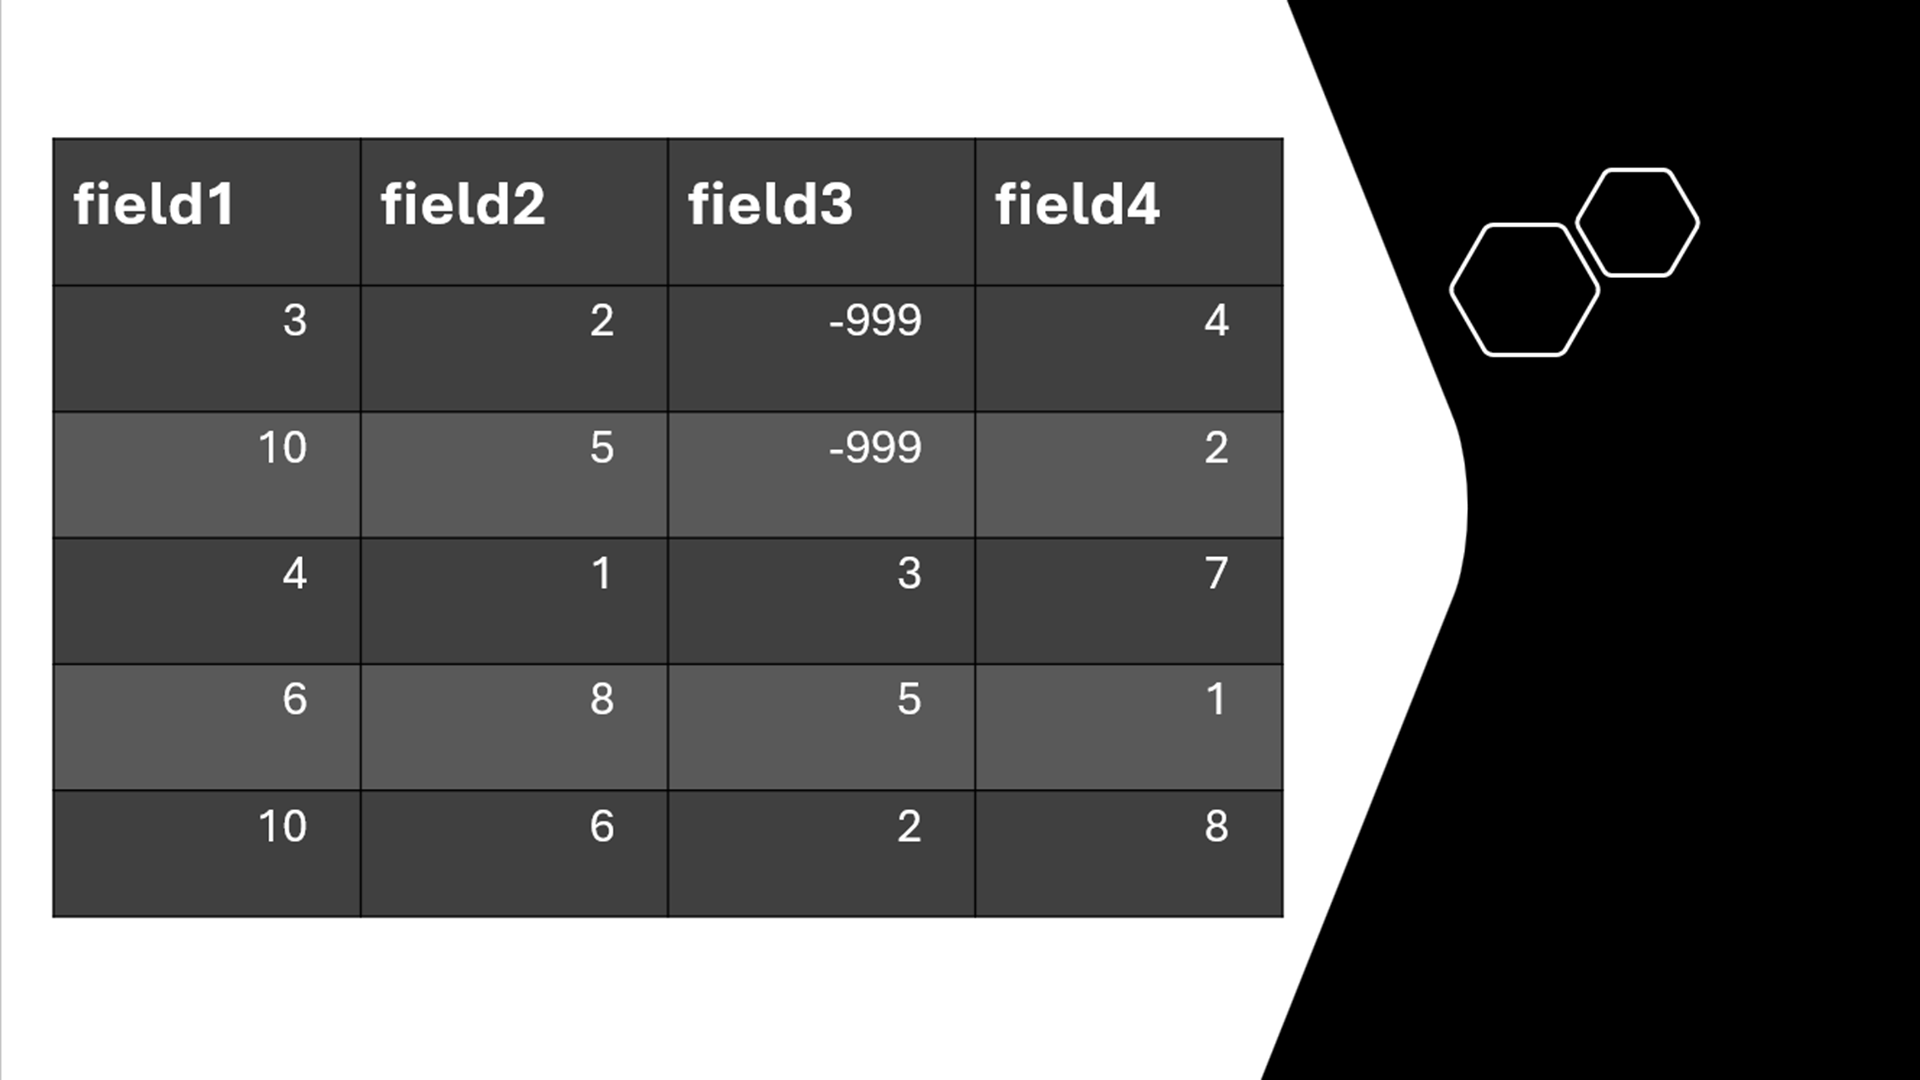
Working with a dataset that contains 999, -999, 888, or other strange values that represent non-numeric constructs is common when prepping GIS data. Often these values don’t represent the integer value, but rather many different reasons for missing data points. “Not sure” is categorically different from “decline to state,” which is categorically different from Not Applicable, or a particular geography never even being included in the survey from the start.
Data evaluation
These different flavors of missing data are often represented by specific integer values in a numeric data field that are (hopefully) referenced in a Data Dictionary or Codebook. These differences are important to understand during the source evaluation phase of working with a new dataset. There are often cultural, age, and gender differences in who answers “don’t know” vs. who skips questions, vs. who even answers surveys in the first place (Sage Journal study). In general, missing data can point to the underlying data quality, and how suitable this dataset will be to answer your specific questions.
Calculating statistics
Once you’ve determined that this dataset is fit for use for your purposes, you will have to handle these non-numeric values somehow. When summarizing these fields to find the average or median, these extreme values will yield your initial meaningless results.
For example, this Wind Turbines layer has a field called “Project Capacity (MV)” that has a minimum of -9999, a clue that this field might need to be handled with care. (Negative megawatts would be quite strange, after all.) Descriptive statistics such as mean, median, and standard deviation here are not going to be valid until we do a bit of data cleaning.
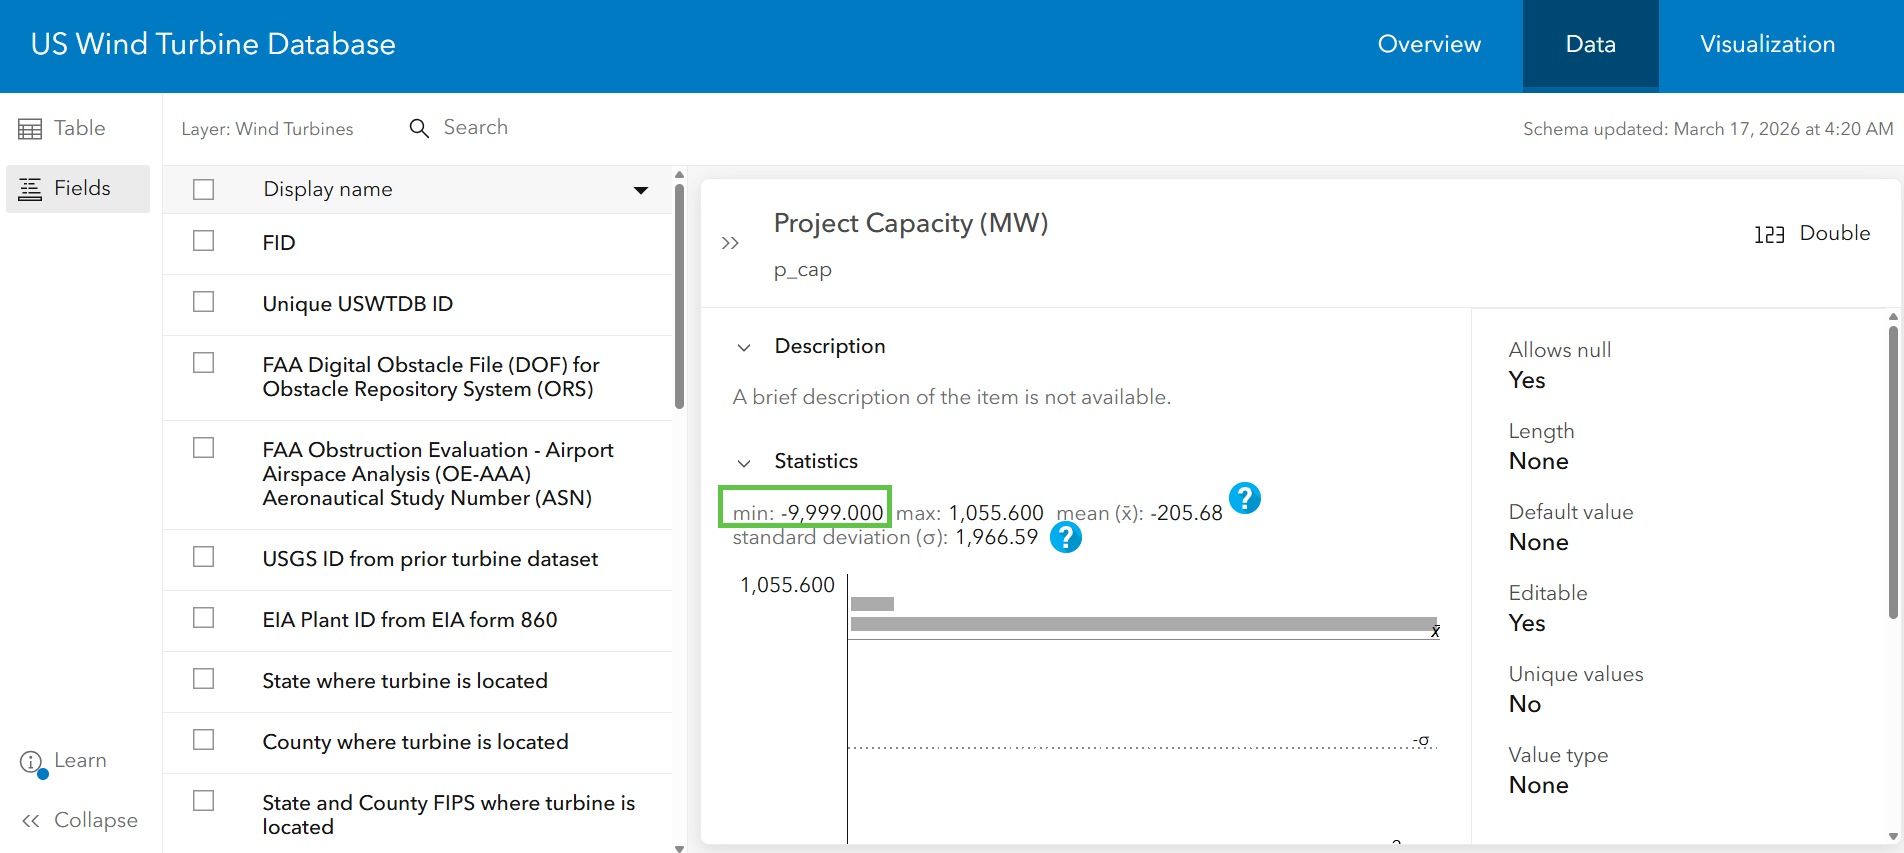
Symbolizing on this field would also be problematic.
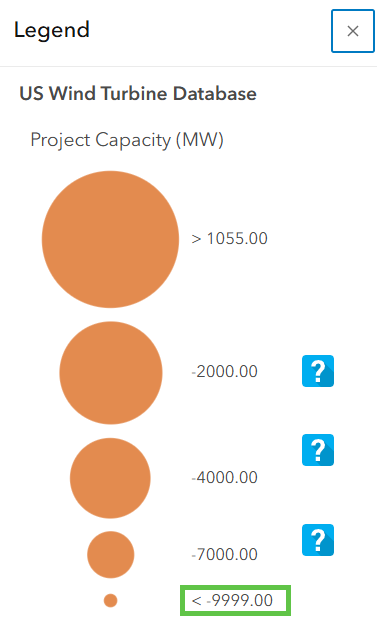
How can we convert all these values to null? Let’s explore the many ways to do this throughout ArcGIS. We’ll start with the simple ways and then end with more intermediate/advanced methods.
Method 1: Apply a filter or definition query
Applying a filter in ArcGIS Online or a definition query in ArcGIS Pro is a great, light-weight way to subset your records to include ones that meet specific criteria. Filter by attribute with a simple expression. In our Wind Turbines example, the expression is: Project Capacity is at least 0.
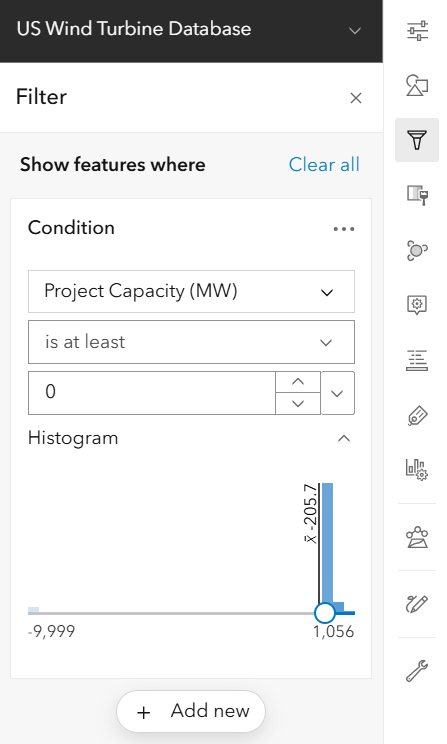
This allows you to symbolize, visualize, and summarize the subset of the data that does not contain the non-numeric values.
On the flip side, you can apply a filter to only display features that have values of -9999, in order to see if there are obvious spatial patterns in missing data. This can be helpful during the data exploration / source evaluation phase.
By applying a filter, you are not changing the underlying attribute table. Even if you don’t own the data layer, you can save the filter to your web map and proceed.
Method 2: Use Arcade to handle these values on the fly
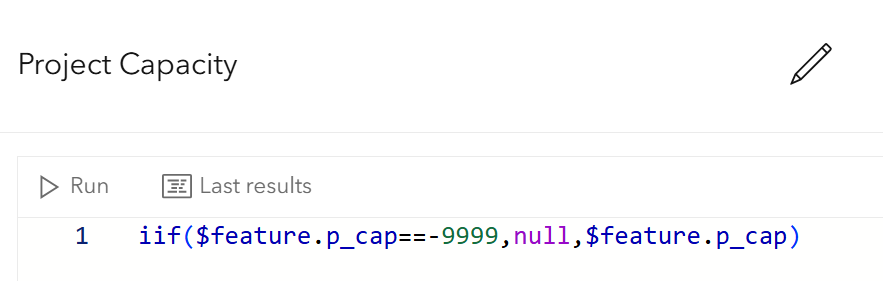
Similar to Method 1, using an if-statement in Arcade to handle these values will allow you to symbolize properly, even if you don’t own the layer. This can be advantageous if the data values are updated frequently.
Method 3: Use Calculate Field
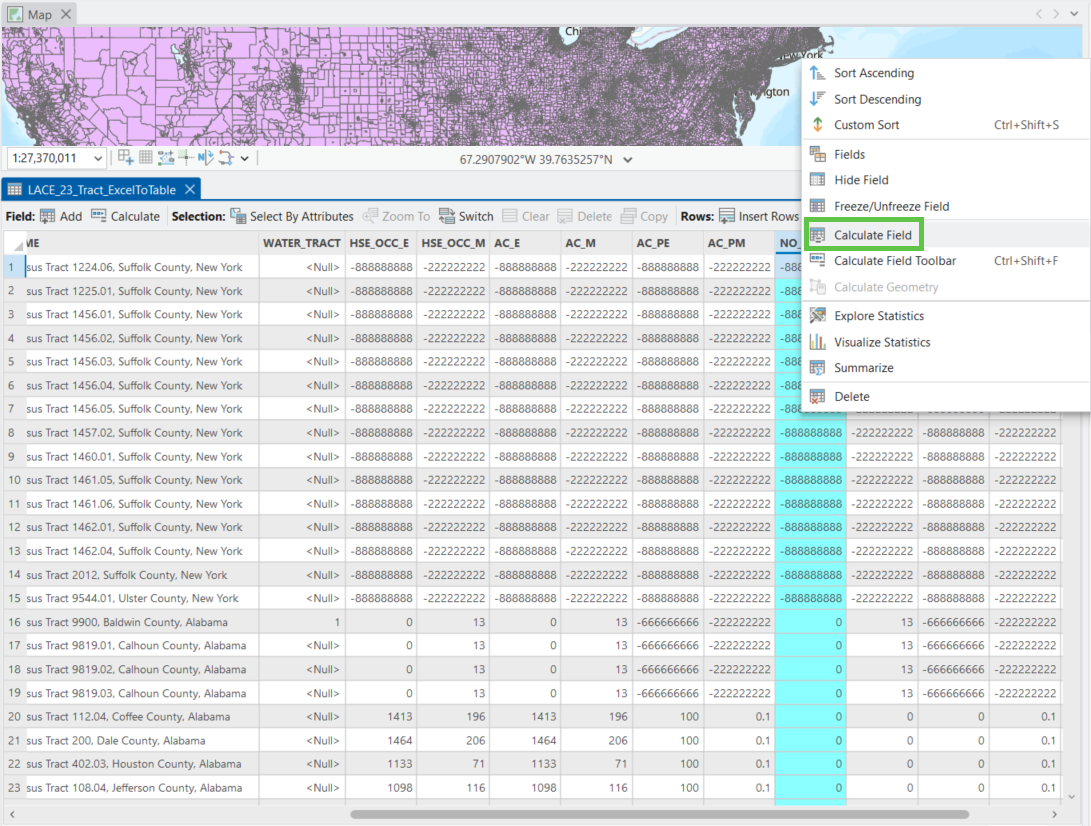
If you own the layer, you can use Calculate Field in both ArcGIS Online and ArcGIS Pro to overwrite any values with null. This does permanently change the data table, which can be advantageous if you’re preparing a layer for others to use.
Another advantage of using Calculate Field is that you can deal with multiple values at once. For example, the Local Air Conditioning Estimates dataset contains -88888888, -66666666, -22222222, and more in the original source. Each denote different reasons that data is missing. As such, some need to be set to null, and others need to be set to zero. I can handle multiple values in one expression while calculating the field.
Method 4: Use Find and Replace in ArcGIS Pro
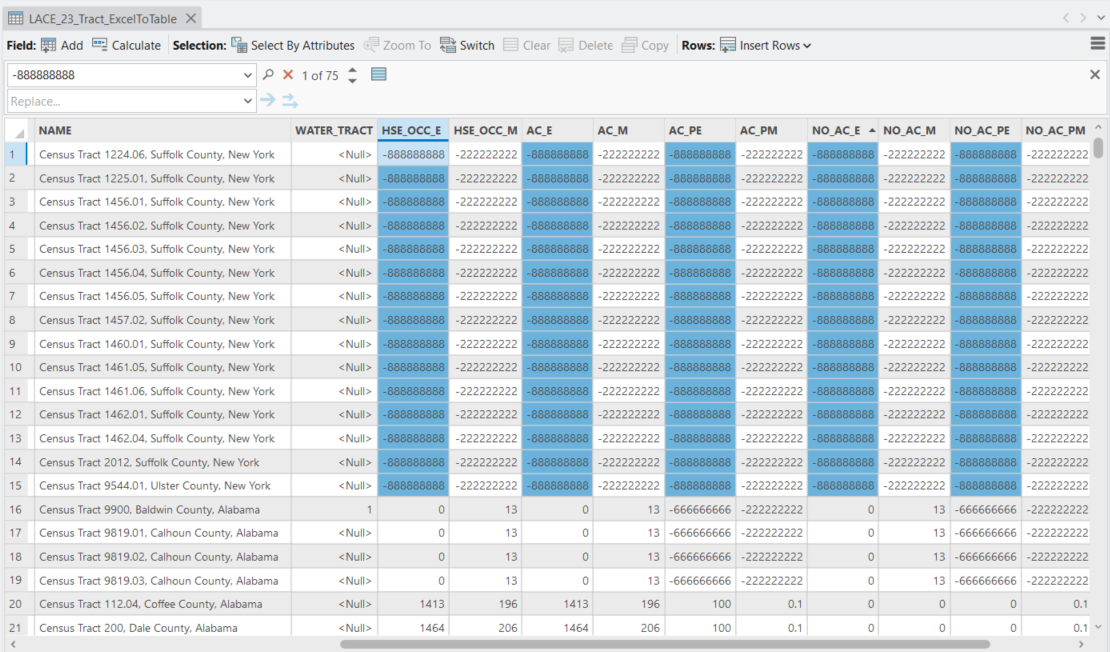
If the non-integer values are consistent across multiple fields, it can be faster to do a bulk Find and Replace for the entire table in ArcGIS Pro. Much like in Microsoft Excel, it will find every cell that matches a specific value, and will search across multiple fields.
Method 5: Handle these values programmatically at data ingest
For large datasets with dozens of attribute tables, multiple levels of geography, or multiple years, you can handle these types of values programmatically upon ingesting the data, and take care of these values from the start.
This is what we do for the layers in Living Atlas containing data from U.S. Census Bureau’s American Community Survey. Census has documentation about all the different meanings behind many different values. We set -555555555 to zero and all other negative numbers, “-“, and “*” to null in our scripted process as soon as we extract it from the API. You can do something similar using ArcGIS Data Pipelines, ArcGIS Notebooks, and stand-alone scripts.
Handling these edge-cases as soon as possible helps ensure that downstream logic and calculations won’t have errors due to these values.
Document and comment your data cleaning process
Methods 3 through 5 above create permanent changes to the raw data. The long field descriptions as well as the Item Details Page are the perfect places to document the modifications you have made.
Comments in code (Arcade, Python, etc.) as well as notes in Data Pipeline elements all provide great places to do this. This helps you out when you come back to this project in a few weeks and try to remember what you did. It also helps others trust your work and your process.
If your goal is to provide the data as pure, unadulterated, and high-fidelity to the original source (such as the Wind Turbines layer), then providing a link in the Item Details Page to the original source is necessary so that others can research the meanings of these values.
More advanced options
You aren’t stuck with nulls or zeros. Many sophisticated imputation techniques exist in the field of statistics, social sciences, and data science. These techniques generally involve finding similar data points other (non-null) attributes, and then using their information to create an informed data estimate.
One geoprocessing tool for this is called Fill Missing Values. This tool allows you to estimate missing values based on spatial neighbors, time neighbors, or other statistics within your dataset.
Share your methods
These are just a few of the many ways to handle these types of values. Have you ever had a GIS project that involved handling strange numeric values as part of your data cleaning process? How did you approach it? Let us know in Esri Community.






Article Discussion: