For many years, Esri has provided a series of live feeds to help enhance situational awareness apps. ArcGIS Living Atlas Live Feeds are a collection of ready-to-use services that can provide current information on weather and other information that can mitigate disasters.
Published using the Aggregated Live Feeds Methodology, these are used by the Esri Disaster Response Program, included in the Emergency Management Operations Solution, and leveraged in many applications across the user community. The Live Feeds are feature services containing data from authoritative sources, including NOAA, USGS, NIFC and more. For the complete list and more details, see Putting the “live” in Living Atlas of the World or view all Living Atlas live feeds layers.
ArcGIS Live Feeds Status page
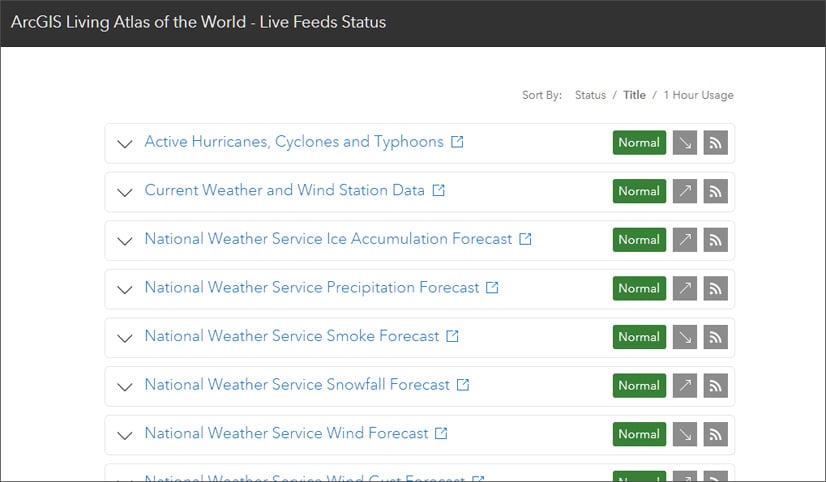
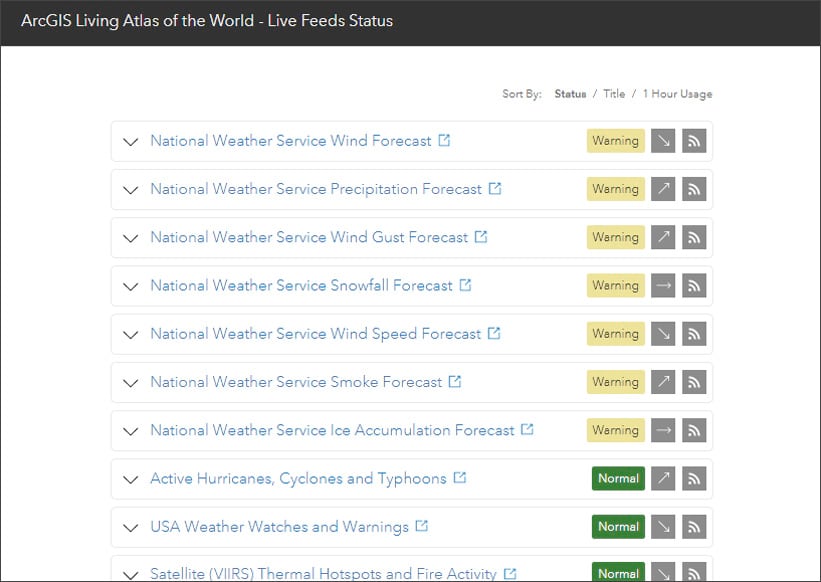
In an effort to provide more visibility and transparency for the current status of these feeds, the Living Atlas team has developed the new Live Feeds Status page. The page displays a summarized view of each service showing the current status and usage trend, along with an RSS link to subscribe to notifications.

If there are any changes from normal, the displayed status will change for easy identification.

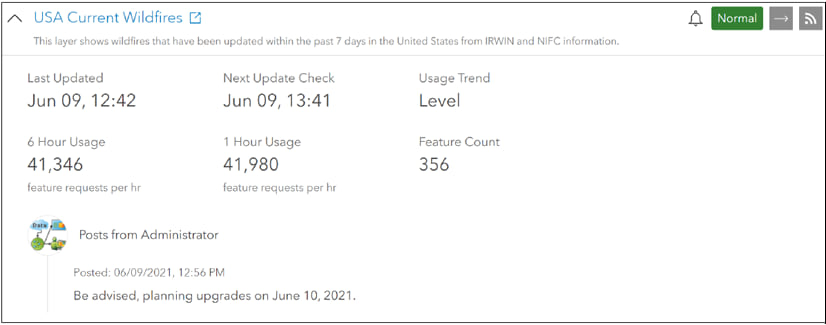
Click the down arrow on the left of any feed to display additional details on the service status, including the time of last update, when a check for updates will occur next, usage and usage trends, number of features, and any messages from the service administrators.

Status page details
A companion Live Feeds Status Page Technical Description provides additional details as to the information displayed and methodology.
Feed information
The Live Feed Status page displays a list of selected live feeds, which can be sorted by status, title, or usage. Each feed displays the current status, usage trend, and an RSS link so you can subscribe to notifications in your favorite RSS reader or create alerts using Webhooks. There is also a link to open the item details for each feed. Hover over any element to learn more.

Status
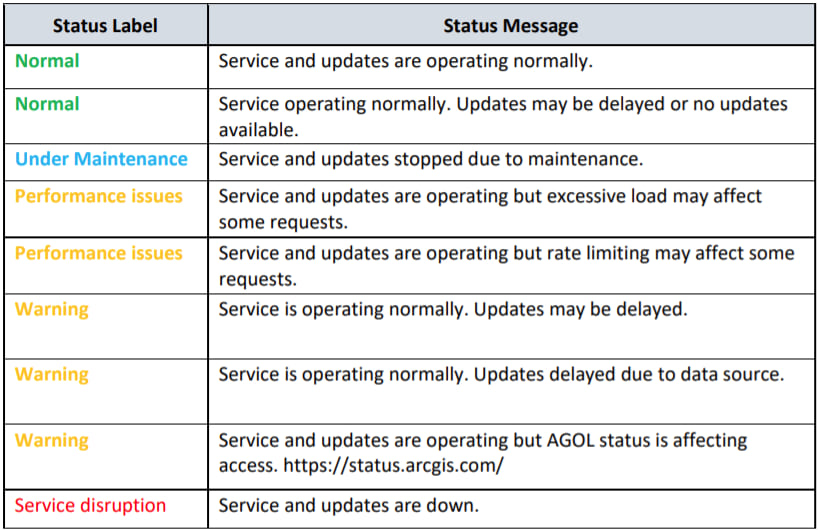
The status page includes a color-coded indicator (green, yellow, or red) that includes a status description. The possible labels and their descriptions are shown below.

Status details
Click the down arrow to display additional service details.

The details include the following:
Last Updated: Date and time of last update to the live feed service data.
Next Update Check: Date and time of next expected check for data updates.
Usage Trend: Indicates whether the 1-hour usage is increasing, decreasing, or remaining relatively unchanged, compared to the average 6-hour usage. Direction of change is based on +/- 5% difference between 1 hour and average 6-hour values.
6 Hour Usage: Average feature requests for the prior 6-hour time period.
1 Hour Usage: Feature requests for the prior 1-hour time period.
Feature Count: Number of features contained within the feature service layer(s).
Posts from Administrator: Additional status information from the system administrator that may be available to convey additional details related to the status or planned events that may impact service availability or performance.
This information is only visible if an administrator post is available for the selected item and is indicated by the presence of a bell icon adjacent to the status label.
Summary
The ArcGIS Living Atlas Live Feeds Status page is intended to provide more visibility and transparency into these authoritative services. Bookmark the page, or subscribe using RSS, to monitor service status.
These services are an important asset in viewing current conditions and gaining situational awareness and are of interest to not only the disaster response and emergency management communities, but any organization or community wanting to view current conditions.


Commenting is not enabled for this article.