There are many use-cases for data on languages spoken in the United States. Here are just a few:
- Retail marketing and advertising
- Entertainment markets for sports, music, radio, and other media
- Elections
- School districts
- Service-providing organizations
Did you know that ArcGIS Living Atlas contains multiple layers on languages spoken in the United States? With so many options, it can be confusing to know which layers, or which attributes, are most suited for your specific purpose. Let’s explore the different nuances in all the available content out there.
Content tour of layers about languages spoken
Layer: ACS Specific Language Spoken by English Ability (Latest)
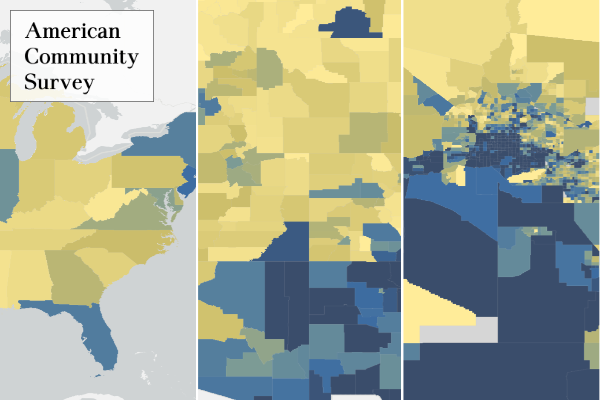
What this contains: Latest ACS data on individuals who speak popularly-spoken languages by state, county, and census tract.
Ideal for:
- Users interested in any of the following languages: Spanish, Korean, Vietnamese, Arabic
- Users interested in any of the following language groupings: French, Haitian, or Cajun; German or West Germanic languages; Russian, Polish, or other Slavic languages; Chinese including both Mandarin and Cantonese; Tagalog and Filipino
- Users interested in English ability of speakers of these languages/language groupings (both limited English ability and bilingual ability available).
Example questions this layer can answer:
- Where are Vietnamese speakers in my county?
- Where are people who speak Korean at home and also speak English very well? (People who are bilingual in English and Korean)?
Note: A Centroids version of this layer is also available. This layer is updated when the U.S. Census Bureau releases their 5-year ACS estimates.
Layer: ACS English Ability and Linguistic Isolation (Latest)
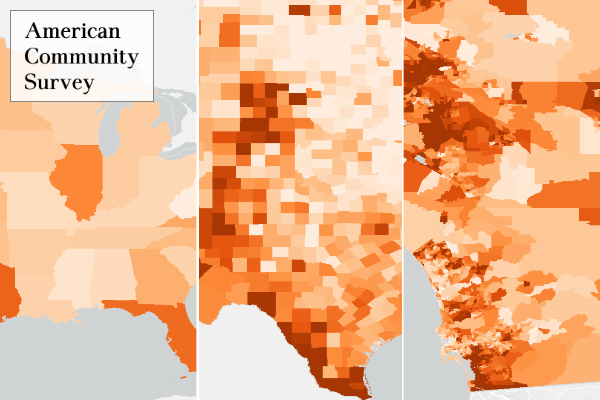
What this contains: Latest ACS data on English ability and linguistic isolation by age group (5-17, 18-64, 65 and over) by state, county, and census tract.
Ideal for:
- Users interested in populations in limited-English households, sometimes called linguistically-isolated households, in which no member 14 years old and over speaks English very well.
- Users interested in age breakdowns (5-17, 18-64, 65 and over) of individuals who have limited English ability by broad language groupings (Spanish, Indo-European languages other than Spanish, Asian and Pacific Islander languages, and other/unspecified languages).
Example questions this layer can answer:
- Which age group has the most limited-English speakers in my area?
- Where are children in linguistically-isolated households?
Note: A centroids version and a ’10-’14 version of this layer are also available. This layer is updated when the U.S. Census Bureau releases their 5-year ACS estimates.
Layer: ACS Language Spoken at Home (Latest)
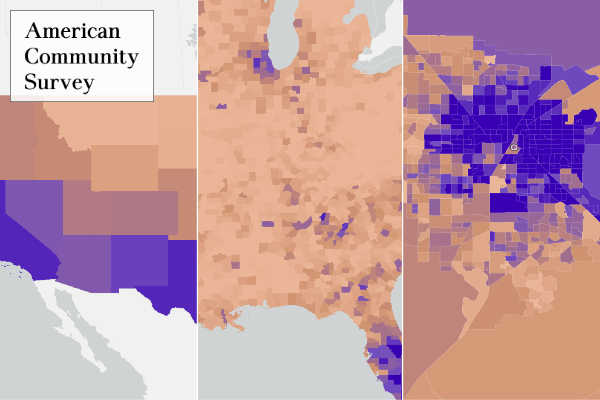
What this contains: Latest ACS data on language/language group spoken at home by age group (5-17, 18-64, 65 and over) by state, county, and census tract.
Ideal for: Users interested in a high-level count or percentage of speakers of English only, Spanish, other Indo-European languages, Asian and Pacific Islander languages, and other/unspecified languages.
Example questions this layer can answer:
- What is the percentage of English-only speakers in my area?
- What is the most common age group among Spanish speakers?
Note: A centroids version and a ’10-’14 version of this layer are also available. This layer is updated when the U.S. Census Bureau releases their 5-year ACS estimates.
Layer: Languages from American Community Survey (ACS) PUMS
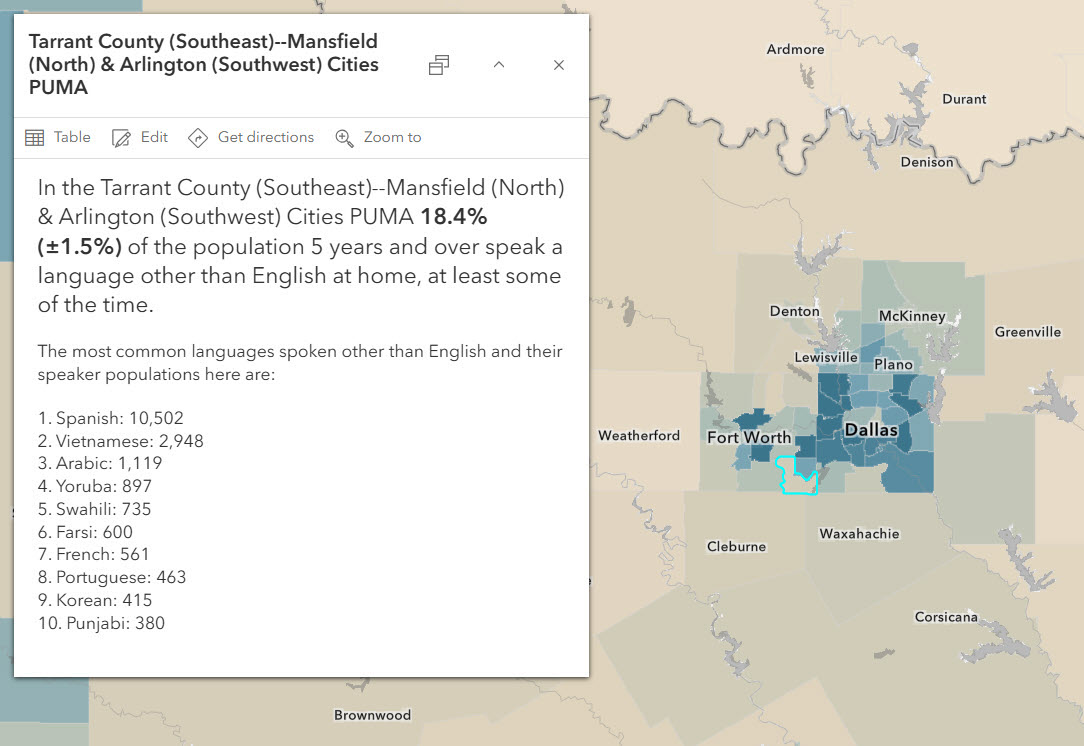
What this contains: 2019-2023 ACS data on speakers of over 100 languages by state and Public Use Microsample Area (PUMA).
Ideal for:
- Users who are interested in a specific language that is not in the ACS Summary Tables (e.g. Navajo, Hindi), and are willing to give up geographic resolution in order to get more specific language detail, as PUMAs are larger than tracts.
- Users who are interested in creating their own groupings of languages (e.g., languages from the Philippines, languages from India, languages from the Caribbean).
Example questions this layer can answer:
- How many Pennsylvania German speakers are there in the state of Ohio?
- Where are Portuguese speakers?
Margins of Error considerations
There is a large content overlap across these layers, meaning the same estimates can exist in multiple layers. For instance, the count of Spanish speakers for 2020-2024 is available in three of the layers above. If you’re seeking to minimize the margins of error, try to find a layer that contains an estimate directly from the Census Bureau’s summary tables rather than one that was summed or otherwise calculated (noted by the “calc” stub in the field name). This way you are getting the margin of error from the internal files rather than a derived margin of error, as the margins of error from the internal files are likely smaller.
Related content of interest
There are other layers within Living Atlas that contain at least one basic attribute about language spoken. We encourage you to use what makes sense for your specific topic and project.
If you’re interested in a custom boundary (not a state, county, census tract, or PUMA), there’s language data available through Geoenrichment and the Data Browser.
I know the attributes I want to use, now what?
Once you can identify the most ideal layers and attributes for your needs, you can do all the wonderful things you can do with layers in Living Atlas. Living Atlas provides content as a starting place to jumpstart your GIS workflows.
This video (~11 minutes) shows you how to use these layers in ArcGIS Online to create a map that displays the count of Vietnamese speakers with limited English ability in the Dallas area. Apply a filter to show the counties of interest. Change the attribute being symbolized, and adjust the settings to create a meaningful map. Finally, modify the pop-up to communicate what the map is showing.
Alternatively, you can start in ArcGIS Pro and incorporate these layers into your analysis and geoprocessing workflows, or create a stunning layout for print purposes.
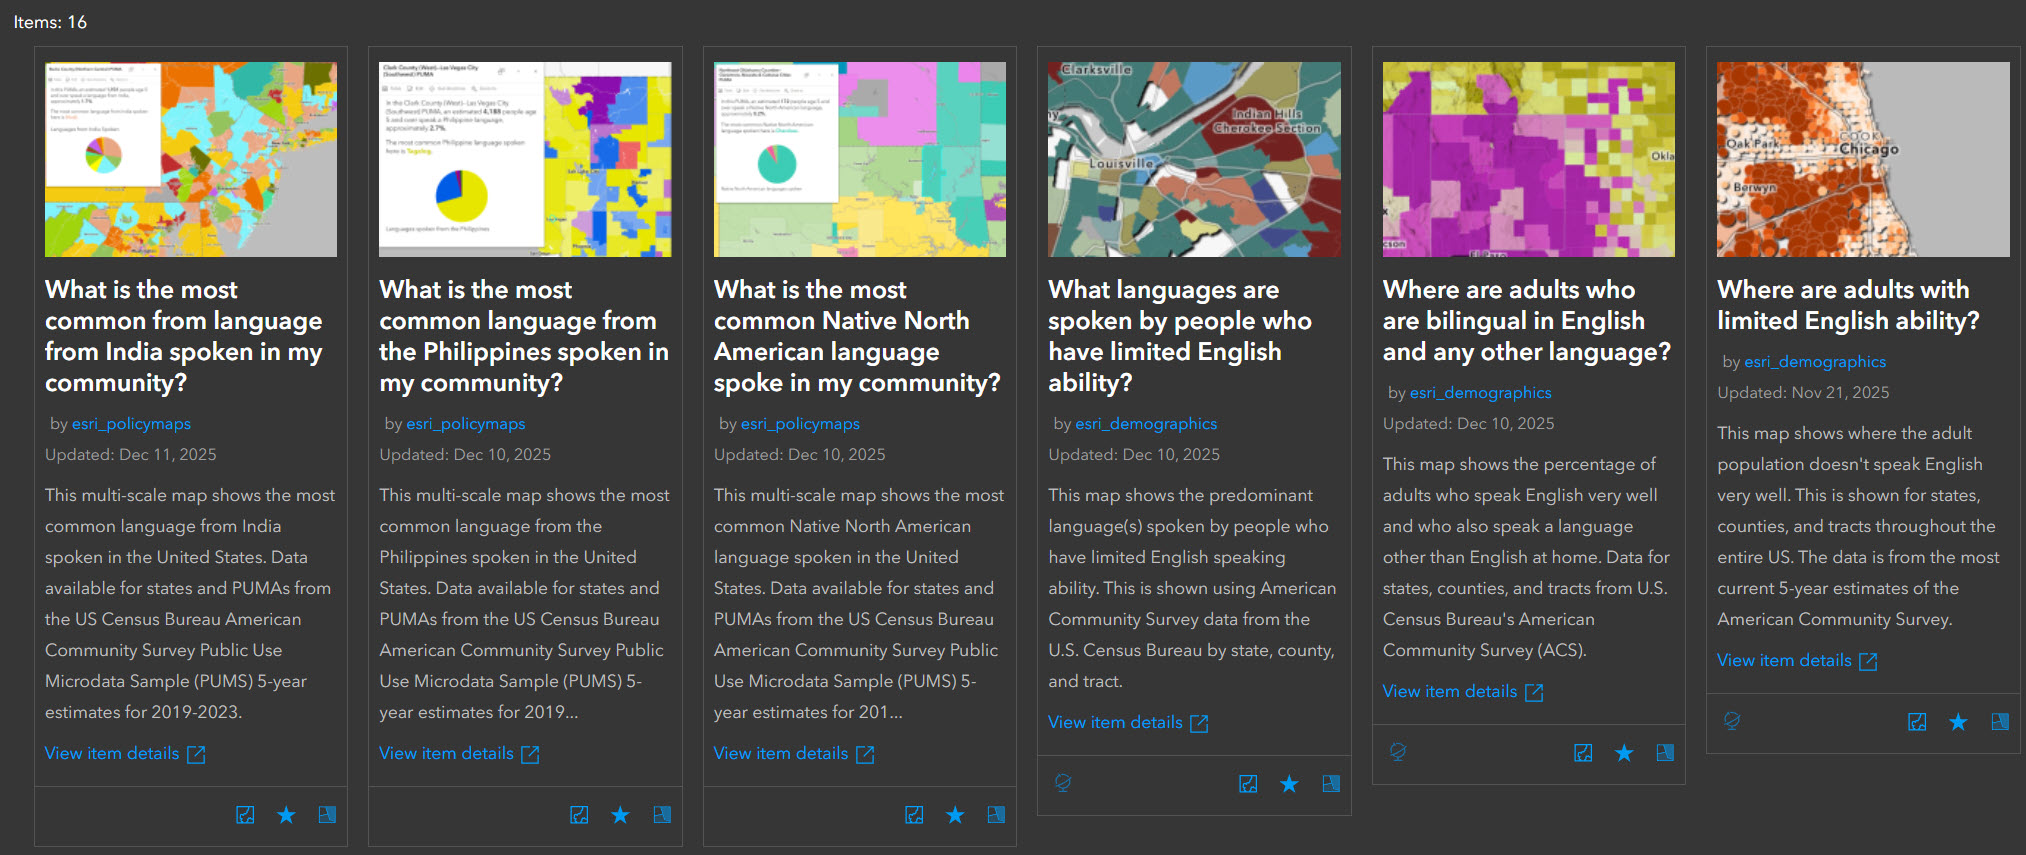
You can also start with a pre-configured web map rather than a layer, great for use in a story map, dashboard, or an Instant App. Here are 16 web maps available in ArcGIS Living Atlas at this time:
- Where are people who speak Somali?
- Where are people who speak Hindi?
- Where are people who speak Navajo?
- Where are people who speak French?
- Where are people who speak Haitian?
- What is the most common language from the Philippines spoken in my community?
- What is the most common language from India spoken in my community?
- What is the most common Native North American language spoken in my community?
- Where do people speak Spanish at home?
- Where are adults who are bilingual in English and any other language?
- Where are adults with limited English ability?
- What languages are spoken by people with limited English ability?
- Where do people speak French, Haitian, or Cajun at home?
- Where do people speak Vietnamese at home?
- Where do people speak Korean at home?
- Where do people speak Arabic at home?
All these maps are highlighted in our capstone Gallery App.
What maps will you make that show the languages spoken in your community?


Article Discussion: