Did you know that the Census Bureau has asked about language spoken at home since 1890? And did you know that there are over 1,300 languages that respondents submit every year?
Both the public and private sectors have multiple use-cases for data on languages spoken. For example,
- to inform where different language media markets might exist for certain television, radio, newspaper, and other communications channels.
- to inform where interest in particular products and services might exist.
- to inform hiring decisions.
- to respond to calls for grant applications.
The feature layer
-Mansfield (North) & Arlington (Southwest) Cities PUMA 18.4% (+/- 1.5%) of the population 5 years and over speak a language other than English at home, at least some of the time. A list of the 10 most common languages here is presented at the bottom.")
For all those who kept asking for more specific language data, we heard you! Thank you for bringing this up at the booth at the user conferences, in questions during webinars, and in other channels. We are proud to announce that one of the newest items available in Living Atlas is a feature layer of over 100 languages spoken across the United States.
How is this different from the ACS language layers already in Living Atlas?
The existing ACS layers in Living Atlas go down to the county and tract levels, whereas this new one does not. Also, the existing ACS layers have counts for the most common languages only, and single counts for groups of languages – French, Haitian, or Cajun, for instance. In order to gain resolution in terms of languages (three counts for those three languages), we lose geographic resolution (hence, state and PUMA level only).
What the heck is a PUMA?
A Public Use Microdata Area (PUMA) is a collection of census tracts that have a minimum of 100,000 people. Tracts are nested within PUMAs, and PUMAs are nested within states, but not necessarily within counties. Just as we do when we process our annual tract-level data, we clipped out the water for cartographic purposes here too.

Pre-Configured Maps in Living Atlas
In addition to the feature layer, there are a number of pre-configured web maps available for those who want to work directly with those. Incorporate these web maps into your workflows by adding them in instant apps, dashboards, story maps, or hub sites. Additionally, you can use these web maps as a starting point, and add in your own organization’s data.
Here are some web maps available from the newly contributed feature layer, that have data at the state and PUMA levels only:
- Where are people who speak Somali?
- Where are people who speak Hindi?
- Where are people who speak Navajo?
- Where are people who speak French?
- Where are people who speak Haitian?
- What is the most common language from the Philippines spoken in my community?
- What is the most common language from India spoken in my community?
- What is the most common Native North American language spoken in my community?
More Available Content
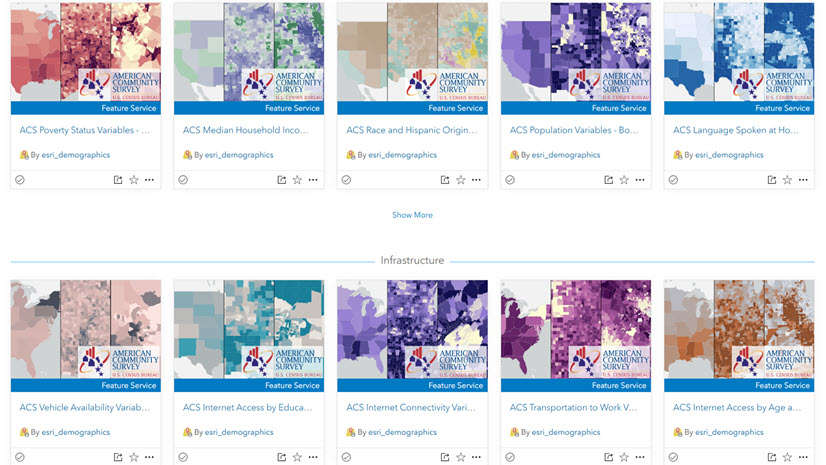
These web maps join others in Living Atlas that are annually updated along with our ACS layers in Living Atlas that have data at the state, county, and tract levels:
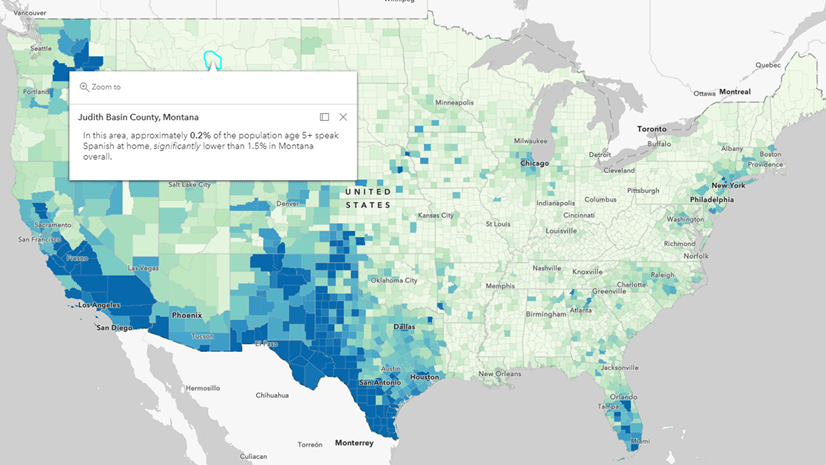
- Where do people speak Spanish at home?
- Where are adults who are bilingual in English and any other language?
- Where are adults with limited English ability?
- What languages are spoken by people with limited English ability?
- Where do people speak French, Haitian, or Cajun at home?
- Where do people speak Vietnamese at home?
- Where do people speak Korean at home?
- Where do people speak Arabic at home?
View all 16 web maps in this capstone Gallery App.

Modify These Ones, or Make Your Own
Feel free to adjust these nation-wide maps to better suit your local context. Or, create your own from a blank map. You can create dozens more web maps from the layer. We encourage you to make ones that make sense for your community.
You can also combine this layer with others for even more insights. For example, we created this map of French, Haitian, or Cajun speakers using the layers available at the tract-level (hence the grouping of these languages). The pop-up uses Arcade to call to the new PUMA-level layer to provide more information with on-the-fly calculations:
, speakers here are likely speaking Haitian.")
, speakers here are likely speaking French.")
, speakers here are likely speaking Cajun French.")
Wrap Up / Call to Action
If you are interested in having this item updated on an annual basis when new ACS PUMS data is available, let us know in Esri Community. In general, the Census Bureau releases the five-year PUMS data file a month or two after the summary tables. For example, if the summary tables are released in early December, the PUMS file usually comes out in late January.
How do you use maps about language in your work? Which languages are most relevant to your organization? Share your projects and ask questions of other Living Atlas users in Esri Community.
Many thanks to the American Community Survey’s respondents. You are the reason we have this type of data.


Article Discussion: