
This two-part blog tutorial series is aimed at showing users how Living Atlas ready-to-use content and apps can be utilized in conjunction with ArcGIS Online analysis tools to gain insights into solar power adoption within a community. The end-to-end workflow is performed in a web browser for optimal accessibility.
Part 1 of this workflow leverages ready-to-use AI tools and models in ArcGIS Online and ArcGIS Living Atlas to extract building footprints and rooftop solar panels from World Imagery.
Part 2 of this workflow continues using ArcGIS Online capabilities to calculate solar panel coverage on rooftops, and correlate buildings with demographic data available in Living Atlas. From this additional analysis, insights into solar power adoption within a community can be shared through a dashboard in ArcGIS Online.

Quick links
Use the links below to navigate different sections of this article.
- Terms of Use
- System Requirements
- Imagery Selection
- Detect Objects using AI Deep Learning Models
- Refining Results
Terms of Use
World Imagery is available for automated information extraction under the following conditions:
- World Imagery layers/services cannot be used as direct input to automated information extraction. Users must export their area of interest to a tile package or hosted tile layer for use as input to information extraction processes.
- Tile packages and tile layers created from World Imagery layers/services are strictly for use within ArcGIS.
- Data and information derived from World Imagery layers, services, and tiles, including but not limited to vector and raster derivatives, are strictly for non-commercial use within ArcGIS.
- Each user is required to have an ArcGIS organizational account.
System Requirements
This workflow requires an ArcGIS organizational account, a minimum of a Professional user type and Publisher role and involves raster analysis in ArcGIS Online which consumes credits.
Imagery Selection
One key to this workflow is high-resolution aerial imagery from Nearmap. This imagery provides detail and clarity for reliable automated information extraction of features such as rooftop solar panels. Starting in the second half of 2026, Nearmap 20 cm. vertical imagery will begin to be integrated and regularly updated in World Imagery for 200 cities across the United States, Canada, Australia and New Zealand. You can read more about that here.
The workflow begins in the World Imagery Wayback app, where a new capability allows users to publish a hosted Tile Layer in their ArcGIS Online organization.
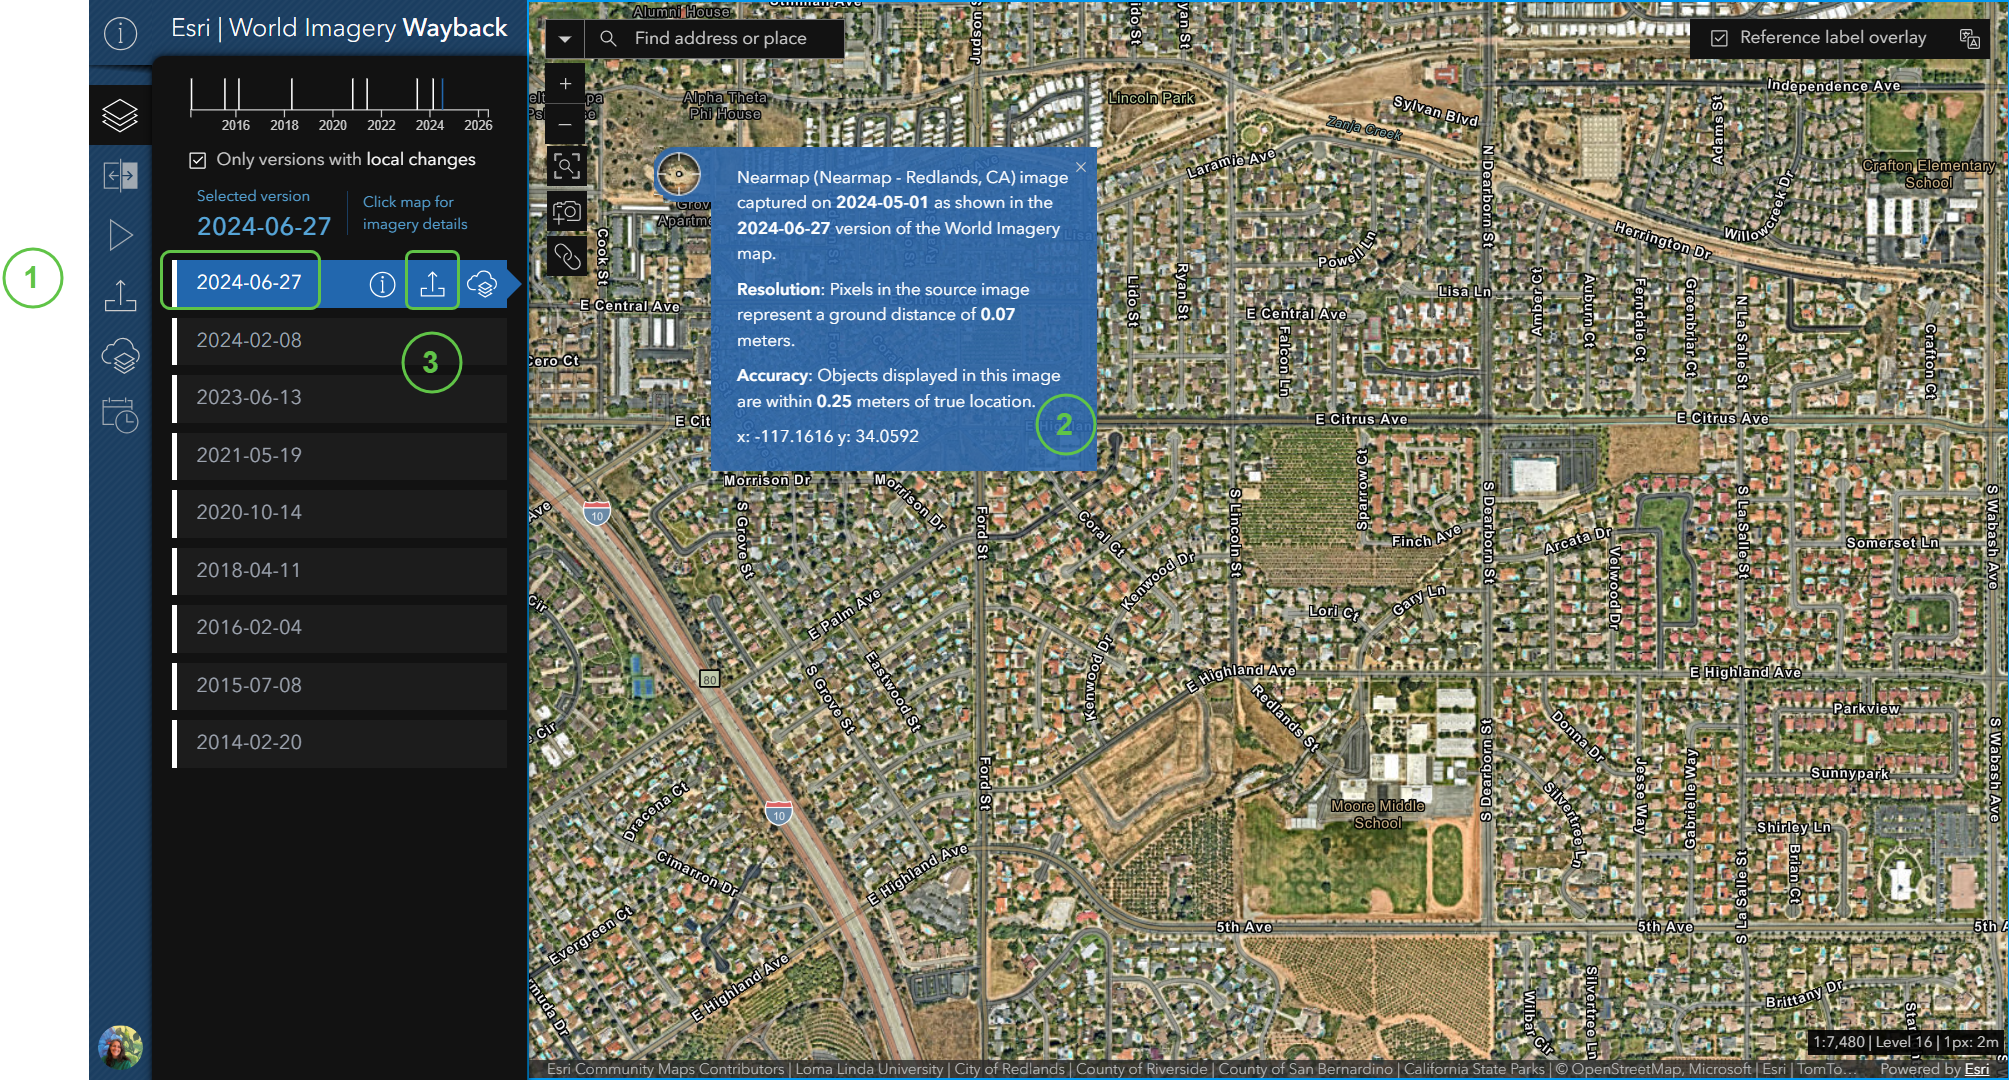
Step 1 – Open the Wayback app at the specified extent of this tutorial by clicking this link: Wayback in Redlands, CA
Note: If you are not already signed in at this point, you will be prompted to authenticate with your ArcGIS Online account.
-
-
-
- Verify that the Wayback version 2024-06-07 is selected
- Click on the map to validate the source: imagery provider, capture date and spatial resolution.
- Click Export a Tile Package for the selected version.
-
-
Step 2 – Export Tile Package
- For the purposes of this tutorial, please leave the default extent. Tile export does allow the user to refine the geographic extent by selecting and dragging a corner.
- Please select Level 20 as the max level of detail.
- Create Tile Package.
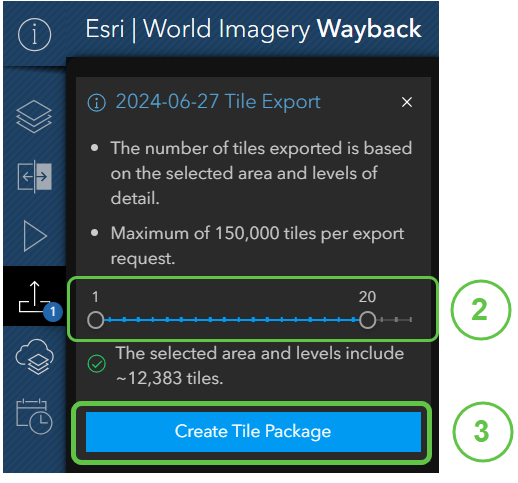
New Capability in the Wayback Application!
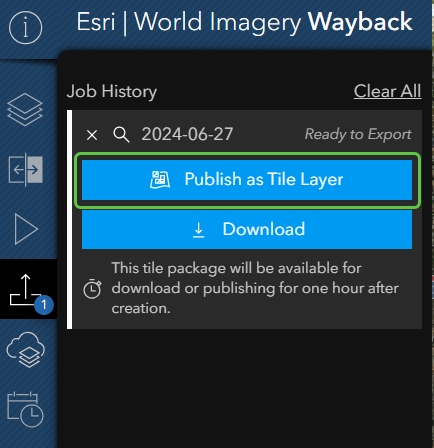
Step 3 – When prompted, select Publish as Tile Layer in your ArcGIS Online organization.
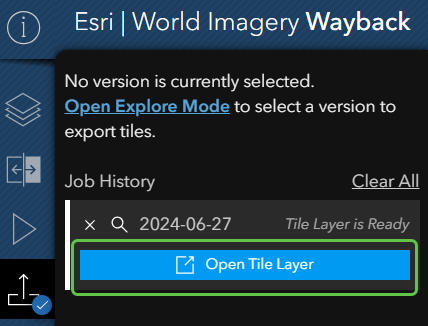
When the hosted Tile Layer is ready, you will be prompted to Open the Tile Layer’s ArcGIS Online item page directly from the Wayback Application.
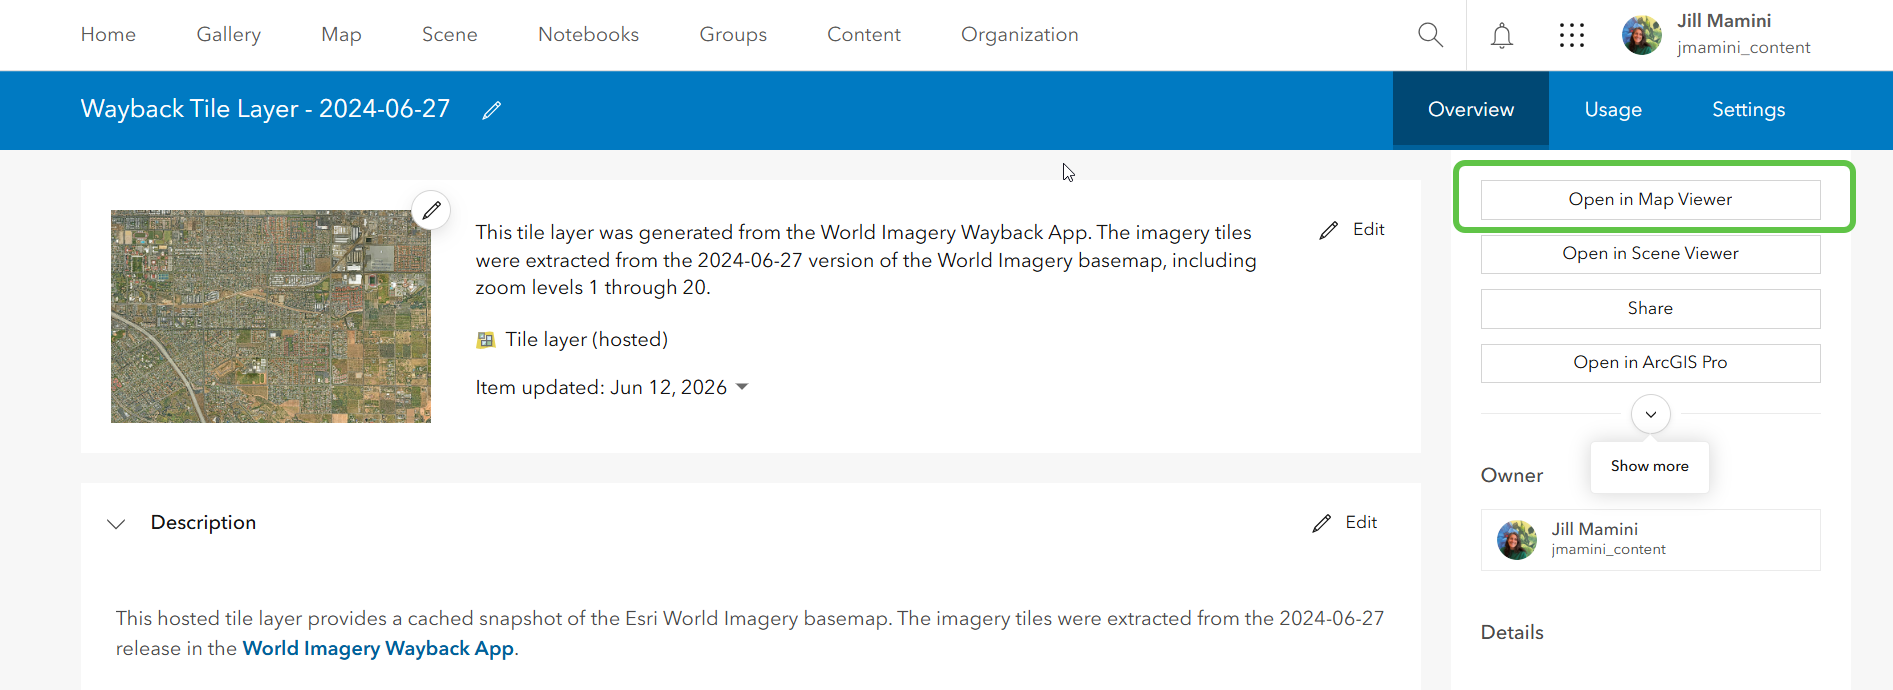
Step 4 – From the ArcGIS Online item page, you can see details about the hosted World Imagery Tile Layer and open it in Map Viewer.
Detect Objects using AI Deep Learning Models
With the World Imagery tile layer as source input, we can leverage pre-trained deep learning models available in Living Atlas, and ArcGIS Online ready-to-use analysis tools to detect and extract:
- Building Footprints
- Solar Panels
In order to limit the time it takes to complete this tutorial and the number of credits it consumes, you will use a publicly hosted feature layer to define the processing extents for object detection and extraction.
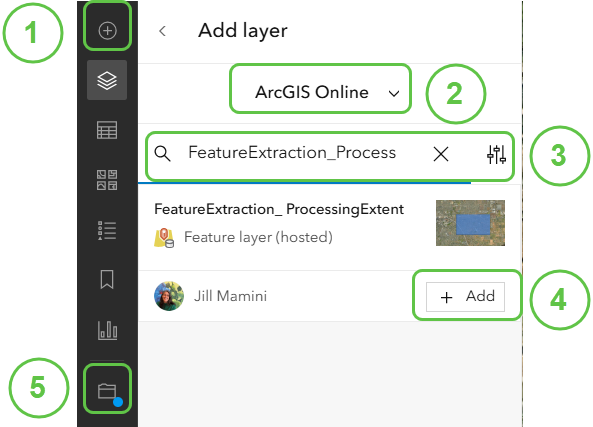
Step 1 – Search ArcGIS Online for the processing extent feature layer and add it to a map
- Click on the + icon to add a layer to your web map
- Select ArcGIS Online from the dropdown menu
- Search for FeatureExtraction_ProcessingExtent
- Add the Layer to the map
- Save the web map
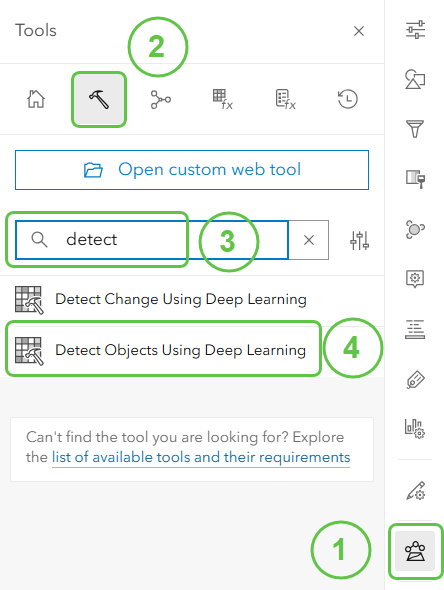
Step 2 – Access the ArcGIS Online Analysis Detect Objects using Deep Learning Tool
- Select the Analysis Button from the right-hand side of Map Viewer
- Select Tools
- Search for tool using a key word “detect”
- Select the Detect Objects Using Deep Learning
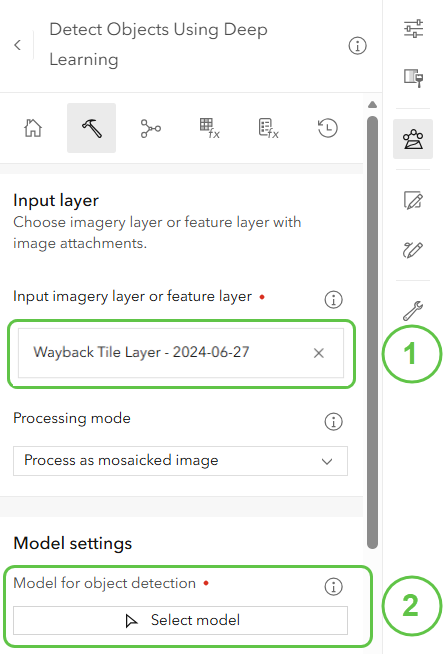
Step 3 – Specify the Inputs for the Detect Objects using Deep Learning Tool
- Select your World Imagery tile layer as the Input imagery layer
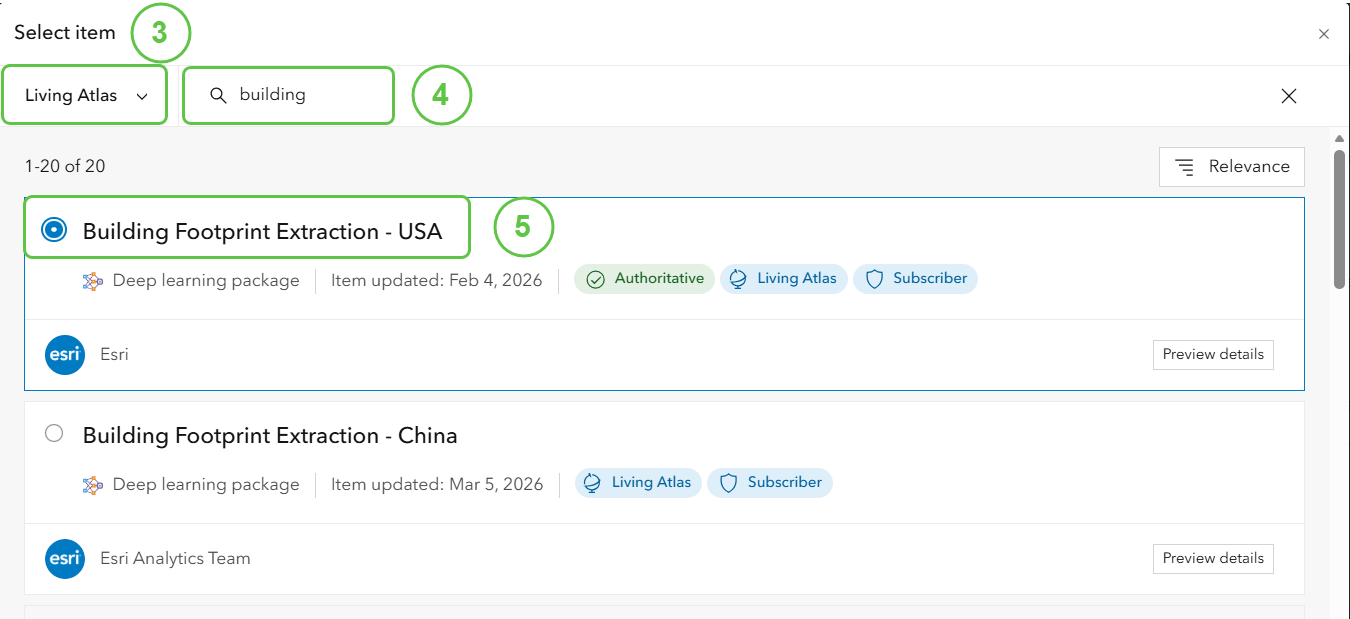
- Click Select model under Model Settings
- Select Living Atlas from the dropdown menu
- Search for the model using the keyword “Building“
- Select the Building Footprint Extraction – USA pre-trained deep learning package
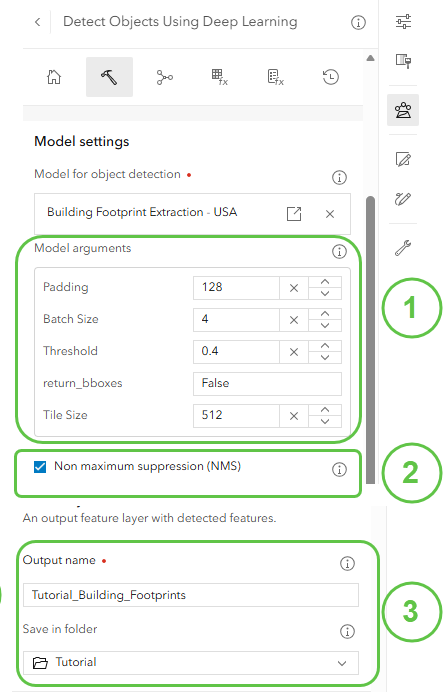
OPTIONAL – When the model is loaded, a set of default values for the parameters will be given. The default values tend to perform well on their own, but some modification could improve performance and results. To understand what each argument does, hover over the information icon next to the Model arguments subheading and read the short description.
- Lowering the default value for padding may increase performance.
- Increasing tile size may provide better results detecting larger objects.
- Lowering the threshold may help improve object detection.
Step 4 – Configure the Deep Learning Model Arguments
- Model Arguments – use the defaults except reduce the Threshold to 0.4
- Turn non maximum suppression NMS ON. This will consolidate detected objects by removing duplicates.
- Specify an Output Name Tutorial_Building_Footprints, and location for the detected objects layer.
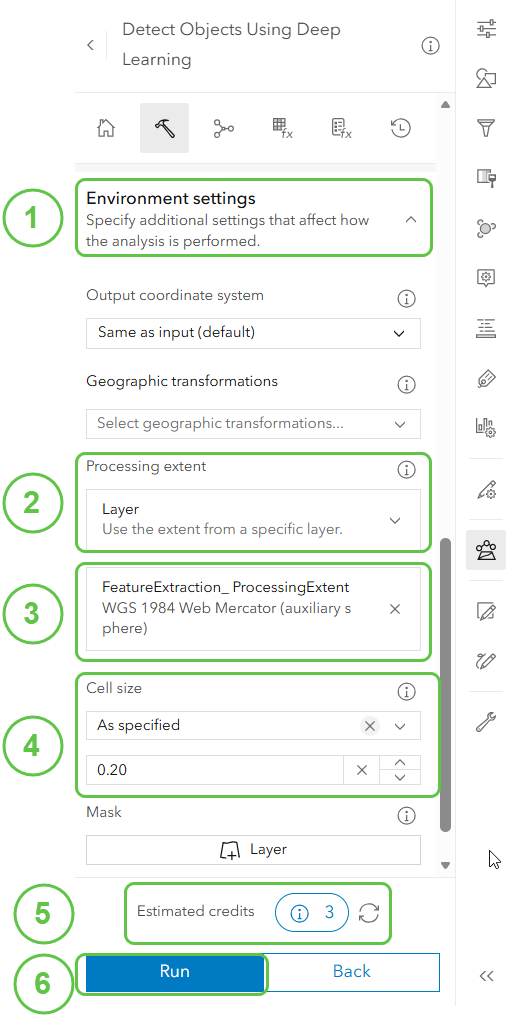
Step 5– Configure outputs & environment settings, estimate credits and run the model
- Expand the Environment Settings
- Set the processing extent to Layer
- Specify the FeatureExtraction_ProcessingExtent layer
- For Cell size specify a value of 0.20
- Estimate Credits.
- Click Run to submit the job.
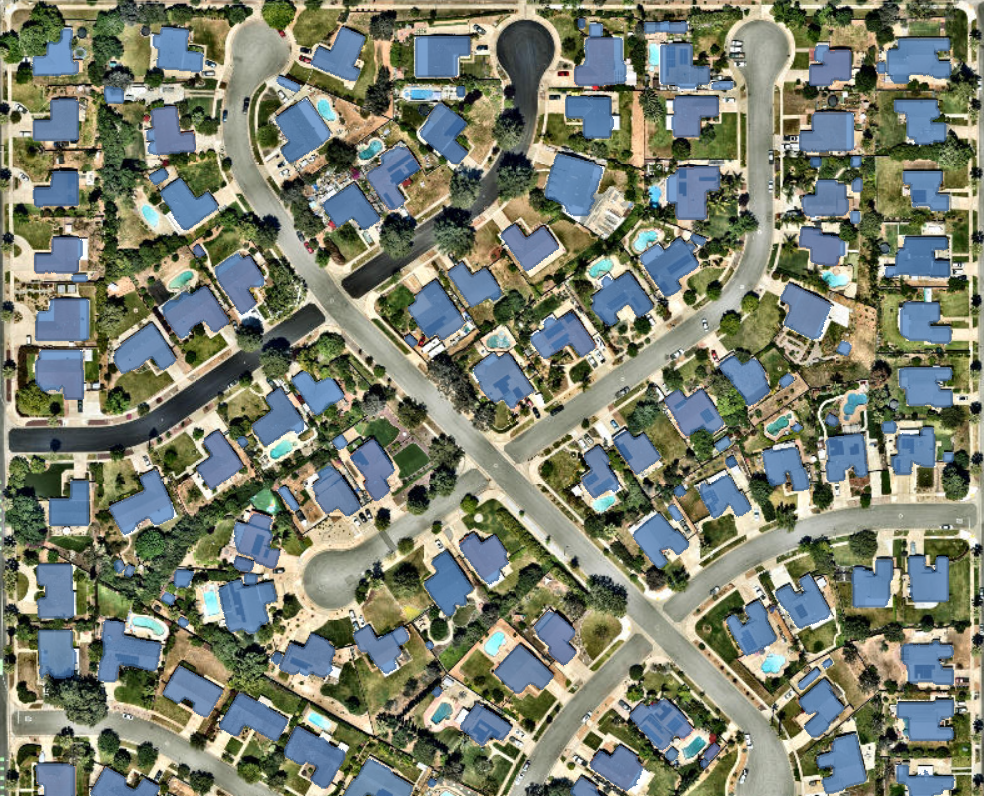
Online resources are provisioned and the deep learning model executed with the World Imagery Tile Layer as the source. The process takes time to process and produce results. When completed, the results from the Building Footprint Extraction -USA deep learning package with the World Imagery Tile Layer will be loaded in Map Viewer.
Once a Detect Objects using Deep Learning job has been submitted, you can configure another job for submission. You do not need to wait for the first submitted job to finish.
Follow the same Detect Objects using AI Deep Learning Models Steps 3 through 5 for detecting solar panels instead of footprints. Steps 1 and 2 will be the same as they were for when you were detecting building footprints.
Step 3 – Specify the Inputs for the Detect Objects using Deep Learning Tool
- Select your World Imagery tile layer as the Input imagery layer
- Click Select model under Model Settings
- Select Living Atlas from the dropdown menu
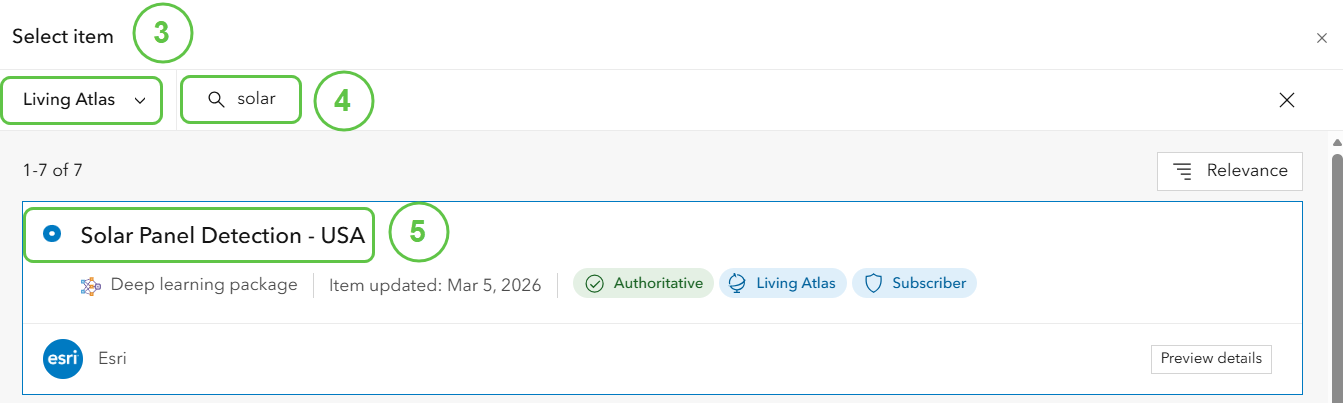
- Search for the model using the keyword “Solar“
- Select the Solar Panel Detection – USA pre-trained deep learning package
Step 4 – Configure the Deep Learning Model Arguments
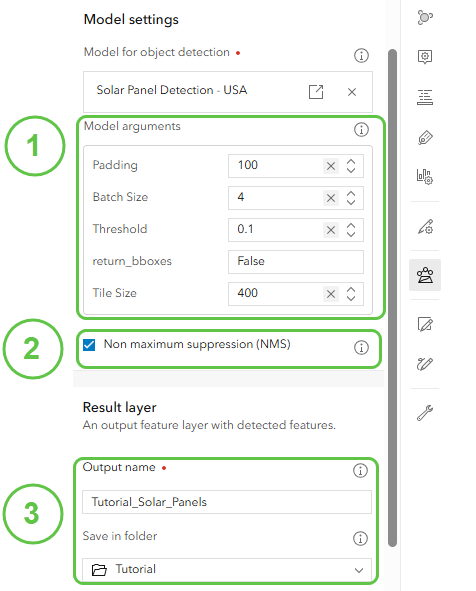
- Model Arguments – use the defaults except reduce the Threshold to 0.1
- Turn non maximum suppression NMS ON. This will consolidate detected objects by removing duplicates.
- Specify an Output Name Tutorial_Solar_Panels, and location for the detected objects layer.
Step 5– Configure outputs & environment settings, estimate credits and run the model
- Expand the Environment Settings
- Set the Processing extent to Layer
- Add Layer FeatureExtraction_ProcessingExtent
- For Cell size specify a value of 0.20
- Estimate Credits.
- Click Run to submit the job.
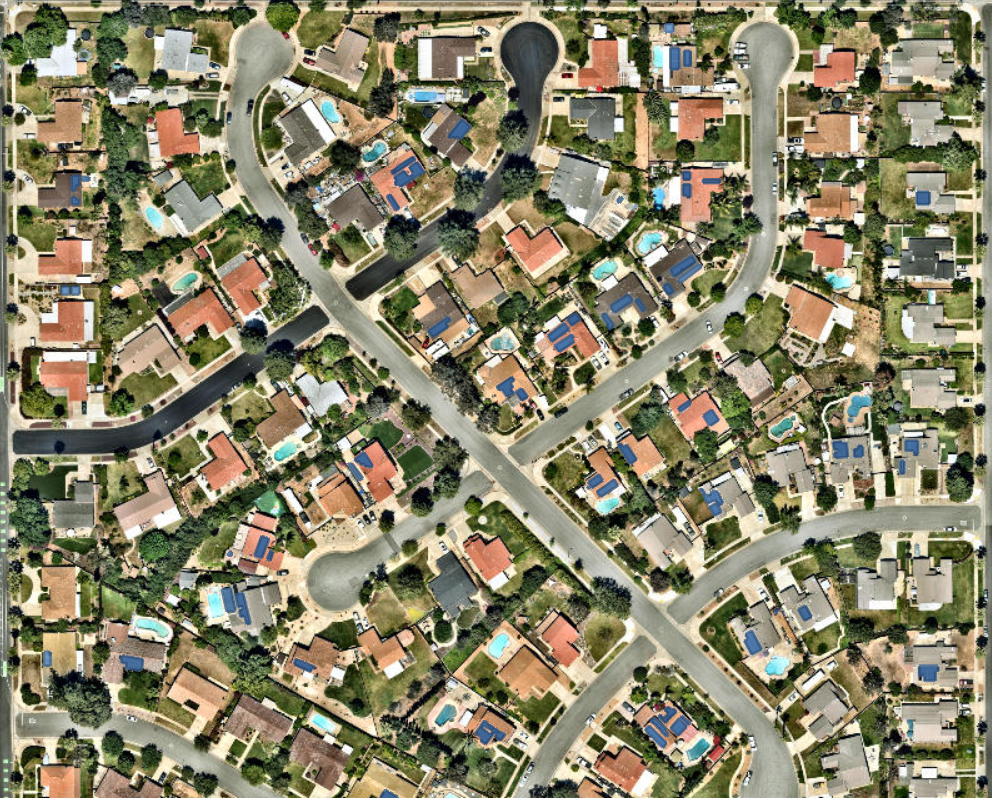
When completed, the results from the Solar Panel Detection – USA deep learning package with the World Imagery Tile Layer will be loaded in Map Viewer.
Refining Results
AI with World Imagery was executed with two different pre-trained deep learning models available in the Living Atlas. In order to better visualize the results, you can stylize the symbology for each layer, to maximize contrast between the detected building footprints and the solar panels.
Step 1 – Style selected layer symbology
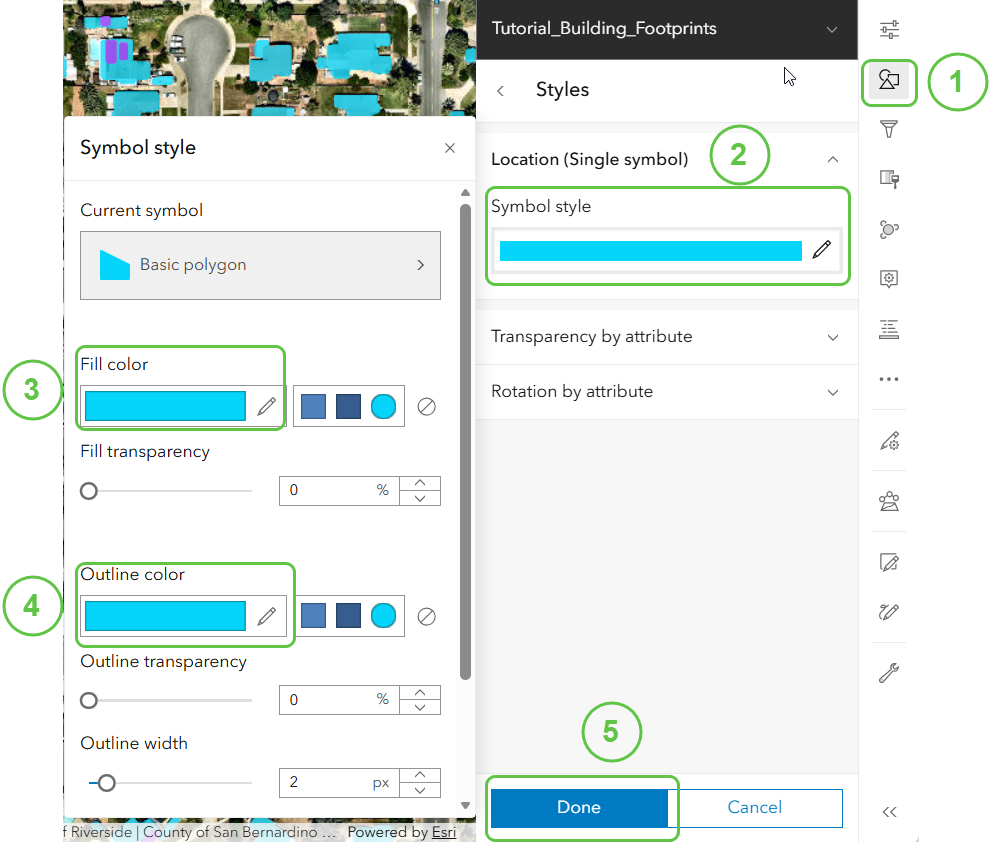
- Click on the Style icon
- Click on the Symbol style edit pencil icon
- Select a new Fill color
- Select an new Outline color
- Click Done to apply the changes to symbology
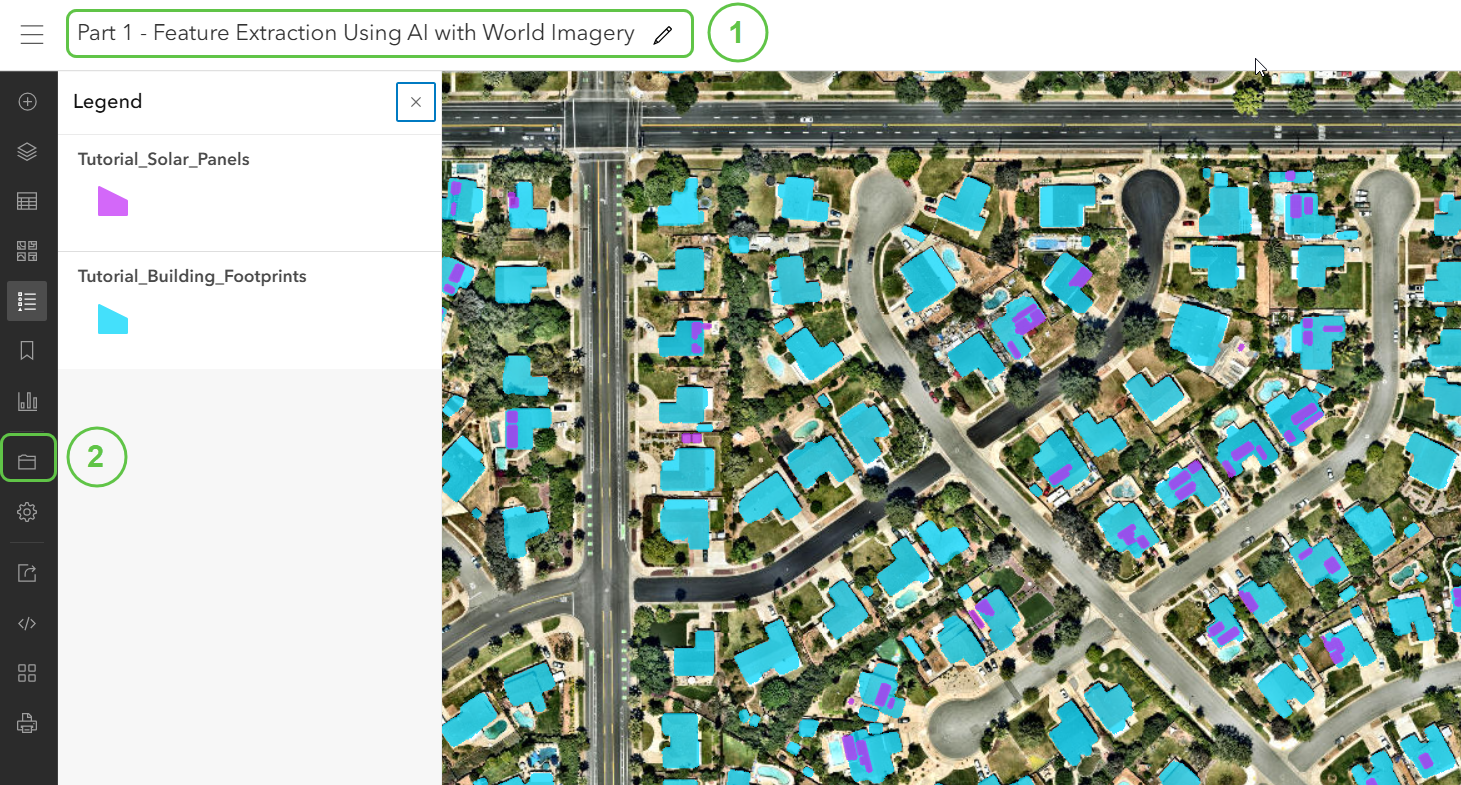
Apply Symbology changes to make the solar panel result layers purple, and the building footprint results layer a bright blue. Display the solar panels on top of the building footprints and overlay both layers on the World Imagery tile layer they were extracted from.
Step 2 – Save the web map
- Rename the web map: Part 1 – Feature Extraction Using AI with World Imagery
- Click on the Save Option on the left-hand toolbar of Map Viewer
More Information
To extend the analysis beyond a single point in time, use the Wayback Application to explore historical versions of the World Imagery basemap. This allows you to identify older, high-resolution imagery for the same area of interest and apply the same AI workflow to extract building and solar panel features.
By running deep learning models on multiple points in time, you can begin to introduce a temporal dimension to your analysis. This historical perspective enables you to compare change over time and provides valuable context for understanding patterns such as growth in solar adoption within a community.
Explore Part2: Coverage analysis and insights to continue using ArcGIS Online ready-to-use capabilities to perform analysis of detected objects and correlate that information with demographic data available in Living Atlas.



Article Discussion: