On February 13th, 2024, we officially announced the availability of Landsat Explorer, making it easier than ever for anyone to access and analyze more than 40 years of multispectral imagery from the Landsat satellite missions. With a deep temporal record, multispectral Landsat imagery supports a diverse range of land monitoring applications and helps organizations at local, regional, and national levels make informed decisions for sustainability.
Powered by the Landsat Level-2 multispectral imagery from ArcGIS Living Atlas, and the ArcGIS Maps SDK for JavaScript, Landsat Explorer provides unprecedented ease of use and accessibility to the full archive of Landsat science products. Whether educating the next generation of managers, scientists, influencers, and decision makers, or helping today’s professionals unlock useful insights, the app has something for everyone, furthering the democratization of Landsat imagery and enabling innovation.
The Landsat Explorer joins our growing suite of new imagery explorer apps from Living Atlas. Progressively disclosing information, concepts, and capabilities, the imagery explorer apps are built upon a common framework and a shared set of guiding principles: Simple, Accessible, and Insightful, these apps are intended to engage a broad community of remote sensing for Earth exploration and discovery.
This article will step through and briefly describe the various modes of Landsat Explorer, serving as a reference guide and tutorial for the app. Enjoy!

Quick Links
Use the links below to jump to sections of interest.
The modes:
- Explore -> Dynamic
- Explore -> Find a Scene
- Swipe
- Animate
- Analyze -> Index Mask
- Analyze -> Temporal Profile
- Analyze -> Spectral Profile
- Analyze -> Change Detection
Dynamic Mode
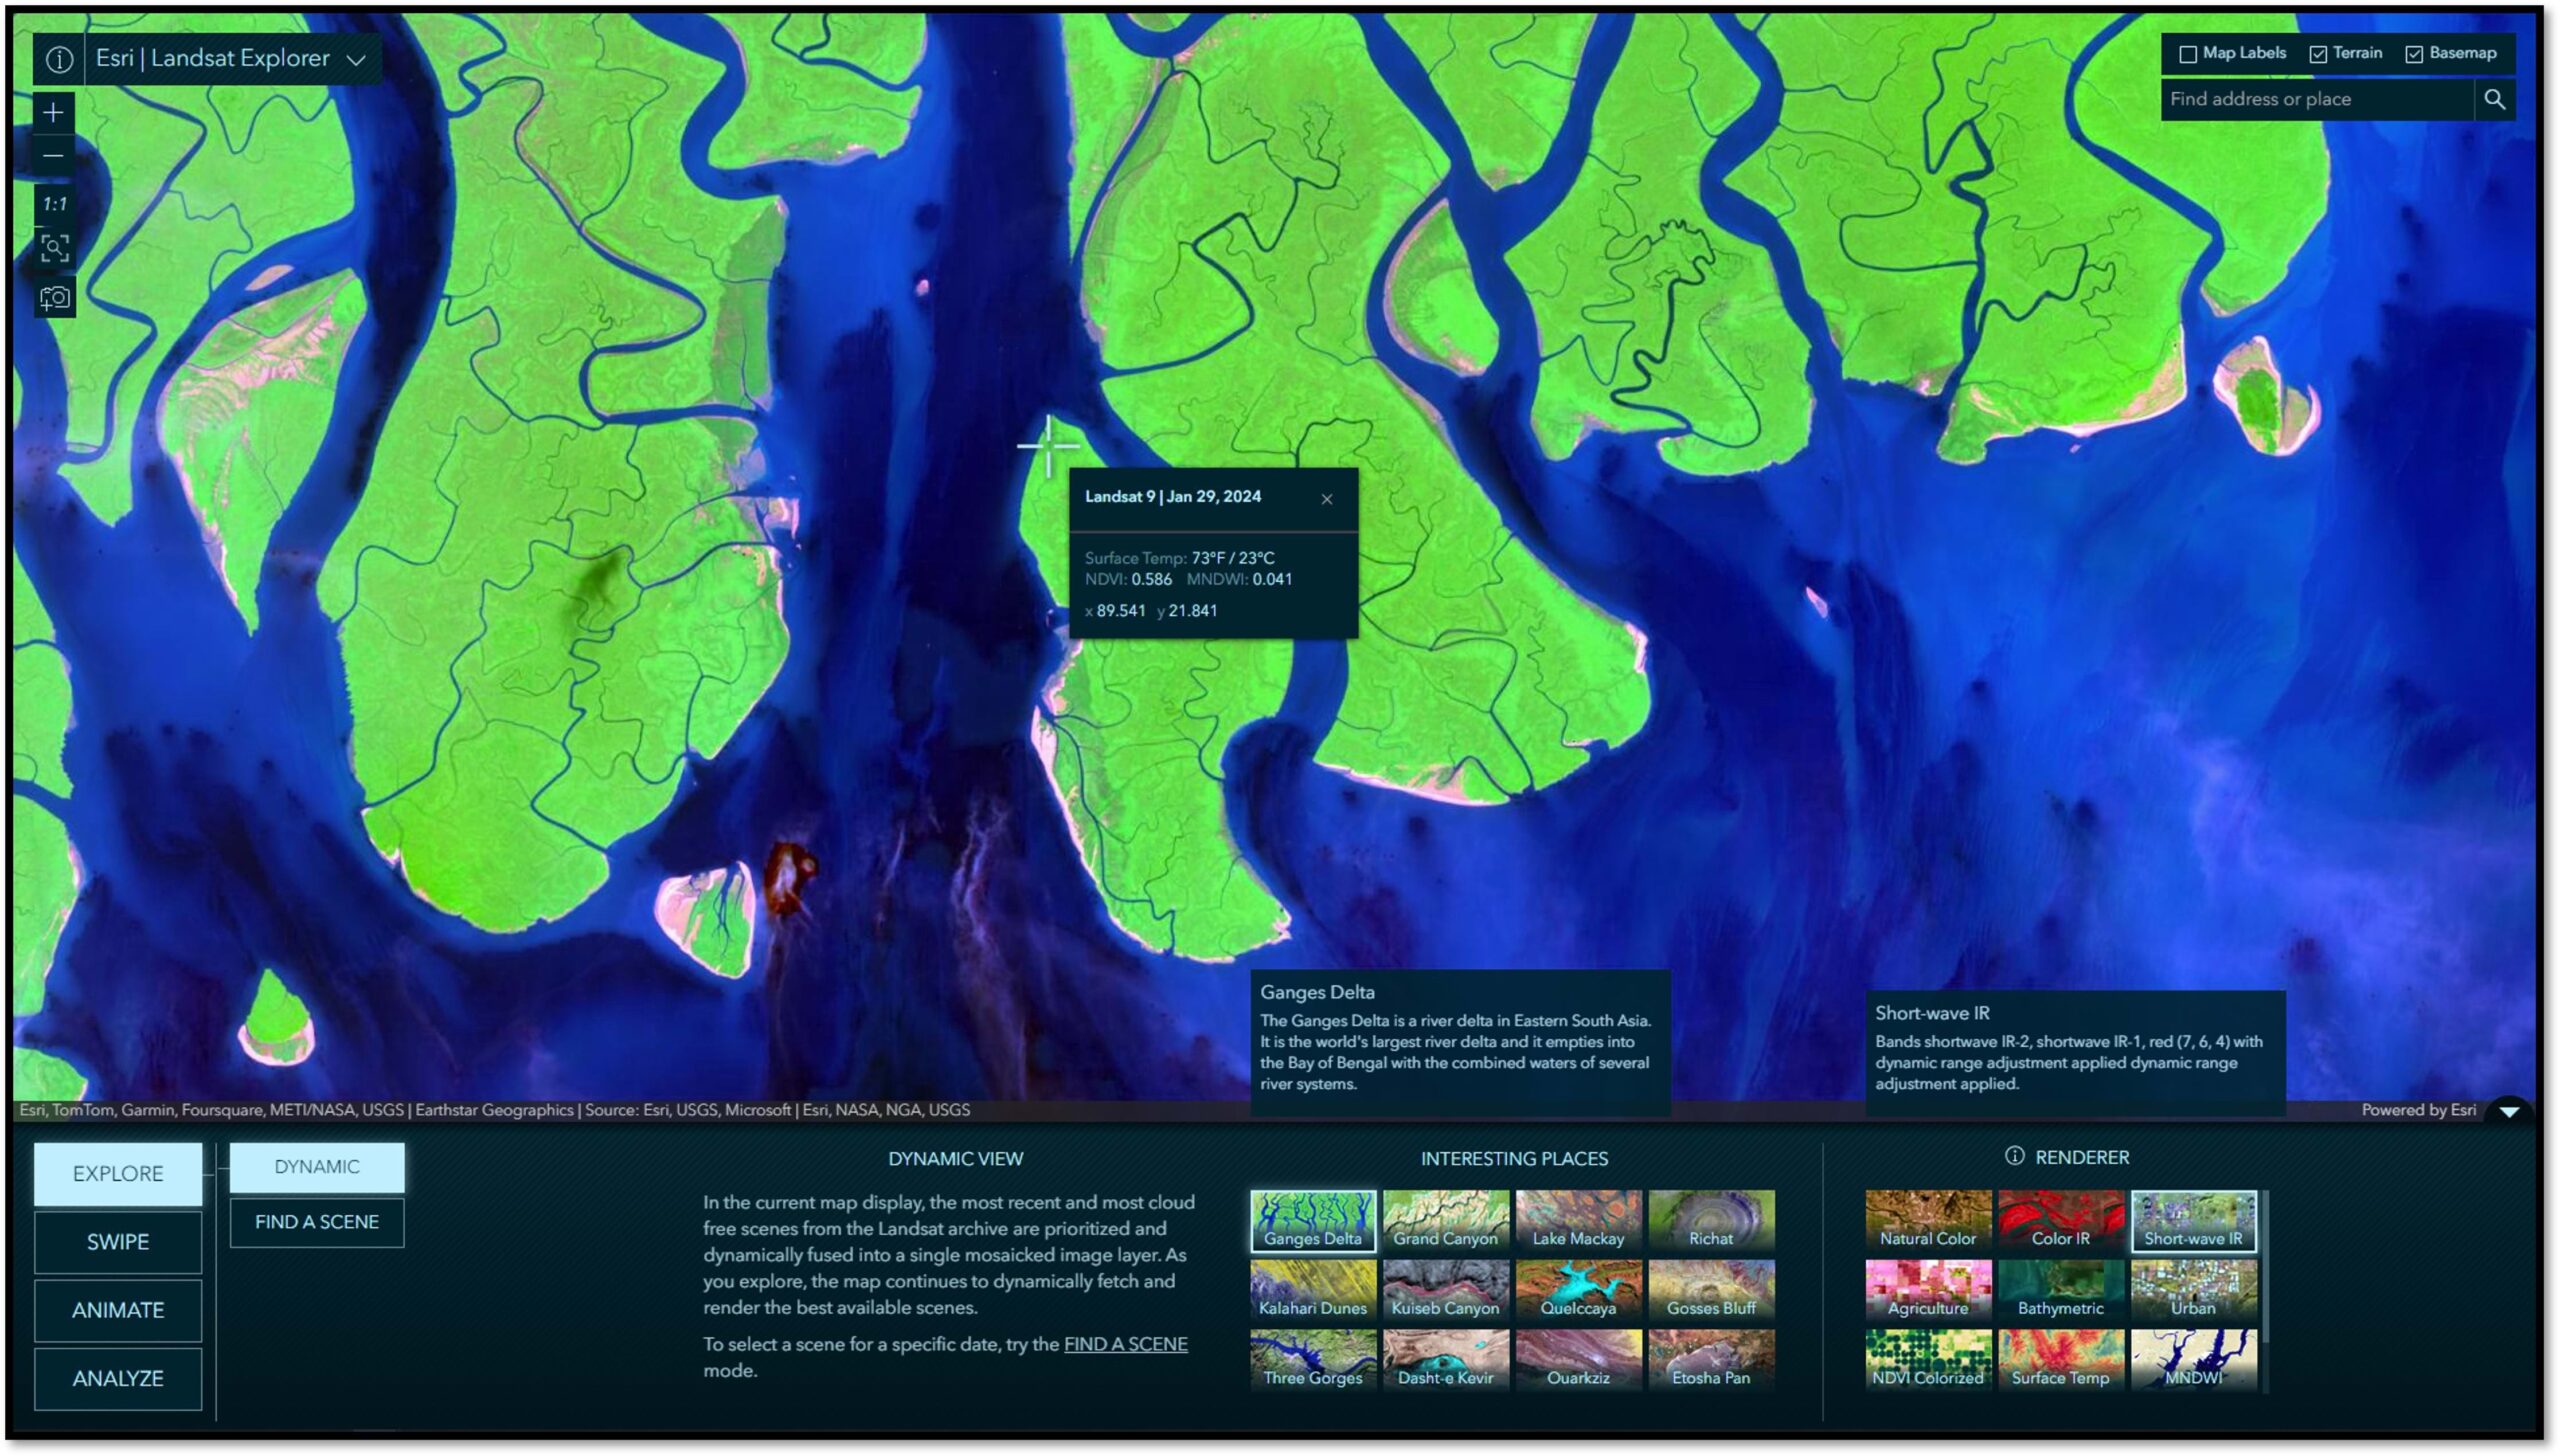
The app opens in Dynamic mode by default. In this mode, the most recent and most cloud free scenes from the Landsat archive are prioritized and dynamically fused into a single mosaicked image layer. As you pan and zoom, the map continues to dynamically fetch and render the best available scenes. You can select and learn about a variety of interesting locations around the world. You can also select from different spectral renderings of the imagery, highlighting different types of information.
Find a Scene
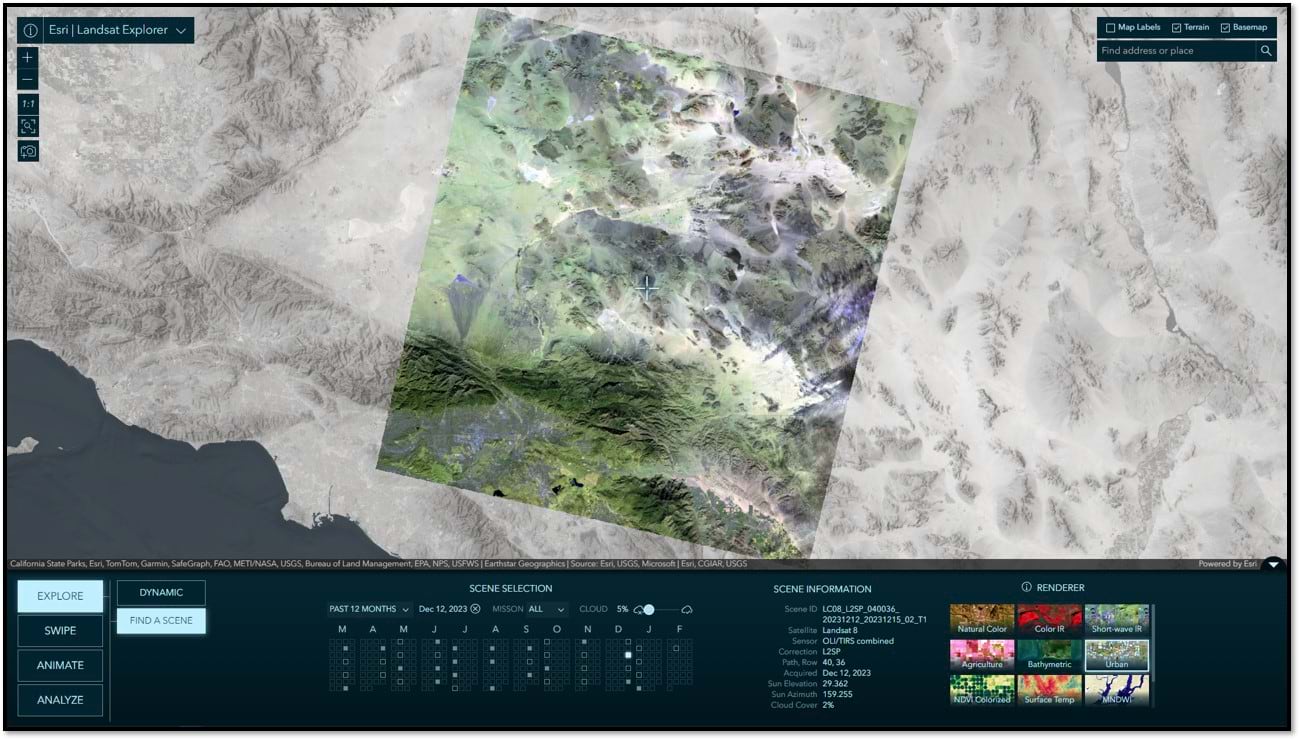
This mode allows for the selection of individual Landsat scenes by year, month, and day. By default, the calendar displays the past 12-months of available scenes. Available scenes can also be filtered by mission or by cloud cover. The scenes matching your criteria are included in the calendar and those meeting the specified cloud cover tolerance are highlighted with a solid fill. Hover over a square for an information tool tip and click on it to load that scene into the map view. Detailed information about the selected scene is provided in the Scene Information panel. As you will see, the find a scene functionally is leveraged throughout the app, simplifying the discovery and selection when and where you need it.
Swipe
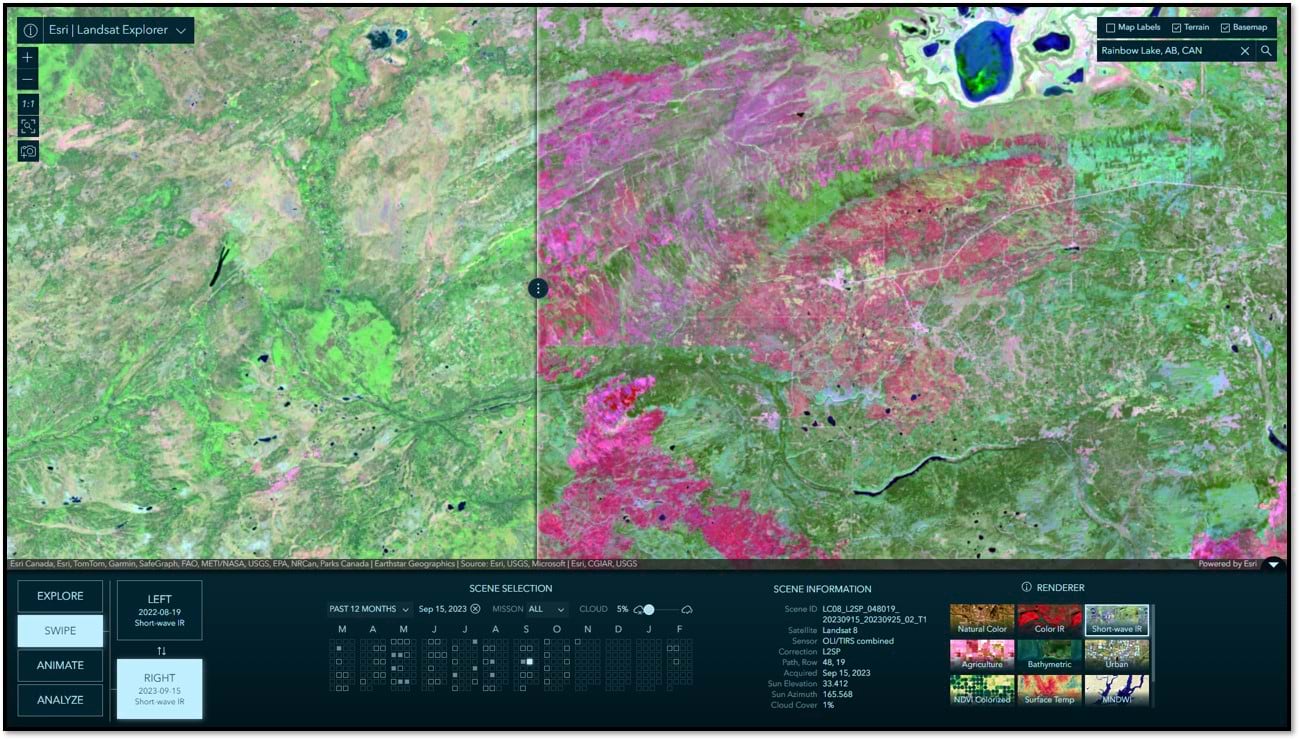
In Swipe mode, you can select two scenes to swipe and visually compare differences between them. It is common to choose between scenes of different dates, but you can also swipe and compare different renderings of the same date, or mix and match. Swipe is a simple yet extremely powerful way to visually detect, explore, and analyze differences and similarities between two images. Below is a before and after comparison from the 2023 Long Lake Fire in Alberta, CAN. The image on the left shows pre-fire conditions, while the image on the right is post-fire, where the burn scars are readily visible as a fuchsia color in this Short Wave Infrared spectral rendering.
Animate
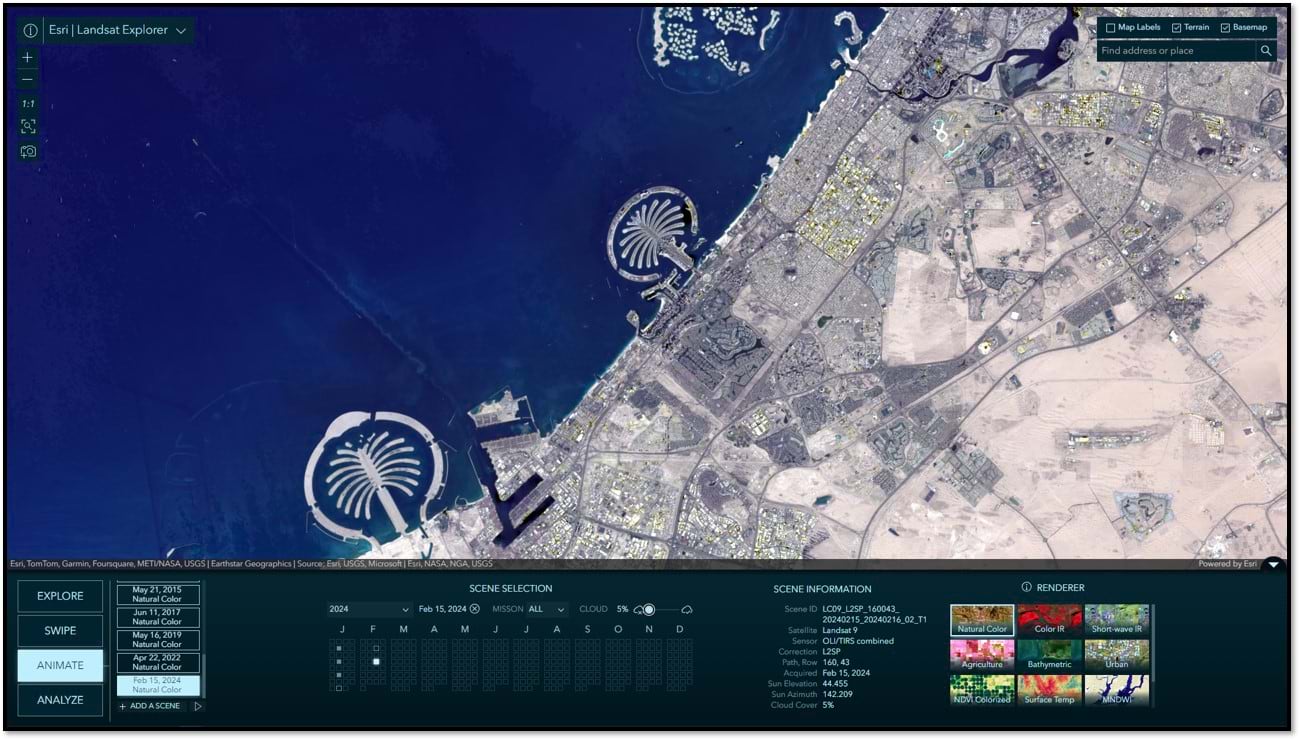
In Animate mode, you can select multiple scenes to create compelling time animations. Click “+ Add a Scene”, select a date, and repeat. When you have gathered your collection of images, click the play button to start the animation. During playback, you can choose your frame rate and optionally export your animation to an MP4 with the layout of your choosing. The animation below was constructed in just a few minutes. While coverage in this region was variable in the 80’s and 90’s, given licensing and technical constraints with Landsat 5 and 7, there are still enough scenes options to generate a time series animation of urban sprawl in Dubai, UAE, one of the fastest growing urban areas in the world.
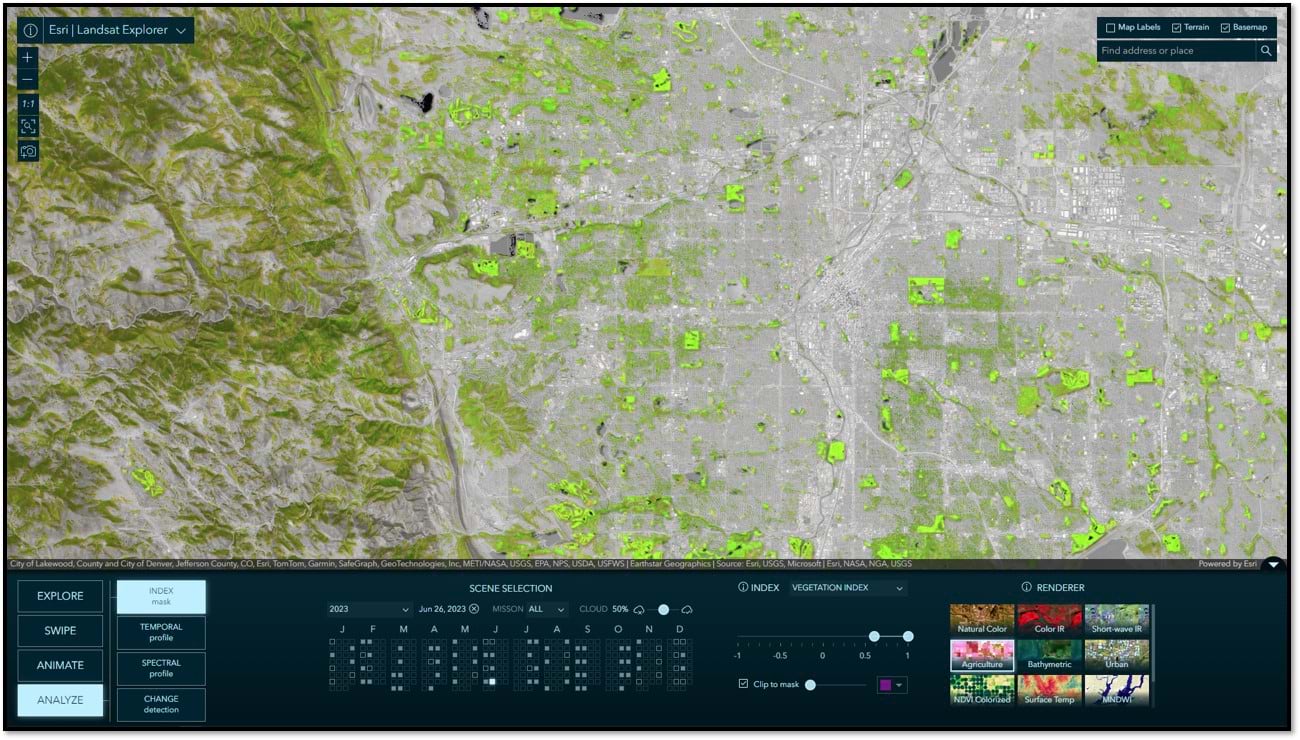
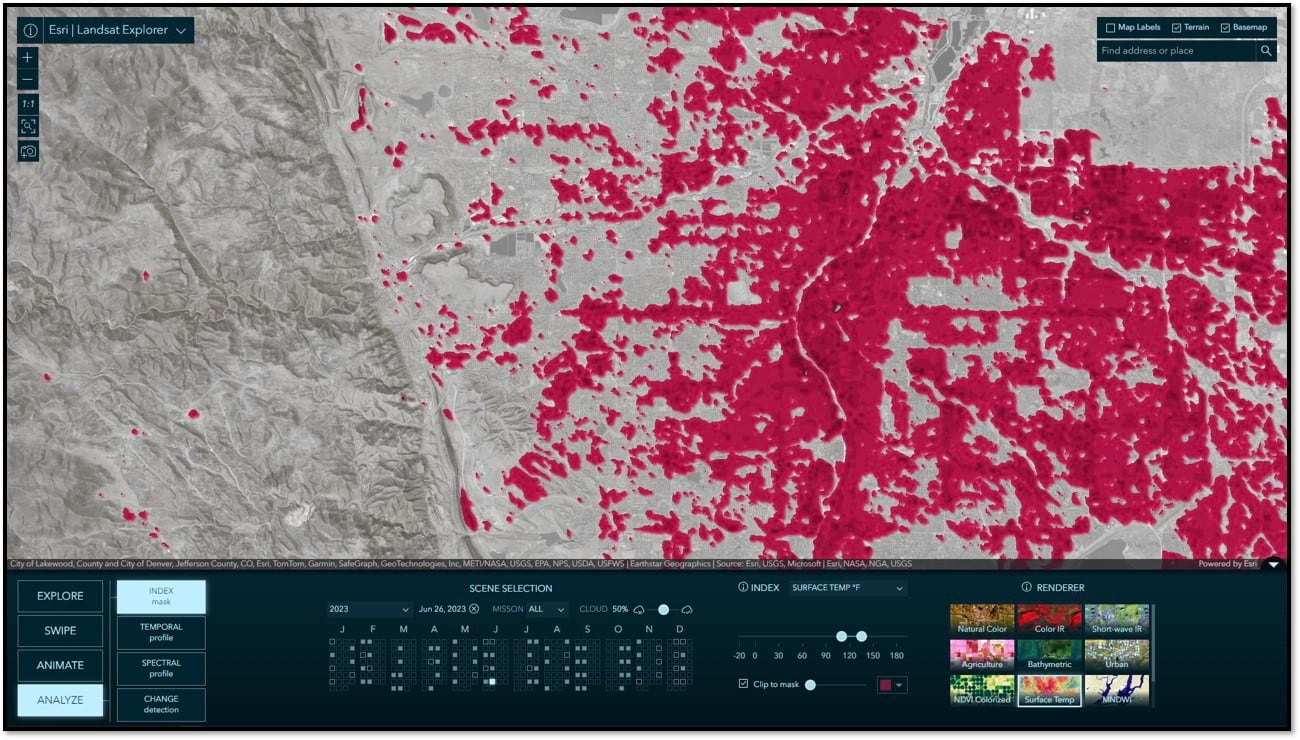
Index Mask
In this mode you can use spectral indices, derived from mathematical calculations, to measure relative abundance of things like water, moisture, and vegetation, and perform simple thresholding on land surface temperature to show relatively hot vs cool surface areas. As you move the slider, a mask is dynamically rendered on screen indicating the areas meeting the specified thresholds. Alternatively, the mask can be used to clip the image and only show the pixels covered by the mask. In the two images below, the first shows the areas with the healthiest vegetation. The second shows a surface temperature image clipped to show the hottest surface areas. Not surprisingly, there is a strong correlation in lack of vegetation and hot surface areas. If this sounds complicated, well, it’s not. Give it a try!
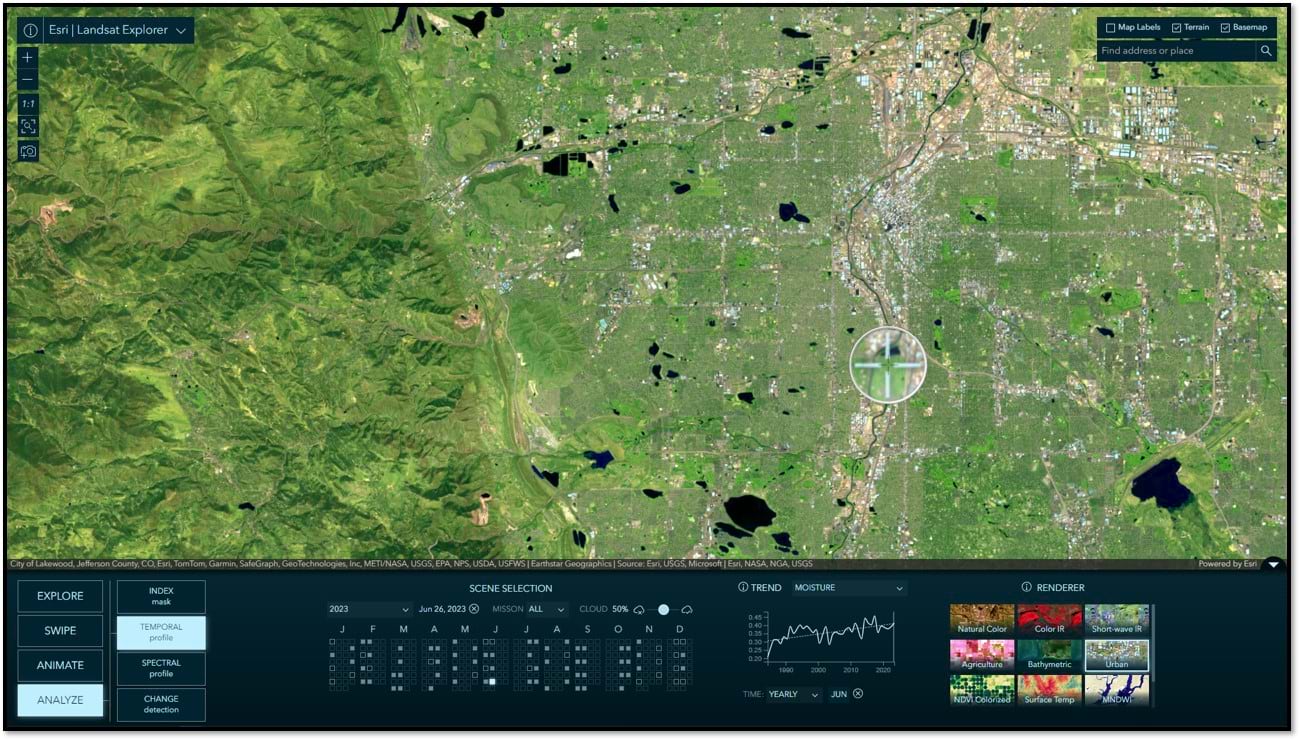
Temporal Profile
Using the temporal profile tool you can detect categorical trends over time, including surface temperature as well as moisture, vegetation, and water. When Yearly is selected, you can specify the target month you would like to be sampled year over year. This option is best for identifying long term patterns and trends. When Monthly is selected, you specify the target year and all 12-months within that year will be sampled. This option is useful for seeing seasonal patterns and fluctuations throughout the year. To get started, all you have to do is click on the map.
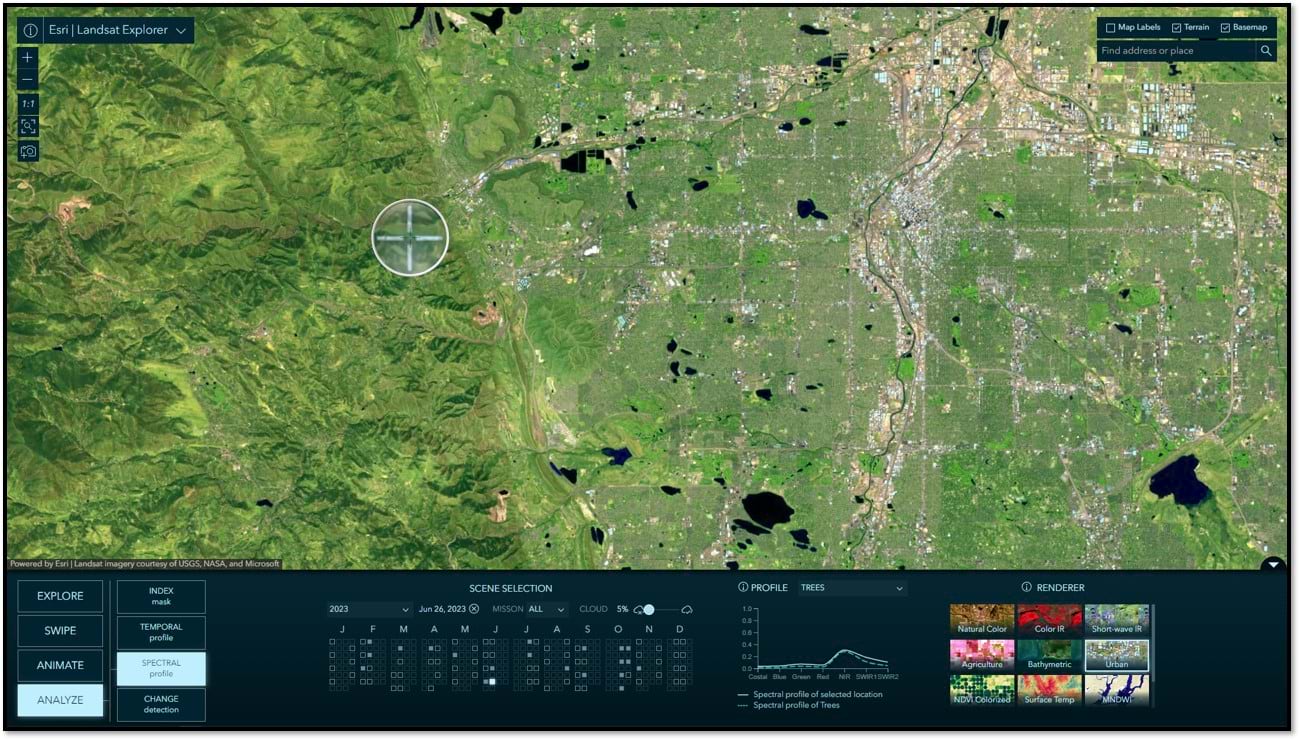
Spectral Profile
The thing about multispectral imagery is that it measures the varying amounts of light that different materials reflect, in other words spectral responses. By repeatedly sampling the spectral response of the same type of material on the Earth’s surface it is possible to build a spectral signature for that material. In this tool, you can click anywhere on the map and a spectral profile for that point will be generated. Simultaneously, we will try to match that selected point with one of the pre-defined spectral signatures available in the dropdown list. You will find plenty of correct matches, but you will also find false matches. This can be attributed to multiple factors, including our sampling methodology and some inherent limitations in the data. However, this should be taken as an opportunity to imagine what is possible with Landsat imagery.
Change Detection
In this mode, you are able to select two images and calculate the difference between them. You can create change masks based on vegetation, water, and moisture indices. Creating difference images allows you to then do further analysis, such as estimating forest and vegetation loss in the event of a wildfire. Coming back to the same two before and after images from the Swipe example above, visually detecting changes between them. In the example below, we calculate the difference in the vegetation index for each image and the result is a difference mask. Then, we are able to use the threshold slider to quickly get an approximate delineation of the vegetation loss due to the 2023 Long Lake Fire in Alberta, CAN. A simple yet powerful capability.
Tips and Tricks
- Easily create high resolution screenshots by clicking the camera icon. HINT: Minimize the app toolbar and maximize your browser to get full size captures.
- Copy and share URL’s from your browser so others can interactively see what you see.
- Unfortunately, Landsat 7, a pioneer of its time, suffered a significant technical setback in 2003, resulting in data gaps in all subsequent images collected. It continued to collect images until 2022 and these images are included in the archive. If you wish to filter for specific missions to include in the list of available scenes, you can do so using the Mission filter found at the top of the calendar.
More Information
Landsat Explorer: New vs Classic
For anyone familiar with or still using the Classic version of Landsat Explorer, you should know that it has been placed into mature support and is no longer being updated. It will still be around to allow time to transition, but we do encourage you to begin using the new app: https://livingatlas.arcgis.com/landsatexplorer
A suite of imagery explorer apps
Landsat Explorer is our second in what is to become a suite of imagery explorer apps. In 2023, we released the Sentinel-2 Land Cover Explorer. Later in 2024, we are considering a variety of additional imagery explorers, so stay tuned.
Sharing the code
In the interest of innovation, all of the source code for these Living Atlas imagery explorer apps is available for anyone to access on GitHub.
Some additional resources
How to make a historical animation with Landsat
Landsat Level-2 archive available in Living Atlas
Landsat Nine: The Legacy Continues
As always, many thanks to the talented team I have the great pleasure of working with:
App development: Jinnan Zhang
UX/UI and cartographic design: John Nelson
Landsat archive and image service development: James Sill, Vijay Pawar, and Samira Daneshgar
Systems engineering: Sreekumar Sreenath

Article Discussion: