The Living Atlas of the World now contains layers about various population and housing topics with data sourced straight from the most recent 5-year estimates offered by the Census Bureau’s American Community Survey (ACS). The layers are updated each year behind the scenes when the newest data is released by the ACS (December), meaning that you are always accessing the most current data offered by the U.S. Census Bureau.
The layers cover topics such as income, age, education, jobs, ancestry, language, and many others. Each layer contains state, county, and tract geography levels, allowing you to tell national or local stories about the data. Each topic is offered in two geographic formats: boundaries and centroids. This blog talks about the layers in depth and includes additional resources about the data and the American Community Survey.
You can easily add these layers into your maps and applications within ArcGIS Online and ArcGIS Pro to quickly learn more about the population and housing in the entire USA or your area of interest. The layers are publicly available, meaning that no credits or subscription are required to use them!
Here are a few ways to start using them within your GIS workflows today:
Browse and find the layers
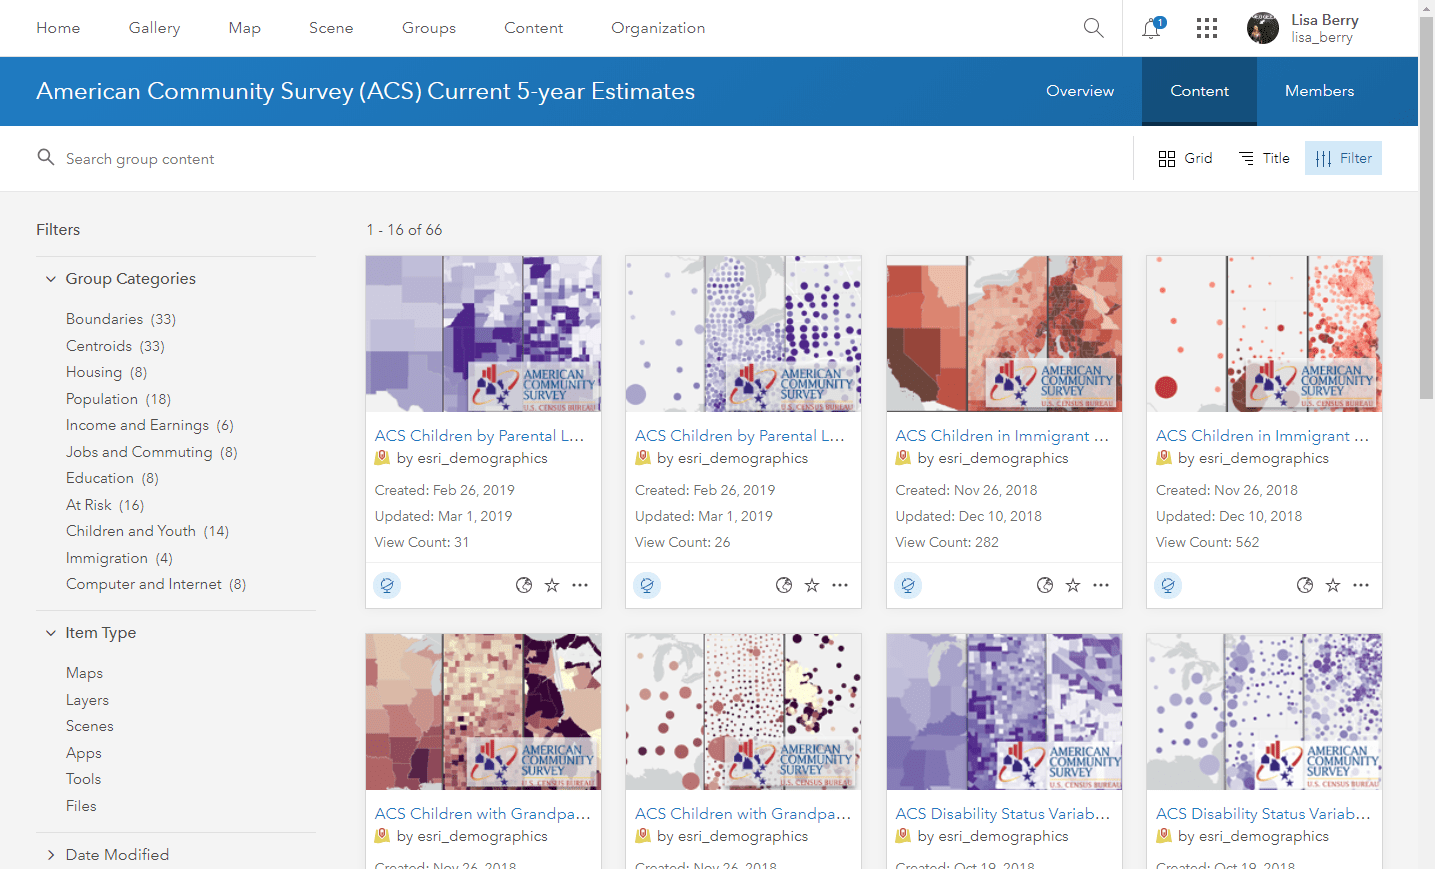
To get started or to learn more about the layers, you can access them from the Living Atlas. Use a search phrase such as “current year ACS” to easily find this collection of data. A few ways to do that are:
- Browse this ArcGIS Online group
Tip: bookmark this group in your browser to easily find the layers when you need them!
- Browse and add to a new or existing map in ArcGIS Online
- Browse and add to your maps in ArcGIS Pro
Use the layers as-is
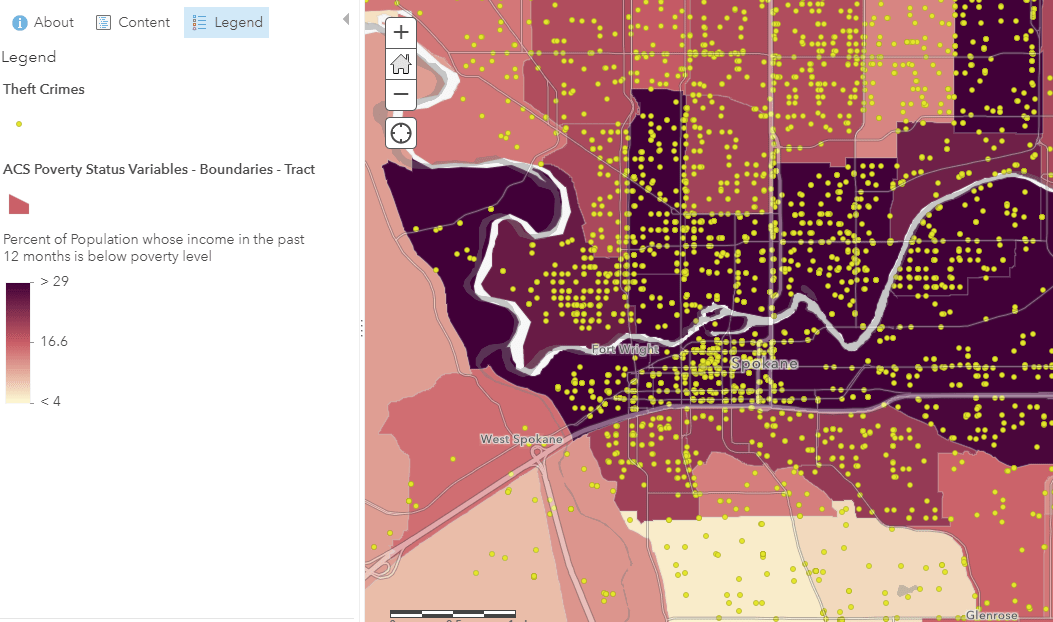
This is the easiest way to use the layers. Because each layer has been pre-configured with symbology and a pop-up, you can quickly plug-and-play the data directly into your maps. For example, I could add the ACS Poverty Status Variables– Boundaries layer into my map to immediately visualize where poverty is better/worse within my area. I can overlay this with my own data, such as crime locations, to provide additional context to any map.
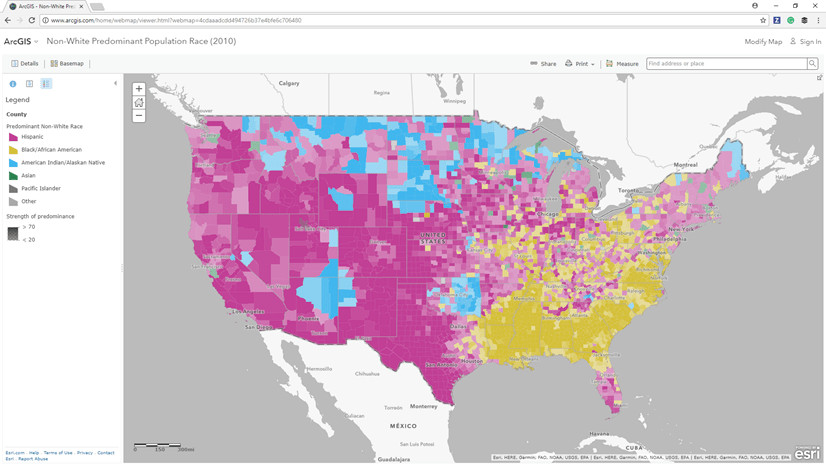
Create your own custom web map by restyling the layer
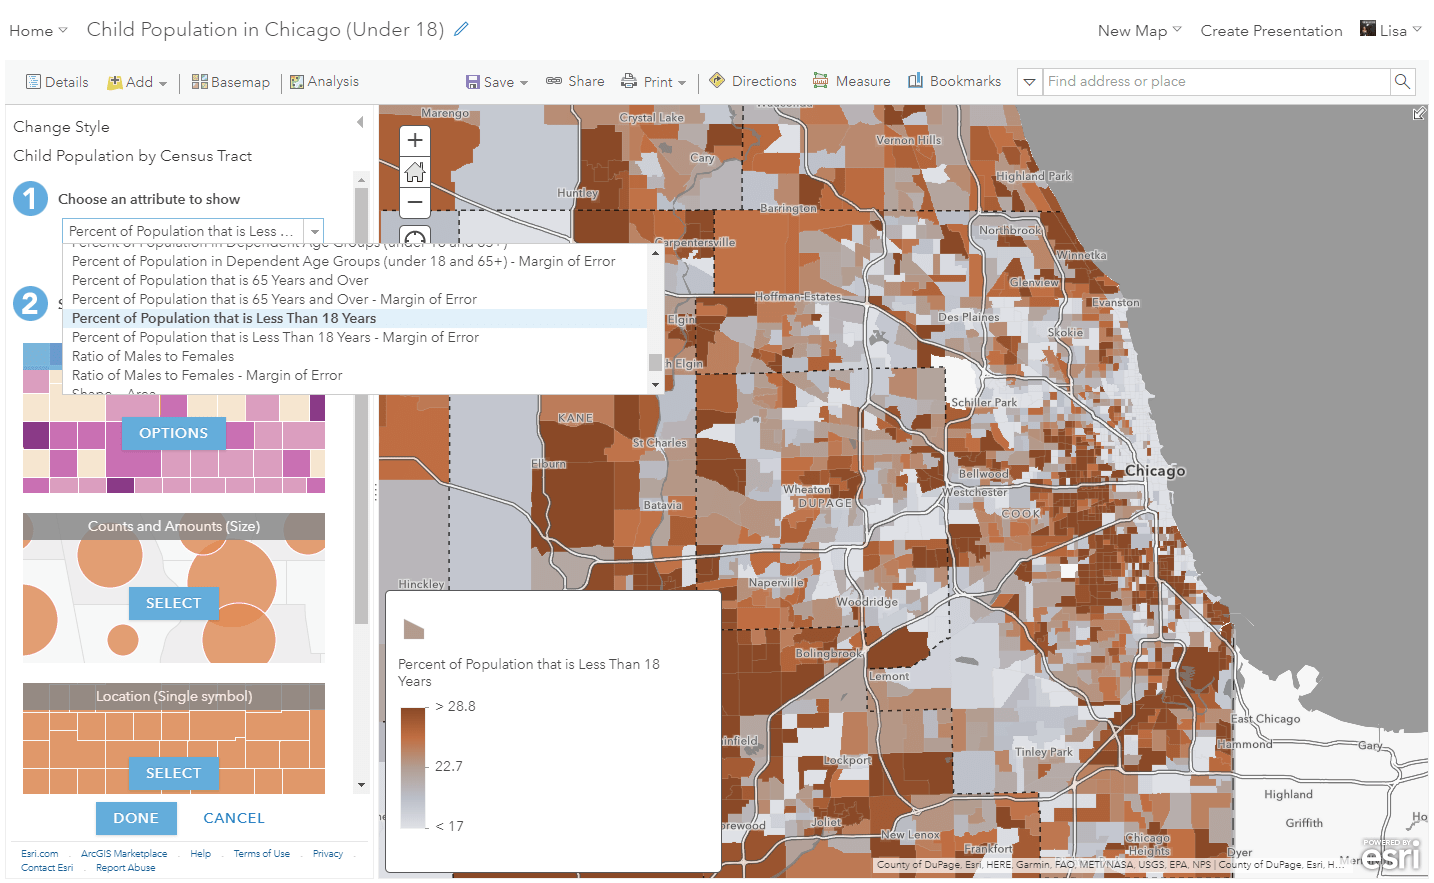
Each layer contains a wealth of attributes from ACS tables, so each layer can be customized beyond the default settings to show any of those attributes. To explore the attributes within the data, you can search through them within the table, the symbology selector, or on the item details page for the item. In just minutes, you can have a fully custom map for your area. For example, I could zoom to my area, add the “ACS Population Variables – Boundaries” layer, and choose to map the “Percent of Population that is Less than 18 Years” attribute to find the youth population in my area. For a step-by-step tutorial about making your own localized map with these layers, you can visit this blog.
Find and use an existing web map created from the layers
Many web maps have already been created from these layers, which could save you time and effort. There are a few ways you can find these:
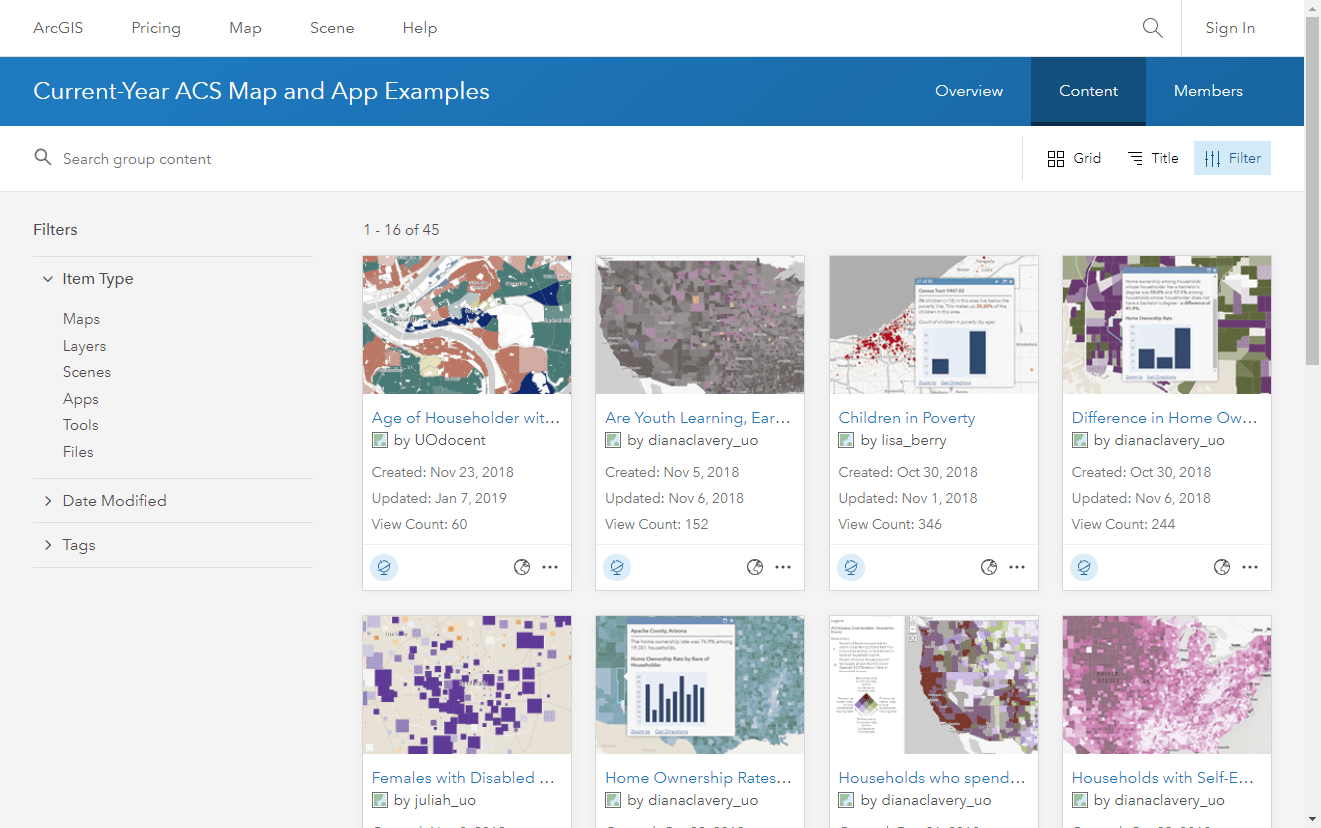
From the Living Atlas website
- Using the same “current year acs” search phrase mentioned earlier, search the Living Atlas website and filter to show only “maps”. Click here for this specific search.
- Add pre-made ACS web maps from the Living Atlas when creating a Story Map. When you add from Living Atlas within a Story Map builder, it will offer you web maps (rather than layers).
From the Esri Maps for Public Policy website
- This app allows you to quickly provide a set of maps about your city or area of interest. Choose various topics, collect maps, and easily share the collection of maps with a custom URL. Search for “acs” to find the maps using the ACS layers. This option provides a quick way to share a set of maps with people who need answers quickly. Here’s an example of a collection for the Seattle, Washington area.
- Many web maps have been collected within this ArcGIS Online group, which can be saved into your content, or favorited for easy access.
Add to your applications and Story Maps
You can easily use web maps calling to these layers within your dashboards, applications, Story Maps, and more. The example below uses the “ACS Youth School and Work Activity Variables – Centroids” layer within custom-made web maps to tell a story about teen employment within the United States.

Add context to the pop-ups in your existing maps
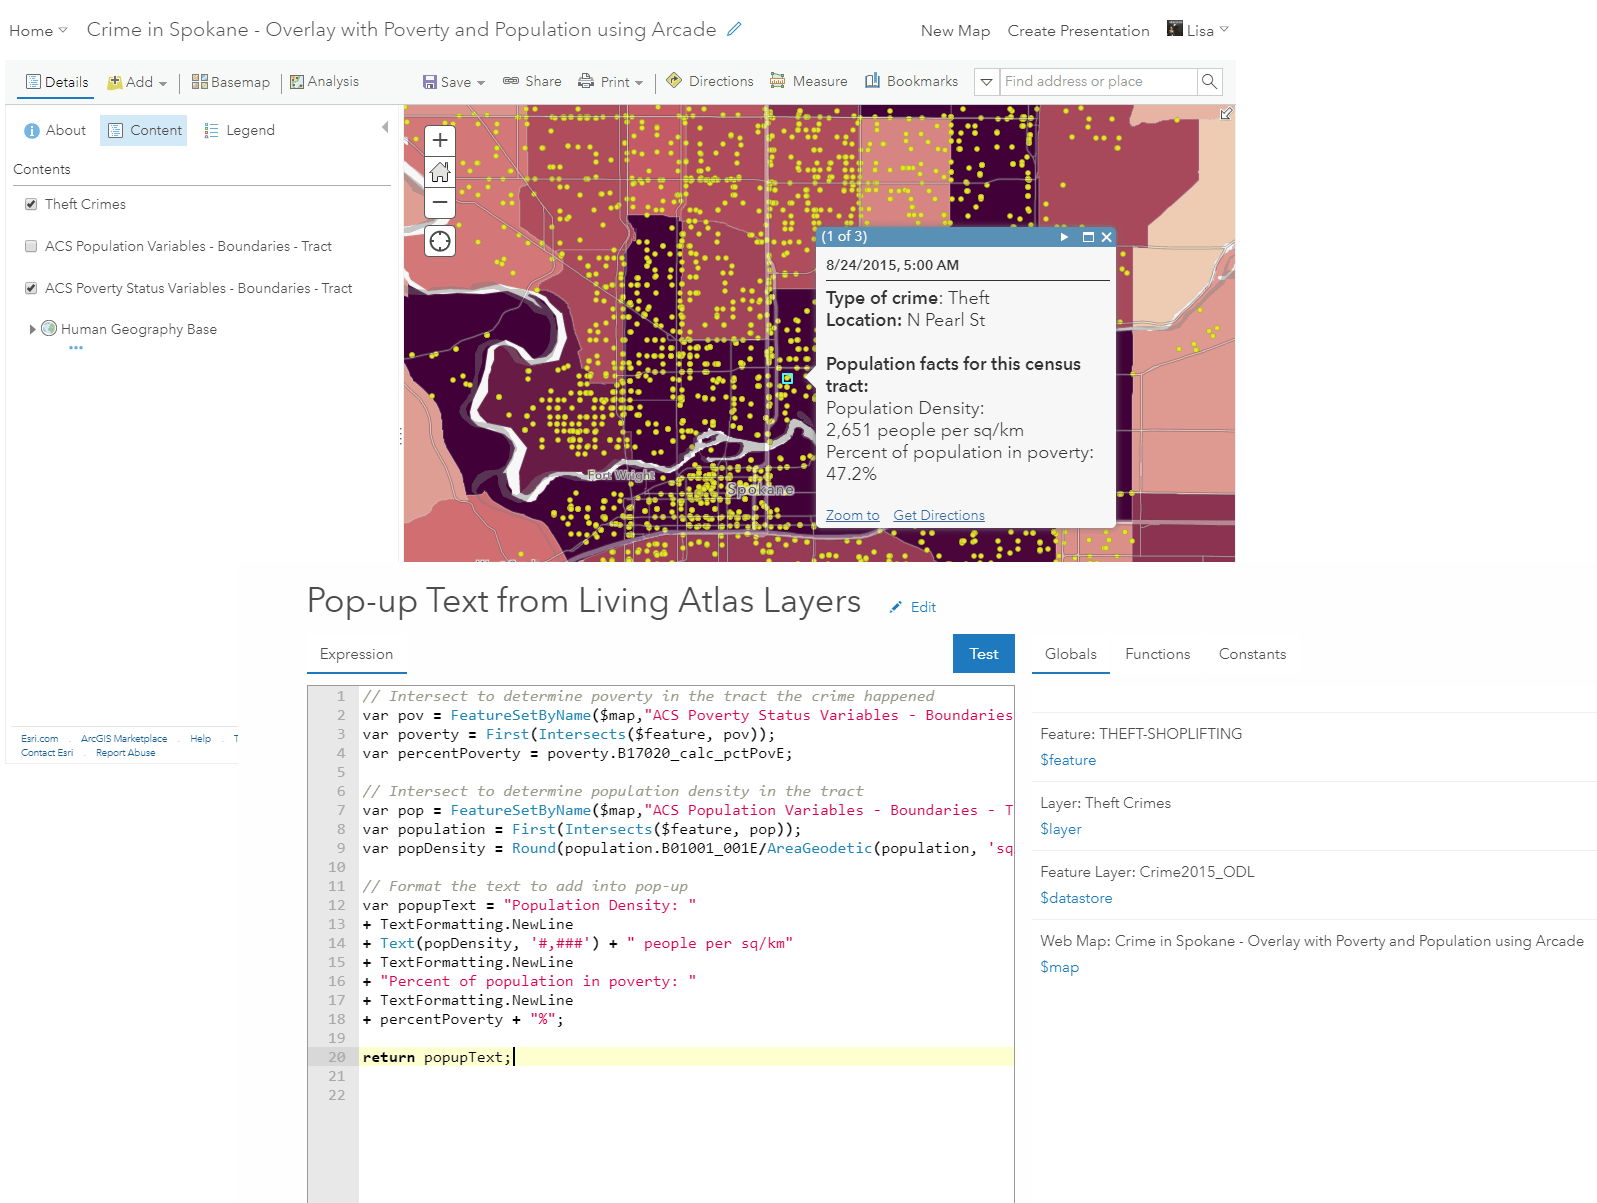
Using the new Feature Set capability within the Arcade scripting language you can query data from Living Atlas layers to add context to your own maps. Intersect your data on the fly or query data from the ACS layers using a common FIPS code from your data. This GeoNet post introduces how to use this technique.
Use within your custom JavaScript applications
Because these ACS layers are hosted feature layers, they are easy to work with in JavaScript applications and scale nicely when your app is used more and more. Query, customize, and perform client-side analytics to enhance any map. This example was shown at the 2019 Developer’s Summit Plenary, and uses client-side queries to provide on-the-fly facts about unemployment within the United States as you zoom into the map.
Get creative!
These are just a handful of different ways to use these American Community Survey layers in your GIS workflows. You can visit the FAQs, or watch the recent webinar recording about the layers to learn more.
We want to see how you’re using these layers in your workflows! If you want to share your maps/analysis, or if you have any questions, feel free to post on the ArcGIS Living Atlas GeoNet page.
Happy mapping!


Article Discussion: