Not all American soils are created equal.
Some are deep and nutrient-rich, requiring very little treatment to grow crops. Other land can scarcely be called a soil. In these areas, plants cling to life on outcrops of rock, with slopes so steep that only the most skilled animals are able to get enough of a footing to graze. The United States has these extremes and everything between, such is its diversity.
What is the practical capability of the soils in your area? You may have had an inkling of what it’s capable of from observing how it’s being used. Is it suitable for grazing or crops, or maybe none of this is happening? Is it because the soil is poor, or is there another factor? Perhaps there is a quick way to find out what activities a particular soil is capable of supporting?
Living Atlas Team has released two new image layers, produced by the USDA NRCS, which reveal the practical capability of soils in the United States in eight classes. The first layer, USA SSURGO – Irrigated Capability, classifies the potential of soils in the United States when irrigated. The second layer, USA SSURGO – Nonirrigated Capability, classifies the soil’s potential without irrigation.
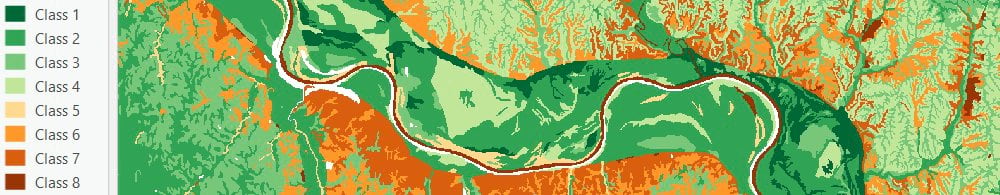
The first four classes are symbolized in green. These are soils suitable for cultivating crops. Note that the shades of green in these first four classes become paler as you go down the list from I to IV. Class I soils have the fewest restrictions, then growing crops on soils II, III, and IV present more and more management challenges with each successive step.
As you get to Class V, VI and VII soils, the map colors change to yellow, then orange. In these areas you encounter lands that are more suitable for grazing or forestry. Class VIII soils, shown in sienna, are lands that are not suitable for forestry or grazing, quite often these have steep slopes, little or no topsoil, or are urban hardscapes.
Analysis example: Geoprocessing Using the Nonirrigated Capability Layer in ArcGIS Pro
Let’s say you’re making maps to support economic analysis and you would like to analyze the potential for agriculture in soils across Missouri. Your goal is to create a table with the area of each capability class in every county in Missouri. If you’ve never used an image layer in analysis before, the following steps will show you how to get started:
You will need an internet connection to work with map layers in the Living Atlas of the World. The source of your information will be the new image layer, created by the USDA Natural Resources Conservation Service, called USA SSURGO – Nonirrigated Capability Class in the Living Atlas of the World. You will analyze each county in Missouri using the Tabulate Area geoprocessing tool.
First, let’s add a few layers from the Living Atlas to ArcGIS Pro. The first layer will be the counties.

To add the counties layer, click on the map tab on the top ribbon. Then click the add data button. In the dialogue that comes up, click the tab on the left that says “Living Atlas.” In the upper right search box, search for “usa counties”. Click on the “USA Counties” feature layer, then click OK to add it to the map.
Next, let’s set a definition query so that only Missouri’s counties are showing. Right click the USA Counties layer in the table of contents, then click Properties. In the dialogue that comes up, click Definition Query on the left tab. Complete the query so that it says State Name is equal to Missouri as shown. Click apply.

Next let’s add the USA SSURGO – Nonirrigated Capability Class layer from the Living Atlas of the World. Click on add data again, and in the dialogue that comes up, click on the Living Atlas tab. In the search box on the upper right, type “nonirrigated”. Click on the image layer called “USA SSURGO – Nonirrigated Capability Class” and click OK.

Before we go further, let’s make sure the map in ArcGIS Pro is ready for analysis by giving the map an equal area projection. Right click the map in the table of contents, then when the dialogue comes up, click on the Coordinate Systems tab. Type “albers” into the search box. Under continental, then North America, click on the “NAD83 Contiguous USA Albers” coordinate system, then click OK.

Let’s use the Tabulate Area geoprocessing tool to count the area of the eight capability classes in each county in Missouri. First click the analysis tab on the top ribbon, then click tools. The geoprocessing pane will appear on the right. In the search box, type “tabulate area” and hit the enter key. The Tabulate Area tool should appear at the top of the list. Click on it.
Where the dialogue asks for an Input raster or feature zone data, choose USA_Counties. For the Zone field, choose County Name. The tool will tabulate area from the image layer for each unique county name it finds.
Where it says Input raster or feature class data, choose the image layer “USA SSURGO – Nonirrigated Capability Class”. For the class field, choose Class Number. The class number field is the capability class of each soil map unit represented by a single integer. The processing cell size will default to the cell size of the image layer.

Let’s take a look at what’s in the Environments tab.
Where it says Output Coordinate System, click on the globe icon to bring up a dialogue, and choose the same “NAD83 Contiguous USA Albers” coordinate system projection you chose for your map.
Pan and zoom the map so the State of Missouri fits neatly in the map window, then where it says Processing Extent, choose “same as display”. This saves time by limiting the processing to only the area you need to analyze Missouri.
Now click Run. This tool should take about 10-20 minutes to complete.

The result is a table with the area (in square meters) for each of the eight capability classes.

I also created a companion video to step you through this process. In the video I continue beyond the table to demonstrate how to make an online feature layer you can share which shows the percentage of each class in a bar graph.
You can use the video to follow along as you do these blog steps in ArcGIS Pro. To skip ahead to where I share the table as a feature layer in ArcGIS online, then create a bar graph in the popup showing the percentage of each class in each county, skip to 14:25 in the video.

Article Discussion: