Organization administrators are always looking for new tools and methods to better understand and manage their ever-growing ArcGIS Online content in an efficient way. Some administrators would like to monitor and analyze the trends in traffic to specific items in a period of time. Others are looking for a better strategy to deprecate or retire content that has not been used for a substantial period of time. Sometimes administrators are asked to gauge the success of certain items created by their members over time; other times they are simply searching for evidence to prove the value of ArcGIS Online or GIS overall to their organization’s management.
No matter what your objective is, the latest addition to the administrative reports family, the item view count report, will help you. Starting with the February 2023 update of ArcGIS Online, administrators can export the view counts of maps, scenes, and apps in your organization over a specified timeframe to a single CSV file, and understand which days, weeks, or months users are viewing and interacting with this content the most and the least.
Introducing the new item view count report
If you are new to administrative reports, we recommend that you start with this blog article, which gives you a quick rundown of the types of reports available, in addition to the new item view count report, and describes how to create and schedule the reports, as well as how to find and run them.
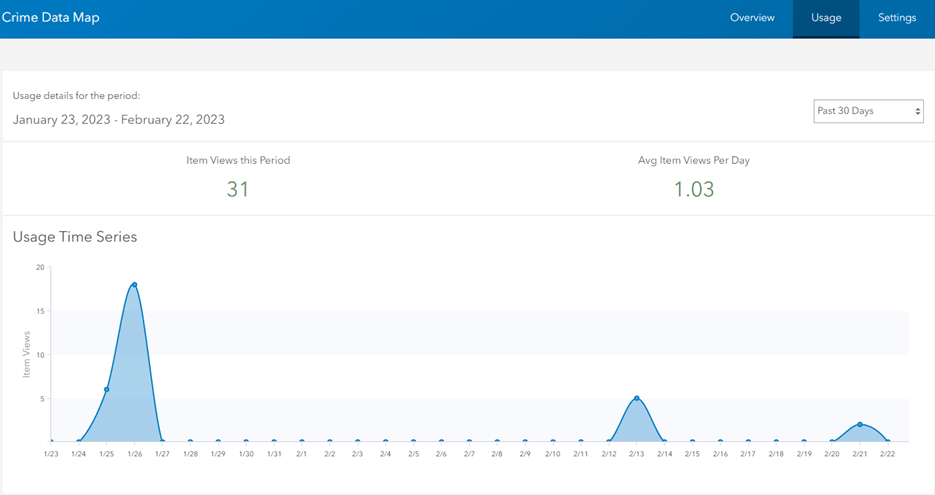
The view count of an item refers to the number of times an item has been viewed or opened. You can find the view count of an individual item (such as maps, scenes and apps) on the Usage tab of the item page.
With the February 2023 update of ArcGIS Online, organization administrators can now generate a single report that shows the item view counts over a week, month, quarter or year.
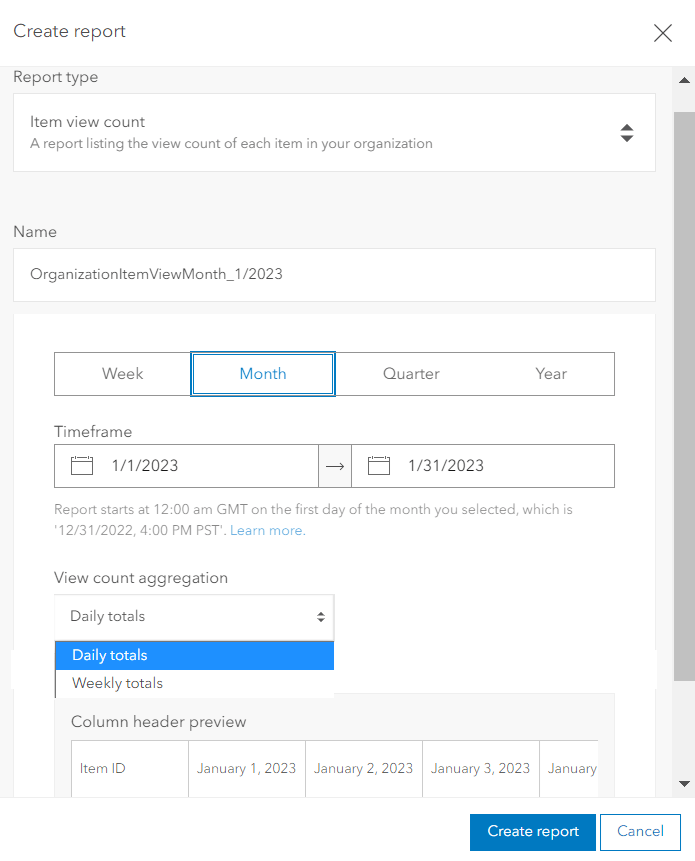
When generating a report that includes view counts over a specified month, you have the option to aggregate the view counts by each day or each week. The month covered in the report starts from the first day of the month you selected.
When generating a quarterly or yearly report, you can show view counts for each week or each month. The quarter starts from the first day of the quarter you selected.
When you generate a weekly report, the report shows a daily view count for each item. The week starts from 12:00am GMT on the Monday of the week you selected.
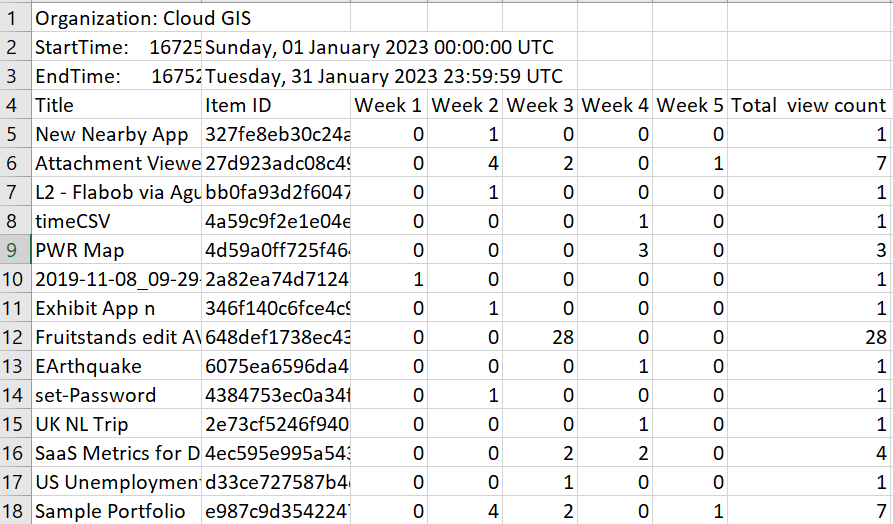
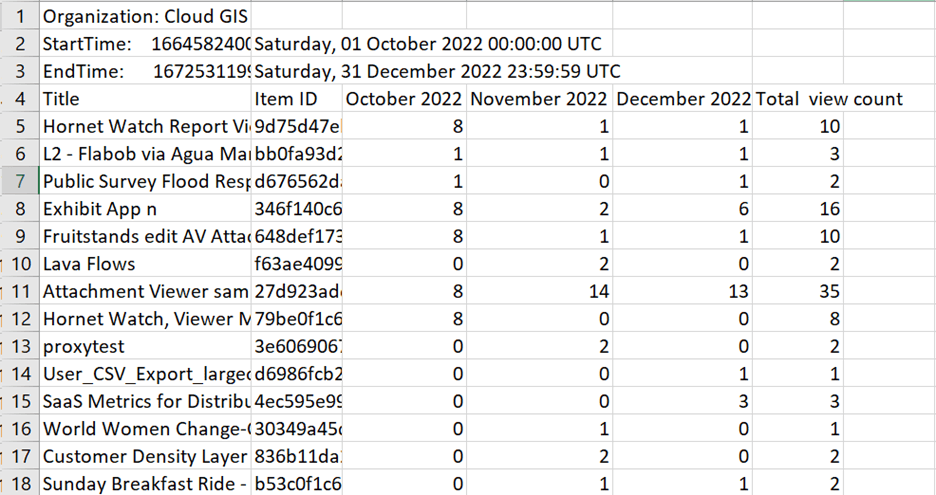
Each report includes the name of the organization, the start and the end time of the period you select. At the last column of each row, there is a sum for the “total view count”.
You can easily sort the view counts to find out the content that is most or least viewed in your organization.
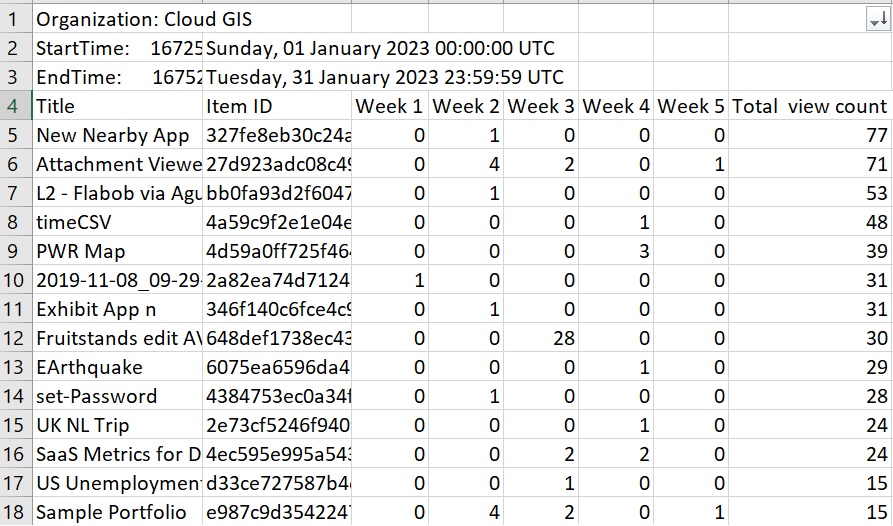
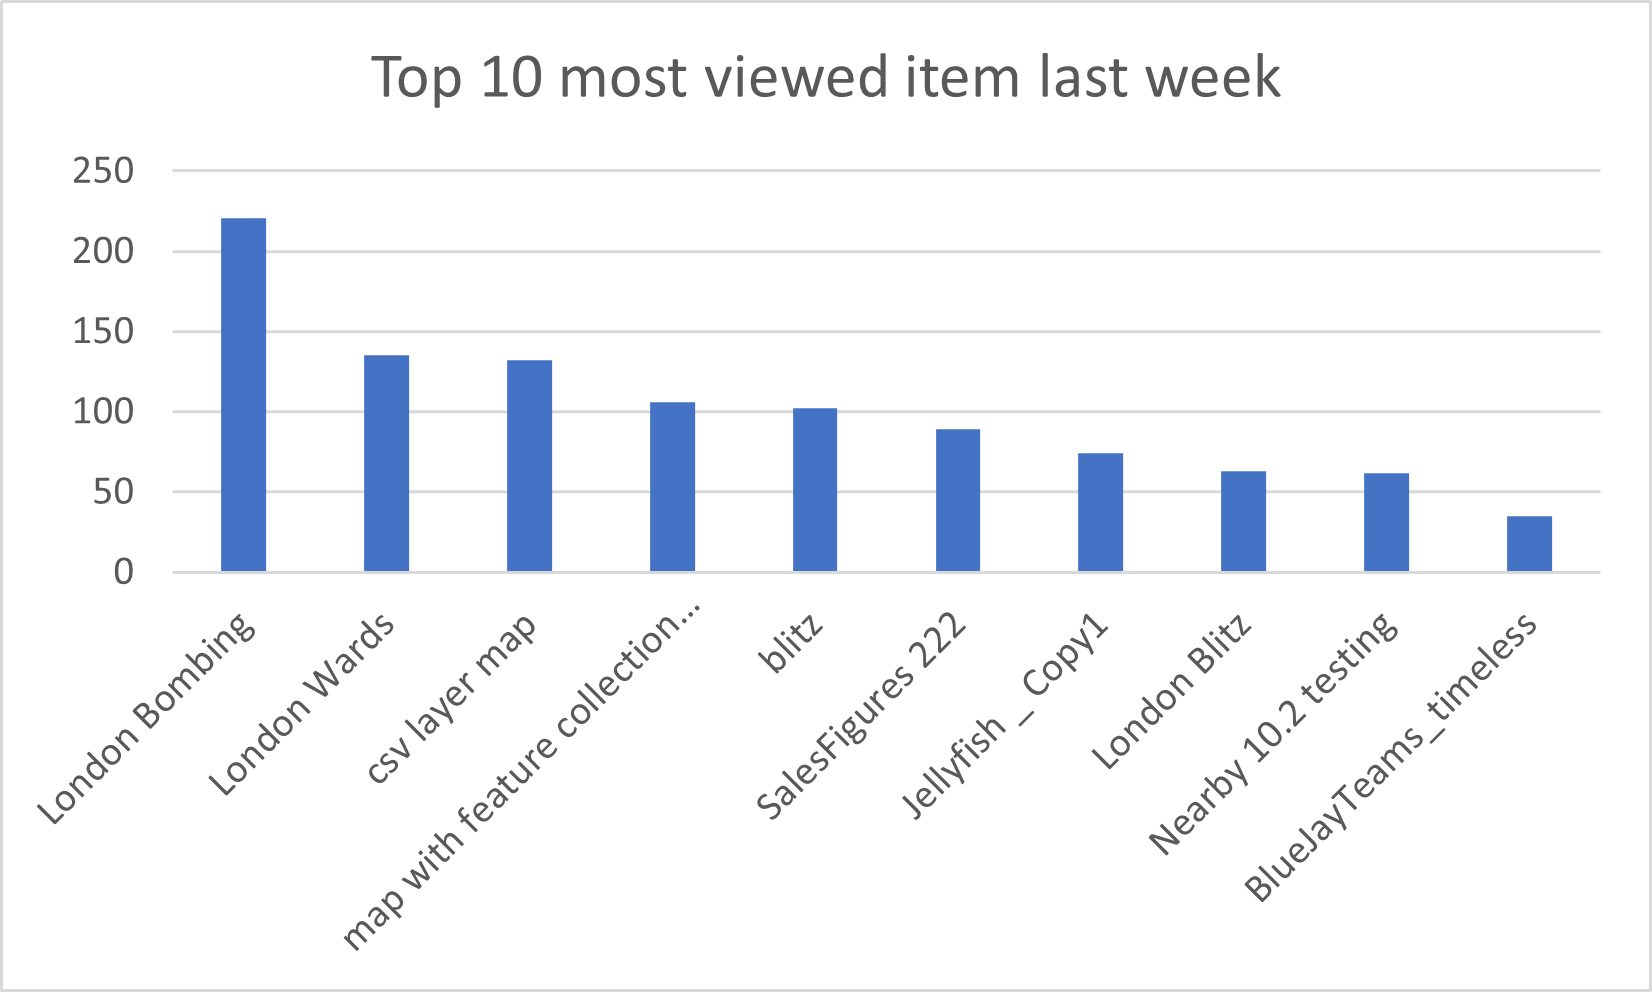
Alternatively, create some interesting graph to view the traffic trend from the CSV file.
Below is an example of the item view count report over a quarter, aggregated by each month
A few extra notes
The item view count report can be generated for a specified time period in the last two years. For example, when you generate a report on Feb 22nd, 2023, the item view count information is only available starting Feb 22rd, 2021. The earliest quarter available to create a report is the second quarter of 2021 and the earliest year available is 2022.
In addition, only items with a positive view count over the chosen duration will show up in the report. The report with the same time frame are not allowed to create twice, and you may receive an error message because of this situation.
Deleted items will be included in the item view count report but the title will be displayed as “–Deleted Item–“

The team is working on scheduling the item view count report to be created but currently it’s not available.
Learn more
The following additional resources can help you learn more about organization administrative reports.
- Supercharge your ArcGIS Online Organization Management with Reports (including a 6-minute tutorial video)
- Introducing Organization Reports for ArcGIS Online Administrators
- New organization reports for ArcGIS Online administrators
The growing family of organization administrative reports brings a lot of possibility and creativity to managing your organization’s content and its usage, credits, members, and activities. We can’t wait for you to try them out and keep sharing your ideas and thoughts about how you manage your ArcGIS Online resources and other reports that you would like to see in the future. For more information about administrative reports, see the ArcGIS Online help.

Article Discussion: