ArcGIS Online Map Viewer is fast, intuitive, and flexible. It is built with the latest Web GIS technology: ArcGIS API for JavaScript 4.x, which supports advanced and performant geospatial data visualizations. With all of these cutting-edge capabilities, we see one question nearly every day: when will analysis tools be available for Map Viewer? And to that end, we have an exciting announcement. Analysis tools are now available in Map Viewer with ArcGIS Online’s latest update!
The New Analysis Experience
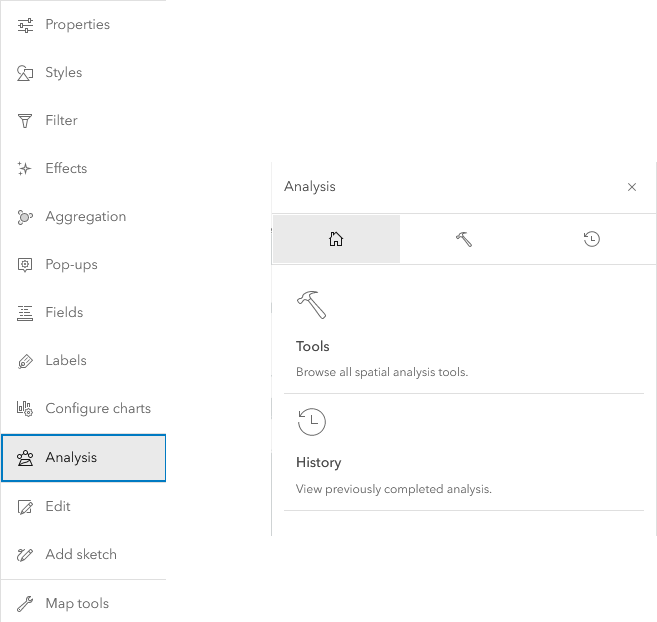
In Map Viewer, there is a new way to access analysis. To start, select “Analysis” from the Settings (light) toolbar, which opens the analysis pane. The analysis pane has two options: tools and history.
Analysis Tools
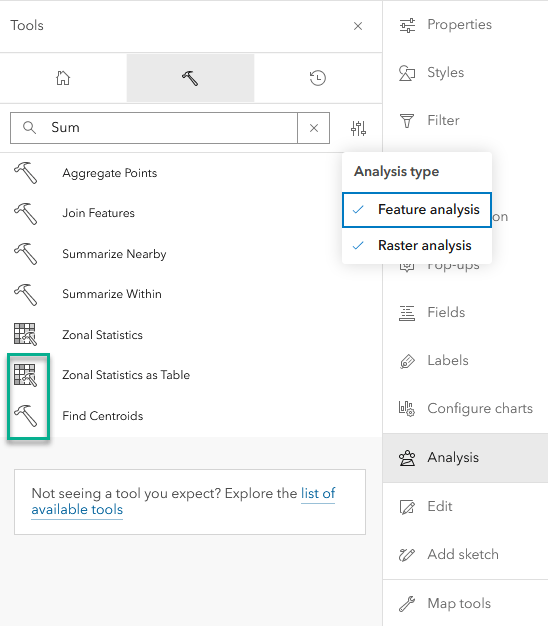
Tools in Map Viewer include Feature Analysis tools and Raster Analysis tools. (The latter is available if you have the ArcGIS Image for ArcGIS Online user type extension.) You can filter tools based on the analysis type, or search via a keyword to find the relevant tools. Like in Map Viewer Classic, you can still browse and select a tool from the same categories. Note that you can differentiate a feature tool from a raster tool based on the different icons.
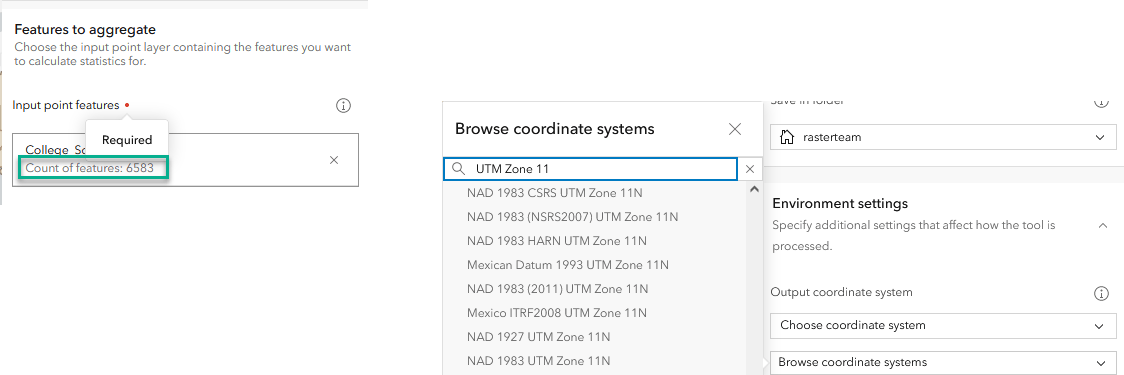
We added more details about the tools in Map Viewer to make them easier to use. For example, required parameters are marked with a red dot. Once a layer is added, you can see how many features will be analyzed. With the new Environment Settings, you can now specify a projection for the analysis output layer, it does not have to be the same projection as the input layer.
We also made it easier for you to estimate the required credits prior to running a tool. The analysis tools in Map Viewer consume the same number of credits as in Map Viewer Classic.
With the initial release in February 2023, Map Viewer supports most feature analysis tools that users have been working with in Map Viewer Classic. The video below provides an example of using the Trace Downstream and Enrich Layer tools in Map Viewer to predict lava flows and estimate the potential impact.
Notice that some of the tools in Map Viewer Classic have been renamed in Map Viewer to make it easier for new users to find them. For example, the Create Drive-Time Areas tool in Map Viewer Classic is called Generate Travel Areas in Map Viewer. Check here for the most up-to-date list of tools that have been renamed, and the list of tools that are supported in Map Viewer.
For users with the ArcGIS Image extension in Map Viewer, you now have access to 24 raster analysis tools with this release; however, raster functions and raster function chain editor are not yet supported in Map Viewer. The outstanding analysis functionality will migrate to Map Viewer in future releases. Read the What’s New in ArcGIS Image for ArcGIS Online blog for more information.
Analysis History
Analysis history is an exciting new functionality in Map Viewer. For those who are familiar with data analysis and data science, you know that analysis is an iterative process. Analysts often need to rerun the same analytical procedures again and again to change parameters and to look into warnings and errors. In Map Viewer, each time you run a tool in a web map, information about the tool and its parameters are saved in History. All tool runs are added to the analysis history, including successfully run, failed, or canceled jobs. You can view detailed information about each job that was run. For example, the result generated by the tool, when the tool was finished, how long it took to run the tool, any warning or error messages, and what the tool’s input parameters were, including the environment settings. You can reopen and run any of the tools in History with the same or modified parameters. This video demonstrates using analysis history to simply the workflow when investigating fire station response time with different traffic conditions.
Once a web map is saved, analysis history is also stored with the web map and can be shared with anyone in the organization. Analysis history helps you to better understand the workflows you used to create the data and layers in your web map project. It is also a great way to share your online analysis with others.
You can get started with analysis tools in Map Viewer today! Keep in mind that charts are also available in Map Viewer, so you can include charts for exploratory data analysis and visualization, and for interpreting and communicating analysis results. We will continue to add more tools and functionality in the coming year.
As always, we would love to hear your experiences and comments!
Happy analysis!
Note: an update of the Map Viewer analysis was made available in June 2023. Check here for what’s new.


Hi Jian and Corinne,
Thanks for the update, it’s great to see analysis tools back available in the map viewer. We currently use the Join Features tool in one of our workflows, however, I notice in the limitations for the new version that “The option to create results as hosted feature layer view is only available in Map Viewer Classic”. This element is essential to our workflow as the join needs to update whenever either of the two join layers are updated.
Do you know if this limitation will be overcome anytime soon?
Thanks
Anthony
Hello, nice feature. Is there any way to obtain statistics over a raster layer ? For instance an histogram of the raster values within a polygon ?
Hi Julien,
Check out the Zonal Statistics and Zonal Statistics as a Table tools. Both can be used to summarize the values of a raster dataset in zones or areas (polygons). We are not supporting zonal histogram yet in ArcGIS Online but it’s in the plan. I would be very interested in hearing about your detailed use cases. Please feel free to contact me at jlange@esri.com. Thanks.
This is a great, and well needed, addition to the Map Viewer in ArcGIS Online. When or what version will this be added to ArcGIS Enterprise?
Thanks!