Many of you have sent us great feedback since the release of the spatial analysis tools in Map Viewer. We are excited to announce that the ArcGIS Online June 2023 release includes significant updates for analysis tools in Map Viewer. Here are a few highlights:

- More Tools
- Find by Attributes and Location
- Raster Functions
- Map Level Environment Settings
- Join Results as Hosted Feature Layer View
- Using Sketch Layers
- Browse Layers
More Tools
With the June update, we added six feature analysis tools and four new raster analysis tools in Map Viewer. Map Viewer now has 28 feature analysis tools, including all Map Viewer Classic tools. For example, popular workflows such as extracting data and finding features by attributes and locations are all available in Map Viewer. For raster analysis tools that are part of the ArcGIS Image for ArcGIS Online extension, many of the tools are brand new and only available in Map Viewer.
Find By Attributes and Location
It is a typical GIS use case to find a subset of features based on their attribution or location. For example, you may want to know how many residential properties were affected by a recent flood by finding all properties listed as residential and within the flood boundary. In this case, you can use the new Find By Attributes and Location tool in Map Viewer. It allows you to specify spatial and attribute criteria and create output features in your study area that match the queries you build. This tool combines two tools from Map Viewer Classic: Find Existing Locations and Derive New Locations. When using Find By Attributes and Locations, you can return whole features (Find Existing Locations) or parts of features that meet the requirements (Derive New Locations).
In the following video, you can see how to build queries to find urban residential areas one mile from the roads in a land cover layer that are also within the project boundary.
Raster Functions
In addition to raster analysis tools, raster functions are now available in Map Viewer when you have ArcGIS Image for ArcGIS Online. You can use raster functions in Map Viewer or create raster function templates from the content page through the new item dialog. From the item page of the raster function template, you can open the Raster Function Editor to build function chains to create imagery processing and analysis workflows.
Check here for more information on what’s new in ArcGIS Image for ArcGIS Online, including raster tools and functions.
Map Level Environment Settings
You can now specify analysis environment settings for your web map using the Analysis Settings available in the analysis home pane.
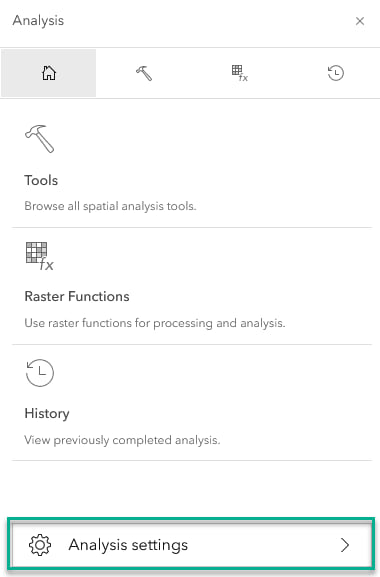
The map level environment settings are saved with your web map and will be automatically used by all tools or functions in the same map. For example, suppose you would like to use a specific coordinate system or extent for all your analysis completed on a map. In that case, you can set and save the preferences in Analysis Settings (see the video below), and the settings are applied to all subsequent tool and function runs. If desired, you can override the map-level environment settings for a particular analysis by using the environment settings at the bottom of each tool or function.
Join Results as Hosted Feature Layer View
Creating results as a joined view is useful so the join results would update automatically when either of the two source layers is updated. The ability to create joined hosted feature layer view is now available on the Content page. For more information, check out the instructions for creating a joined hosted feature layer view.
Using Sketch Layers
In Map Viewer, you can create a sketch layer to add point, line, and polygon features.Creating a sketch layer is a good way to add a small number of features to a map. Analysis tools now support using sketch layers as inputs.
Browse Layers
You can now browse for layers from an analysis tool rather than only using layers already added to your map. Click Browse layers in the tool inputs to search for layers not currently on the map.
The video below shows how to select a boundary layer from ArcGIS Living Atlas to use as a tool input.
In addition to the highlights mentioned above, we have improved various analysis workflows in this release. For instance, the Generate Tessellations tool now supports H3 binning, a hierarchical indexing system developed by Uber that uses hexagons to tile the Earth’s surface.
Remember that Map Viewer analysis includes new functionality such as analysis history and charts for exploratory data analysis and visualization. We will continue to add more tools and functionality in the coming year.
Happy analysis!

Article Discussion: