With the February 2024 release of ArcGIS Online, you can now use the Calculate Composite Index tool in analysis in Map Viewer. Let’s use the tool to create an Urban Heat Risk Index for Washington D.C., to identify which census tracts might be at the greatest risk of the adverse impacts of extreme heat events.
First, we’ll grab the U.S. Urban Heat Island Mapping Campaign layer from the Living Atlas. This layer includes variables about temperature and demographics for several cities in the U.S.

Zooming in to Washington D.C. we can see the afternoon temperature anomaly – this shows how the neighborhood temperature compares to the city-wide temperature. The map reveals some interesting patterns – certain areas of the city in red are hotter than others. Since climate and weather don’t vary much over short distances, the temperature anomalies we see across the city are due to differences in the landscape, such as the amount of tree cover or development.

But this map only tells us about the physical phenomena. If we want to understand who is most at risk of extreme heat events, we need to create a map that brings together variables about temperature with variables about the population at risk.
In Perform Analysis, open the Calculate Composite Index tool, which you can find in Analyze patterns.

Inside the tool, load the urban heat islands layer as the Input features or table.

In Input variables, select the following three variables – one that indicates exposure to heat, and two that indicate vulnerability to heat:
- Afternoon Temp Anomaly, with a Weight of 2. We’ve made the weight of this variable two times more important than the others because it’s a critical factor in determining the risk of high heat events.
- Poverty %, with a Weight of 1
- 65 and older %, with a Weight of 1

In Index settings, change the Minimum to 0 and the Maximum to 100. This means the output will be rescaled to make the minimum value be 0 and the maximum value be 100, so it is more interpretable. We’ll use the defaults for the rest of the parameters.

Set the Output name to any name of your choice.

In Environment settings, set the Processing extent as Display extent. Make sure all of the Washington D.C. area census tracts show in your map extent.

The results show us the darkest purple color in places where the afternoon temperature anomaly is higher, and where a higher percentage of people are in poverty and a higher percentage of people are over 65+.
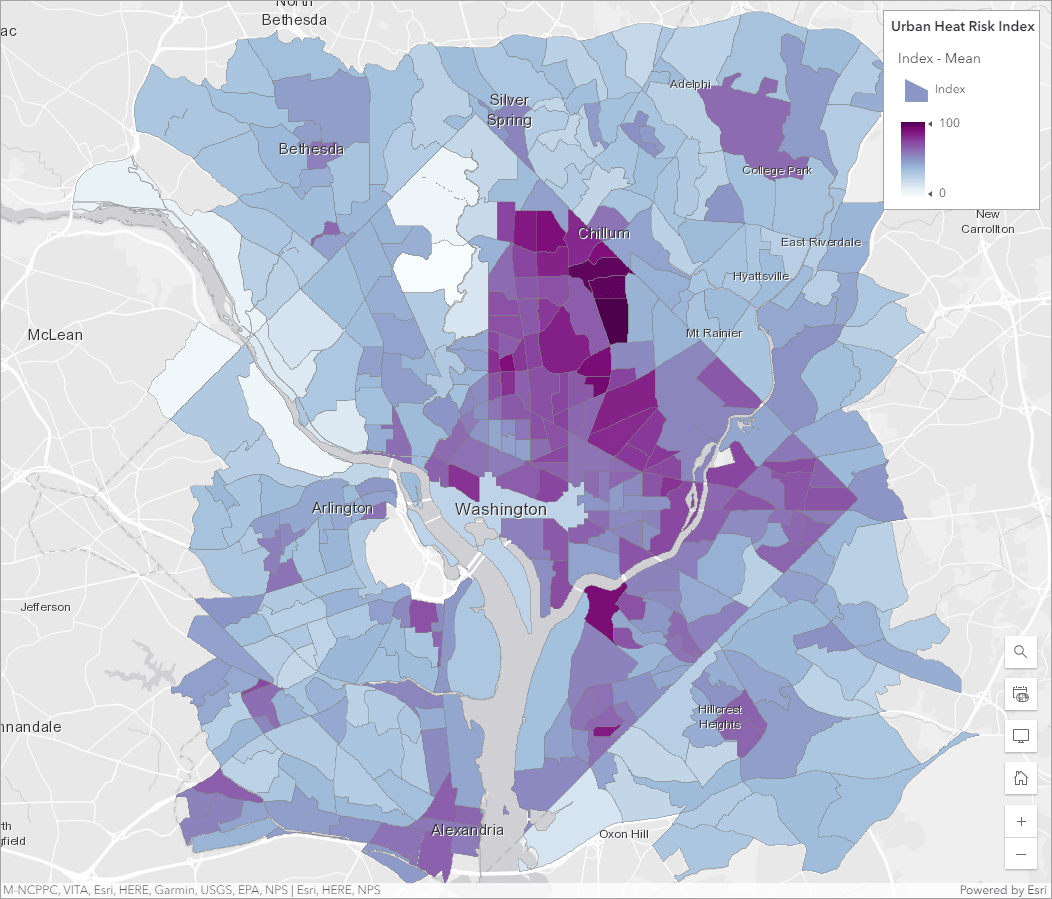
These are areas where, during an extreme heat event, the adverse impacts might be felt the greatest. Local government could use this map to help them prioritize where to add new cooling centers.
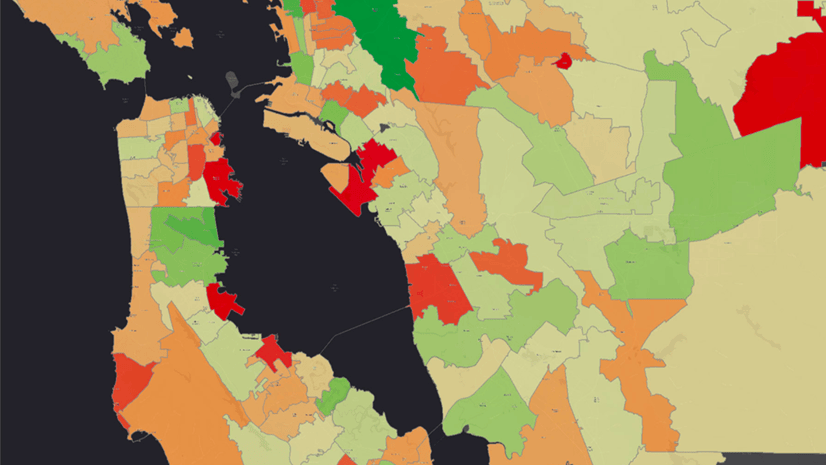
We can run the results of the Calculate Composite Index tool through the Find Outliers tool to gain insights into the spatial patterns of the results. Use the Index – Mean field as the Analysis field then use defaults for the other parameters.

The output of this tool shows us different types of clusters and outliers in the index:
- The pink locations are hot spots where the index results are high.
- The pale blue locations are cold spots where the index results are low.
- The dark blue locations are low high outliers – the index result is low relative to the neighboring census tracts.
- The red locations are high low outliers – the index result is high relative to the neighboring census tracts.

Looking at the results this way can help us identify interesting spatial patterns in the data that we might use to inform policies and remediation efforts. For example, we might decide that the pale blue areas have less need for cooling centers, but any cooling centers we do add in these areas should be targeted in the red locations as these have higher risk relative to their surrounds.
We are so excited to see what you do with this tool! Composite indices are powerful tools that can help make potentially life changing decisions in allocating resources. With the new Calculate Composite Index tool in ArcGIS Online, it’s easier than ever before to make your own. We highly encourage you to take the time to understand how all of the decisions you make in the tool can impact your results. We’ve created the following resources to help you do this:
- The How Calculate Composite Index works documentation explains the importance of each parameter in the tool, and considerations you need to know to make the right choices.
- The Creating Composite Indices Using ArcGIS: Best Practices technical paper outlines the entire workflow of creating an appropriate composite index, including index design, appropriate choice of variables, and mathematical considerations in the selection of methods.
- The recording of the Esri webinar Creating a composite index introduces you to some of the most important concepts and considerations in creating an index.
Wondering when Calculate Composite Index is coming to ArcGIS Enterprise? Very Soon! You’ll find it in Map Viewer in the ArcGIS Enterprise 11.3 release. In the meantime, you can always access the same tool from ArcGIS Pro.


This script is going to be such a huge help but I am running into an error when I run the script as coped: it says that: name “GetParameter” is not defined. Is it because I am running ArcGIS Pro 2.4 perhaps? Thanks!
Hi Carissa,
This article discusses creating a script tool in ArcGIS Pro 2.8. For best results, please consider upgrading to the latest ArcGIS Pro version.
Best,
Jonah
Anyone try this? I can’t get the Time Zone to set correctly. After publishing, the feature service reflects UTC for our data’s date fields even though I set the “timezone” parameter to “Pacific Standard Time”.
Hi there,
I have created the publish web feature layer, but the input is “map”. What I want to select and publish is a “layer” in the content pane. Could you please tell me how to solve the problem? Thanks in advance.
Best
Leo
Hi Leo, please see this code sample: https://pro.arcgis.com/en/pro-app/latest/arcpy/sharing/featuresharingdraft-class.htm#GUID-8E27A3ED-A705-4ACF-8C7D-AA861327AD26
Hi Jonah, you sent me to this blog from another post last week (thank you!) and I’ve been working through the above and have come across the same problem as Leo. I’ve had a look at the code sample you supplied, is there a way to create a script tool using that code or does it need to be run as a standalone Python script? Or is there a way to alter the code for this blog to look at features rather than map files? Many thanks in advance
Hi James,
The code provided in this blog should be able to be modified with the sample code provided in the FeatureSharingDraft help topic. You’ll need to modify the script tool (code and script tool parameters). If you run into issues, I recommend posting in Esri Community or reaching out to Technical Support.
Best,
Jonah
This is great but I can only get it to work if I leave share_groups blank or just use one group name. Otherwise I get 0x800 “This value is not a member of” Any ideas? I’m separating group names with commas. I’m running ArcGIS Pro 2.9.
Hi Robert,
Good question. Since you have multiple groups, you will need to modify the share_groups parameter to accept multiple values. To do this, check the Multiple values check box when specifying the Parameter Data Type.
Best,
Jonah
That was all I needed, thanks.
Thank you very much for posting this! Is there a way to set the Portal connection where the data will publish to? It looks like it defaults to whatever Portal you are/were signed in to last. I have several Portal/ArcGIS Online connections in Pro but would like to specify which one it publishes too. I plan on setting this up as a scheduled task so I need to make sure it publishes to the right Portal. Thank you!
Hi Nicholas,
Yes, you can use the SignInToPortal ArcPy function: https://pro.arcgis.com/en/pro-app/latest/arcpy/functions/signintoportal.htm
Best,
Jonah
Thank you for posting this article. I am having an issue with seeing my Portal connection in the output folder though. Is there a workaround for this? If I add the SignInToPortal ArcPy function, will this allow me to view the Portal Connection in my output folder?
Hello, I implemented this script tool and generally it works well. We do have a weird issue where if we try to use it to overwrite an existing hosted table, it works, but converts the item to a hosted feature layer. We need these items to persist in AGO as hosted tables. Any thought to adding a parameter to tell it to overwrite as a table rather than a service? or choose no geometry type? thanks!
I’ve downloaded and used the model as it is used in the demonstration map and it uploaded the layer directly to my AGOL content pane, however, when I attempt to run the Publish Web Feature Layer in my own map, the tool runs for a very extended period of time seemingly without end. Is there an option I should be selecting that is different? I selected to run the tool exactly how I had it in the demo as well.
I’ve downloaded the script and got the Model working with one exception, I have a date field and I can’t get it to publish in Eastern Time Zone. What should I be putting in the Time zone parameter? I’ve tried EDT and Eastern_Daylight_Time, but the date field in the web layer is showing UTC. As a side note, when I query the AGOL rest the date field is in EDT.
Thank
Steve
Hi Steve,
If you try “Eastern Standard Time”, I think it should work.
Best,
Jonah
I’ve tried running this script but I get a traceback error to lines 30, 68, and 122 and a ValueError: Missing target server. I copied the script over directly and used the correct inputs/configurations, so I’m not sure what the issue is. Any ideas?
I have successfully run this script within a model in a project, but I have not yet had success running it as a scheduled task. Here’s the error that I see in the log after attempting to run it as a scheduled task:
I have checked and re-checked the script and parameters, but all appears to be set up correctly.
@Michael Olkin did you ever fix this issue? I am experiencing the same thing. I can run the model fine and it publishes but when I schedule it I get this same error. @Jonah Lay Thank you!
Hello Jonah,
Thanks for sharing this script, it’s still “golding” to me. I have adapted it and tried to set the time zone to Eastern Standard Time or ET,EST and all the ways I can imagine the eastern standard time; yet, the time aware data after publishing still shows UTC time values. I have read others comments on the same issue. Are you able to look into that or any other work around. I really appreciate the effort put in.
Thanks,
Amin
Hi Amin, Good question. If you set “Eastern Standard Time”, it should work. Choosing EST means you are saying your data is stored in EST prior to publishing. If you see that time values appear in UTC, this is expected because the data is converted to and stored in UTC in the database. In Pro 3.1, we added support for “Preferred time zone for display”. A preferred time zone ensures that ArcGIS Pro displays data in the time zone of your choice when working with the web layer in the application. I don’t currently have any sample codes for setting… Read more »
Thanks Jonah, it worked at last. Any thought on overwriting a stand alone hosted feature layer in AGOL? This did not set the time zone but the feature was overwritten when I tried on a hosted feature layer not in a web map.
Dear Jonah,
Thanks for this great and absolutely useful tutorial!
I have a model which ends with a feature layer as output. How can I connect my model with the model in your tutorial to publish (only) my output feature to AGOL?
Thanks in advance!
Carlos
Hi Carlos,
You will need to modify the code to publish a layer rather than the map. Please see this sample code: https://pro.arcgis.com/en/pro-app/latest/arcpy/sharing/featuresharingdraft-class.htm#GUID-8E27A3ED-A705-4ACF-8C7D-AA861327AD26
Dear Jonah, Thank you. This is an excellent article. I’m having some difficulty publishing a single feature via a model I’ve created. I’ve modified the code to select my layer with “selected_layer = m.listLayers()[0]” and provided this variable within a list as a parameter in the m.getWebLayerSharingDraft() function however I am getting the error: Error 001272: Analzer errors were encountered ([{"code":"00102", "message":"Selected layer does not contain a required layer type for web feature layer", "object":"Map"}]). I can manually publish the layer to AGOL without any analyser errors though. Can you offer any insight as to why this is happening? Thanks… Read more »
Jonah,
This is a great tool and I am hoping to use it with some of our data. I have one question…How would the code be modified to overwrite a layer with attachments? The steps in the model work fine to add the attachments to the feature class, but I’m having trouble trying to overwrite the AGO layer with the updated attachments. Any help would be greatly appreciated. Thanks