ModelBuilder in Map Viewer helps ArcGIS Online users build visual, repeatable workflows by connecting tools into multi-step processes that can be automated, documented, and shared.
Many spatial projects require both feature and raster data. For example, you might combine location data with elevation, land cover, or imagery to better understand patterns and conditions across an area.
With the introduction of raster analysis in ModelBuilder in Map Viewer (beta) in ArcGIS Online in November 2026, you can bring raster and feature tools together in a single model. The beta introduces 14 raster tools, raster inputs, configurable analysis environments, and a new Raster Optimized analysis session.
Let’s explore what’s new and see how these capabilities work together in an example.

- Why Raster Analysis Matters
- What do you need to use raster analysis tools in ModelBuilder?
- Introducing the Raster Optimized session
- Add raster data to your models
- Control processing with analysis environments
- Explore the source of contamination in a riparian zone
- Join the Early Adopter Community
- What’s next?
Why Raster Analysis Matters
Before this ArcGIS Online update, ModelBuilder focused on feature analysis. Raster support removes the separation between raster and feature operations, enabling you to bring both data types and their associated tools into the same model. You can use raster and feature datasets as inputs and incorporate Map Viewer raster analysis tools alongside feature analysis tools.
This makes it possible to build more comprehensive spatial models that connect vector geographic features, such as roads and boundaries, with continuous information represented by rasters, such as elevation, land cover, and vegetation. Rather than managing separate models for each data type, you can combine these complementary perspectives to address more complex spatial problems in one place.
The beta update introduces 14 raster tools covering a range of capabilities, including hydrologic analysis, raster-to-feature conversion, sampling, zonal analysis, and multidimensional analysis.
What do you need to use raster analysis tools in ModelBuilder?
To use raster analysis in ModelBuilder, you need the following:
- ModelBuilder licensing – included with a Professional user type or higher
- The Imagery analysis privilege – required to use raster analysis tools in Map Viewer.
Introducing the Raster Optimized session
ModelBuilder uses analysis sessions to provide the computing resources needed to build and run models. Until now, ModelBuilder has offered a single type of analysis session for feature analysis. Credits are charged based on the time you are connected to an analysis session.
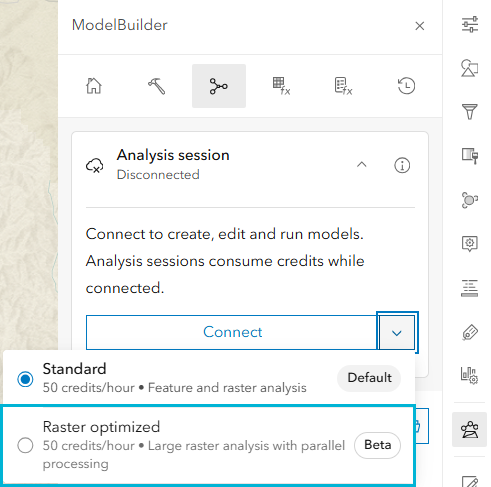
With raster support, you can now choose between two session types: Standard and Raster Optimized. The Standard session remains the default and supports models that combine feature and raster operations.
For models involving larger raster datasets or processing that can benefit from parallel computing, you can choose the new Raster Optimized session, which provides additional computing resources for more demanding tasks.
During the beta period, both session types use the existing ModelBuilder credit rate. This allows you to explore the new raster capabilities and provide feedback without any changes to current pricing.
Add raster data to your models
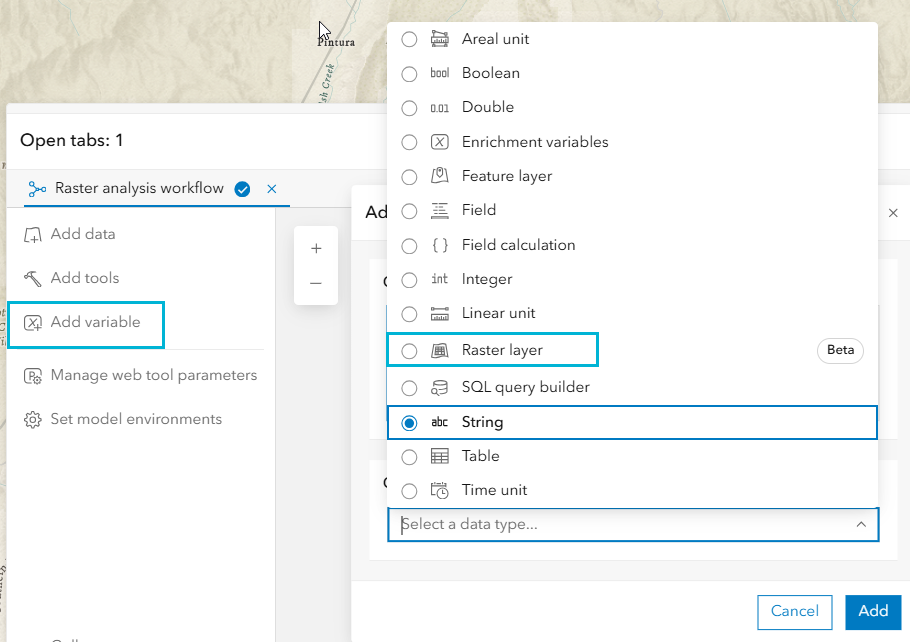
To build raster-based processes, you need raster inputs. ModelBuilder now includes a Raster Layer variable that allows you to use raster datasets as model inputs.
Raster data used in ModelBuilder must be a hosted ArcGIS Image Service. Both dynamic and tiled imagery layers are supported. You can select raster layers directly from your web map or browse available data sources, including ArcGIS Living Atlas, to find and add image services to your model. You can also add the data using the Raster layer variable.
Once added, raster layers can be connected to supported raster analysis tools and combined with feature datasets and feature analysis tools in the same model, enabling you to build integrated raster and feature processes.
Control processing with analysis environments
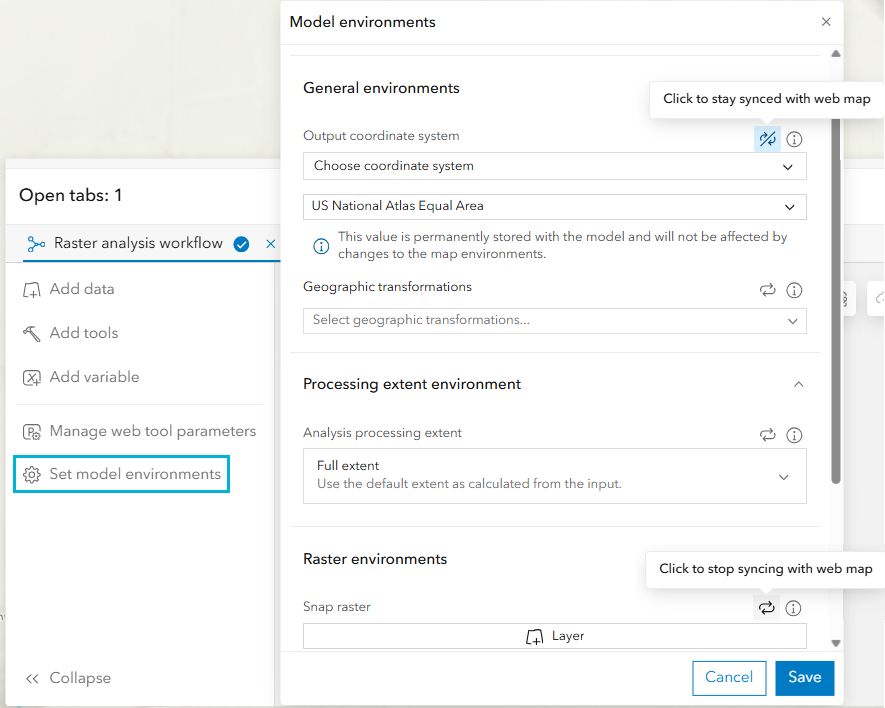
Raster processing often depends on analysis environment settings that control how data is processed and how results are generated. These include settings such as processing extent, snap raster, and cell size, which help ensure that raster outputs align and are generated at the intended resolution and geographic area.
ModelBuilder now allows you to configure and save these settings directly within a model, extending environment support previously available for individual analysis tools in Map Viewer. By default, models inherit environment settings from the current web map. You can override individual settings and save specific values with the model to control how it runs.
For each environment setting, you can choose to keep it synchronized with the web map or retain a fixed value stored in the model. This gives you greater control over processing and helps ensure consistent, reproducible results without changing the web map’s environment settings.
Explore the source of contamination in a riparian zone
Let’s walk through an example to see how this works in practice.
Imagine that water-quality monitoring has identified several locations with observed contamination. We want to better understand the landscape upstream from those locations and identify conditions that could influence how contaminants reach nearby waterways.
For this example, we will investigate observed contaminant locations in Utah. The model combines point and stream features with elevation and slope rasters. It uses hydrology and zonal analysis tools to delineate the upstream watershed and calculate information about slope within the contributing area. The workflow begins with the observed contaminant locations and a digital elevation model. Hydrologic analysis is used to determine the area upstream from the observations. This enables us to move beyond simply looking at the contamination points and examine the landscape that may be contributing to those locations.
Next, the workflow evaluates slope, an important landscape characteristic when considering how water and associated materials may move toward streams. The model also examines the riparian area surrounding the stream network. A 500-meter buffer is used for riparian analysis, and zonal statistics summarize slope values within those areas.
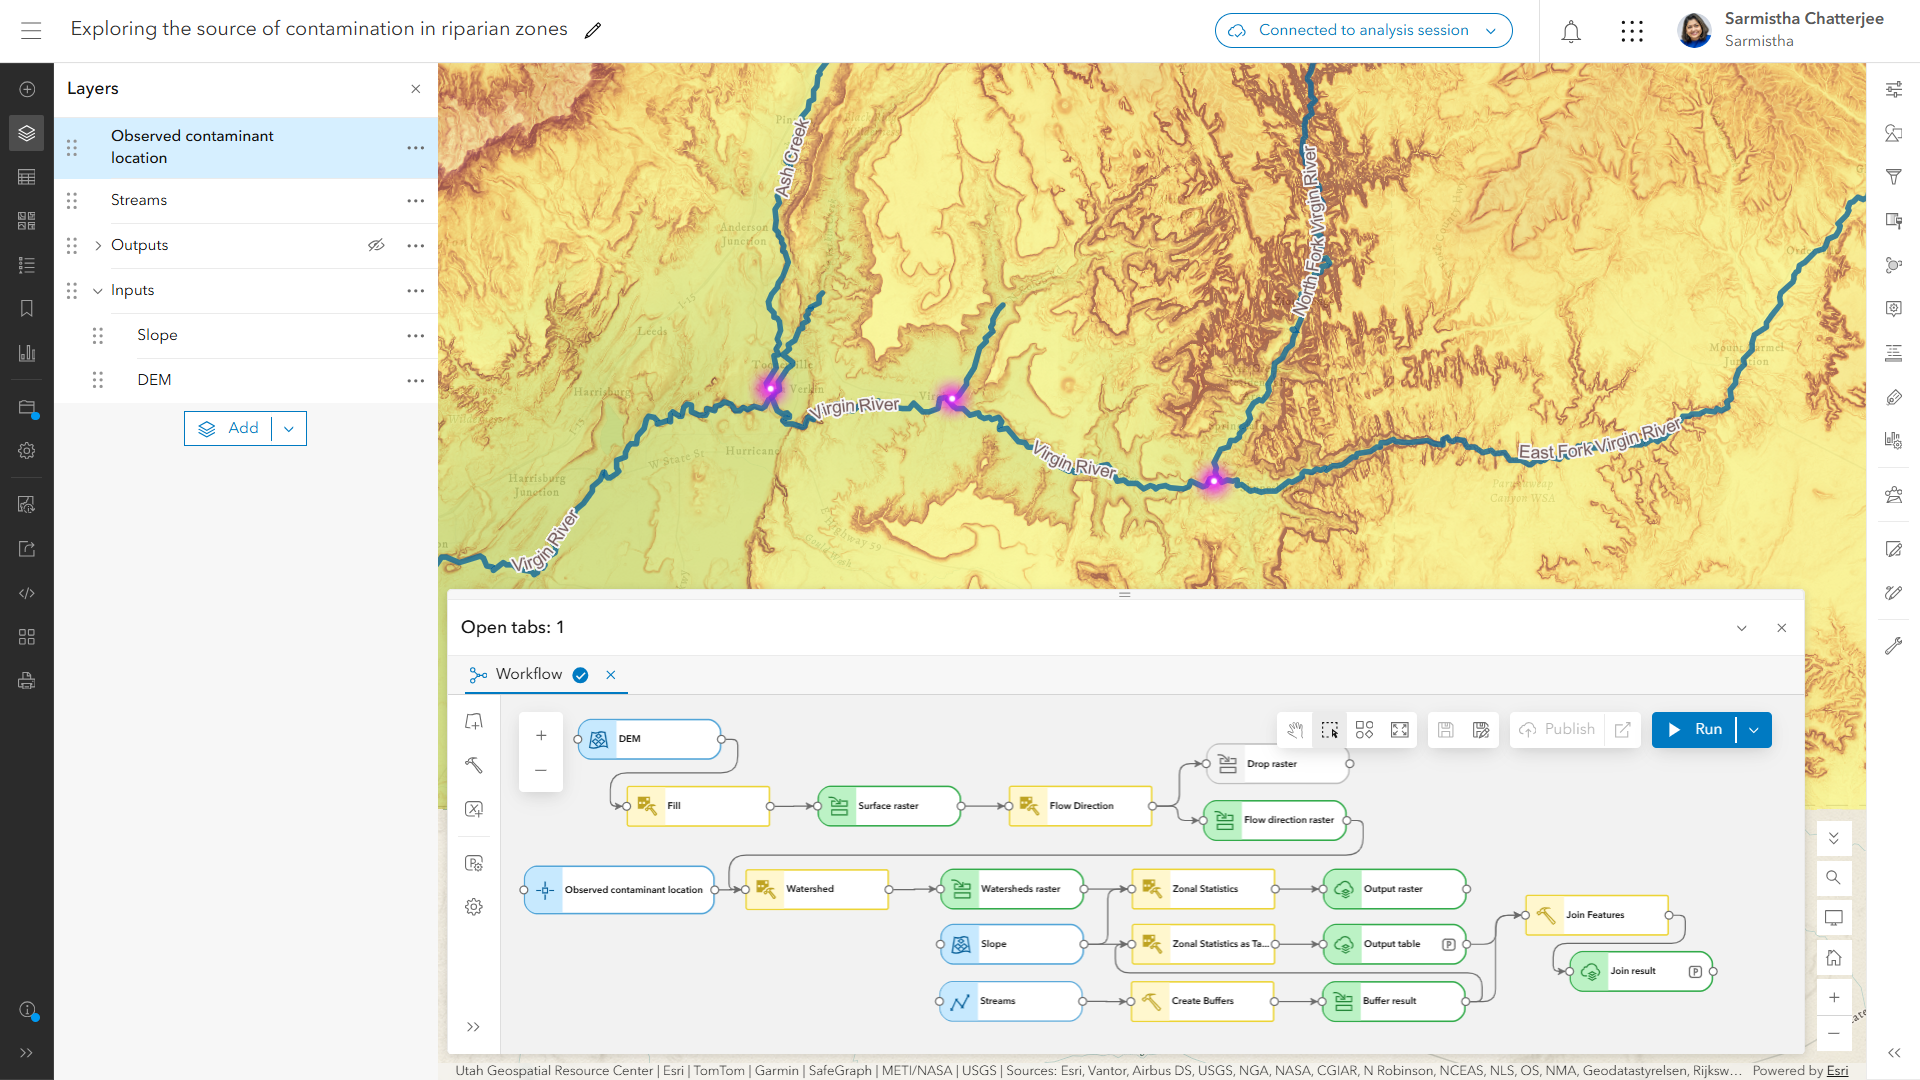
When the analysis finishes, selected results can be published as hosted outputs in ArcGIS Online for visualization and additional analysis. Intermediate results do not all need to become permanent layers. The existing ModelBuilder design uses temporary intermediate outputs by default while enabling selected results to be preserved as hosted layers.
In the example, the resulting analysis shows that the average slope for North Creek is higher than for Ash Creek and the East Fork Virgin River, providing additional information for interpreting potential contaminant movement in the study area. By linking each step, ModelBuilder captures the full analytical process rather than a series of separate tool runs. The workflow goes beyond producing a raster: it brings observations, terrain, hydrology, and summary information together in a repeatable workflow.
Join the Early Adopter Community
Raster analysis in ModelBuilder is now available in beta, and we invite you to join the Early Adopter Community (EAC) to explore the new capabilities and help shape their future development. In the community forums, you can ask questions, share your experiences, connect with other participants, and provide feedback directly to the Esri team.
To learn more about ModelBuilder, visit the ModelBuilder resource page in the ArcGIS Online Help documentation. You can also follow the step-by-step Get Started with ModelBuilder tutorial to build your first model.
What’s next?
This beta is an important first step toward expanding the raster capabilities available in ModelBuilder and enabling more advanced imagery workflows in ArcGIS Online.
The current release focuses on a subset of raster analysis tools and the supporting capabilities needed to build and run raster-enabled models. Looking ahead, future development will explore broader raster tool support and additional capabilities, including GPU-accelerated deep learning analysis and raster functions in ModelBuilder.
As we continue to evolve these capabilities, our goal is to give GIS analysts more flexibility and power to build, automate, and run raster-based spatial analysis directly in ArcGIS Online.
We want your feedback
The Esri Web Analysis team is excited to introduce Raster Analysis in ModelBuilder (Beta) in Map Viewer! We are eager to hear your thoughts on the new raster analysis capabilities in ModelBuilder and learn how they enhance your spatial analysis workflows in ArcGIS Online.
We look forward to hearing from you!
Happy Analysis!


Article Discussion: