The latest Map Viewer update gives you more ways to turn your data into meaningful, engaging web maps. Create more expressive visualizations with enhanced symbols and labeling, explore change over time with improved temporal experiences, work with an expanding range of data and layer types, and take advantage of new capabilities across editing, analysis, sharing, and map authoring.
Here’s a look at what’s new and how these enhancements can help you work more efficiently, communicate more clearly, and get more from your maps and data.
Quick Links
- Symbol Marker Animation for Line Features
- Point Symbol Offsets
- Expanded Symbol Galleries
- Richer Background Symbol Styling
- Halos for Point Symbols
- Labeling and Text Formatting Tags
- Pop-ups Attachment Carousel
- Sketch – Multipoint Tool
- Aggregation: Cluster Styling Enhancements
- Time Enhancements
- Define an Area of Interest for Imagery Scatterplots
- Hover Text in Charts and Improved Chart Navigation
- Resizable Center Panel
VISUALIZE AND STYLE
Symbol Marker Animation for Line Features
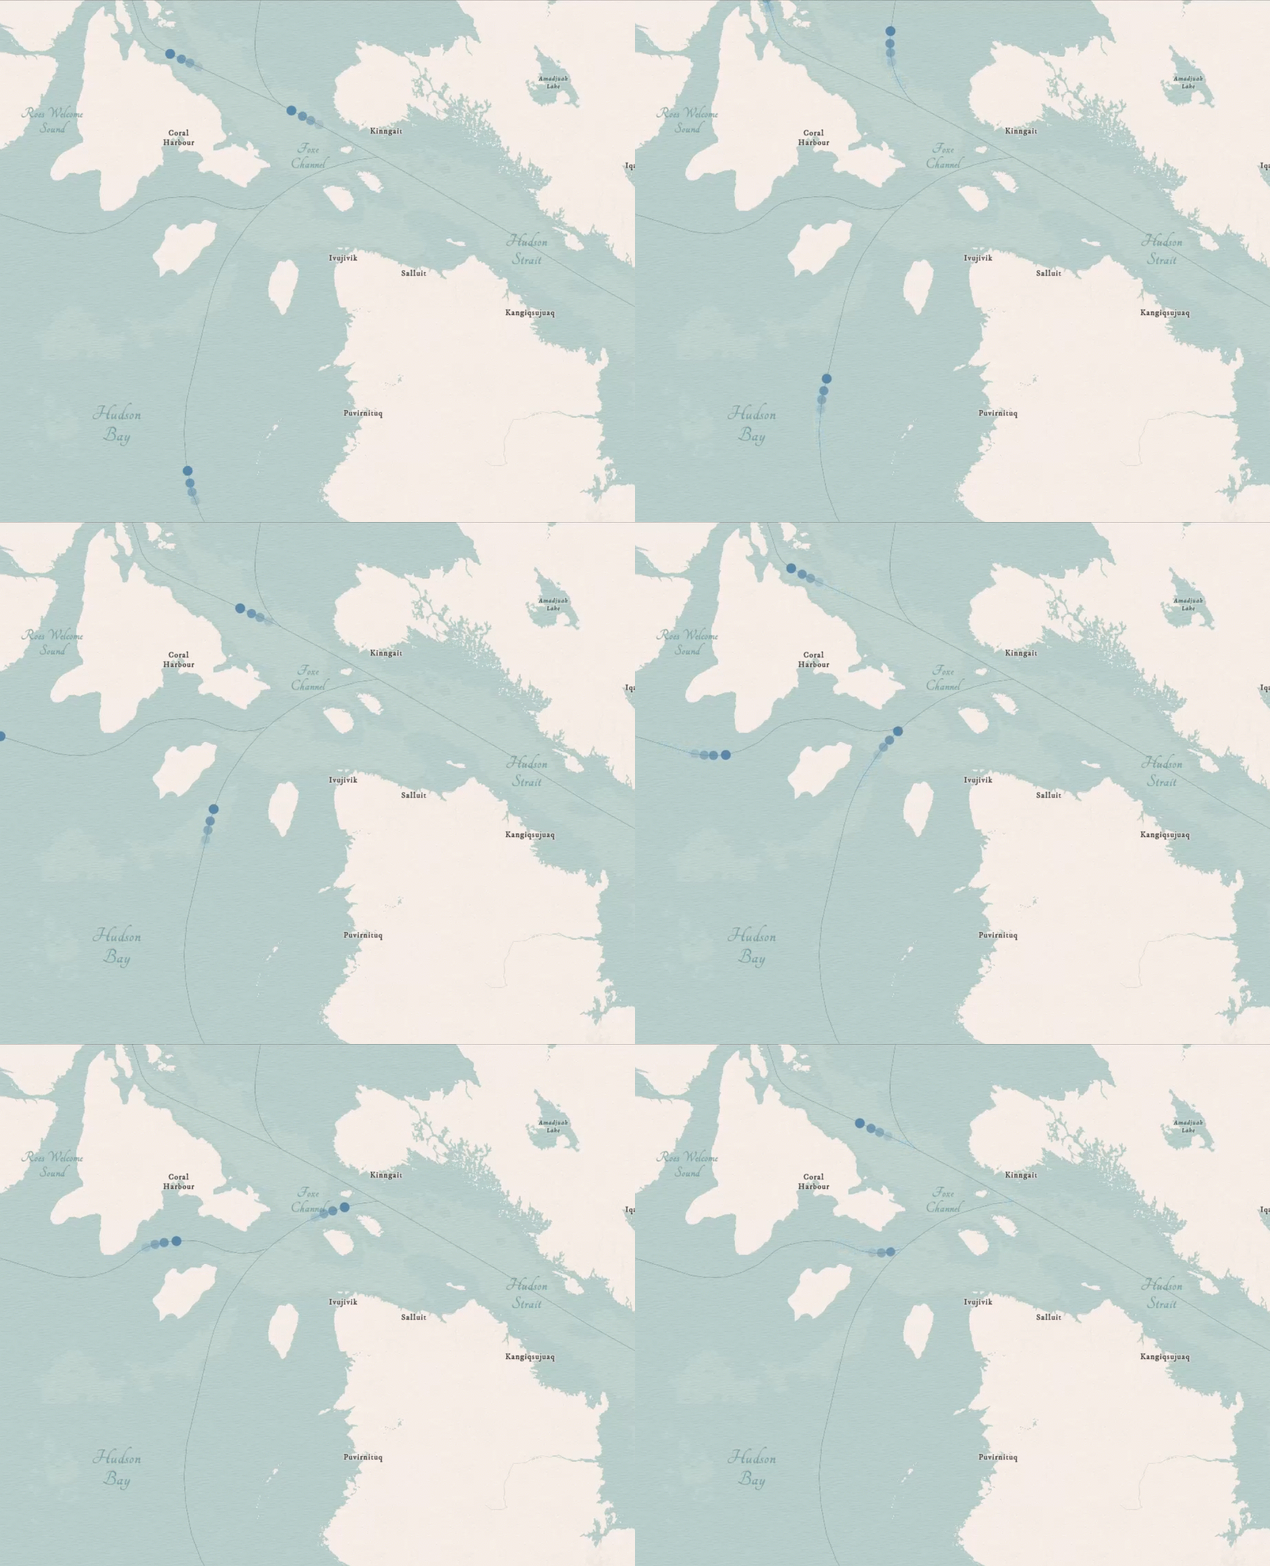
The June 2026 release introduced the first support for animation along a line, using animated symbols available through the animated symbol gallery. In this November update you will be able to create more dynamic maps with expanded support for animated symbols along lines. In addition to repeating marker animations, you can now animate a single marker along a line, making it easier to represent the movement and direction of objects such as vehicles, aircraft, people, or other moving features. Choose from ready-to-use animated symbols or apply animation to compatible marker symbols from your own web styles. Customize the animation by adjusting its speed or the distance it travels along the line, and reverse the direction when needed. You can also combine multiple animated marker layers with offsets and transparency to create more sophisticated visual effects. These enhancements provide greater creative control for visualizing movement and flow, from transportation and shipping routes to water flow, migration, weather patterns, and other directional data.
Expanded Symbol Galleries
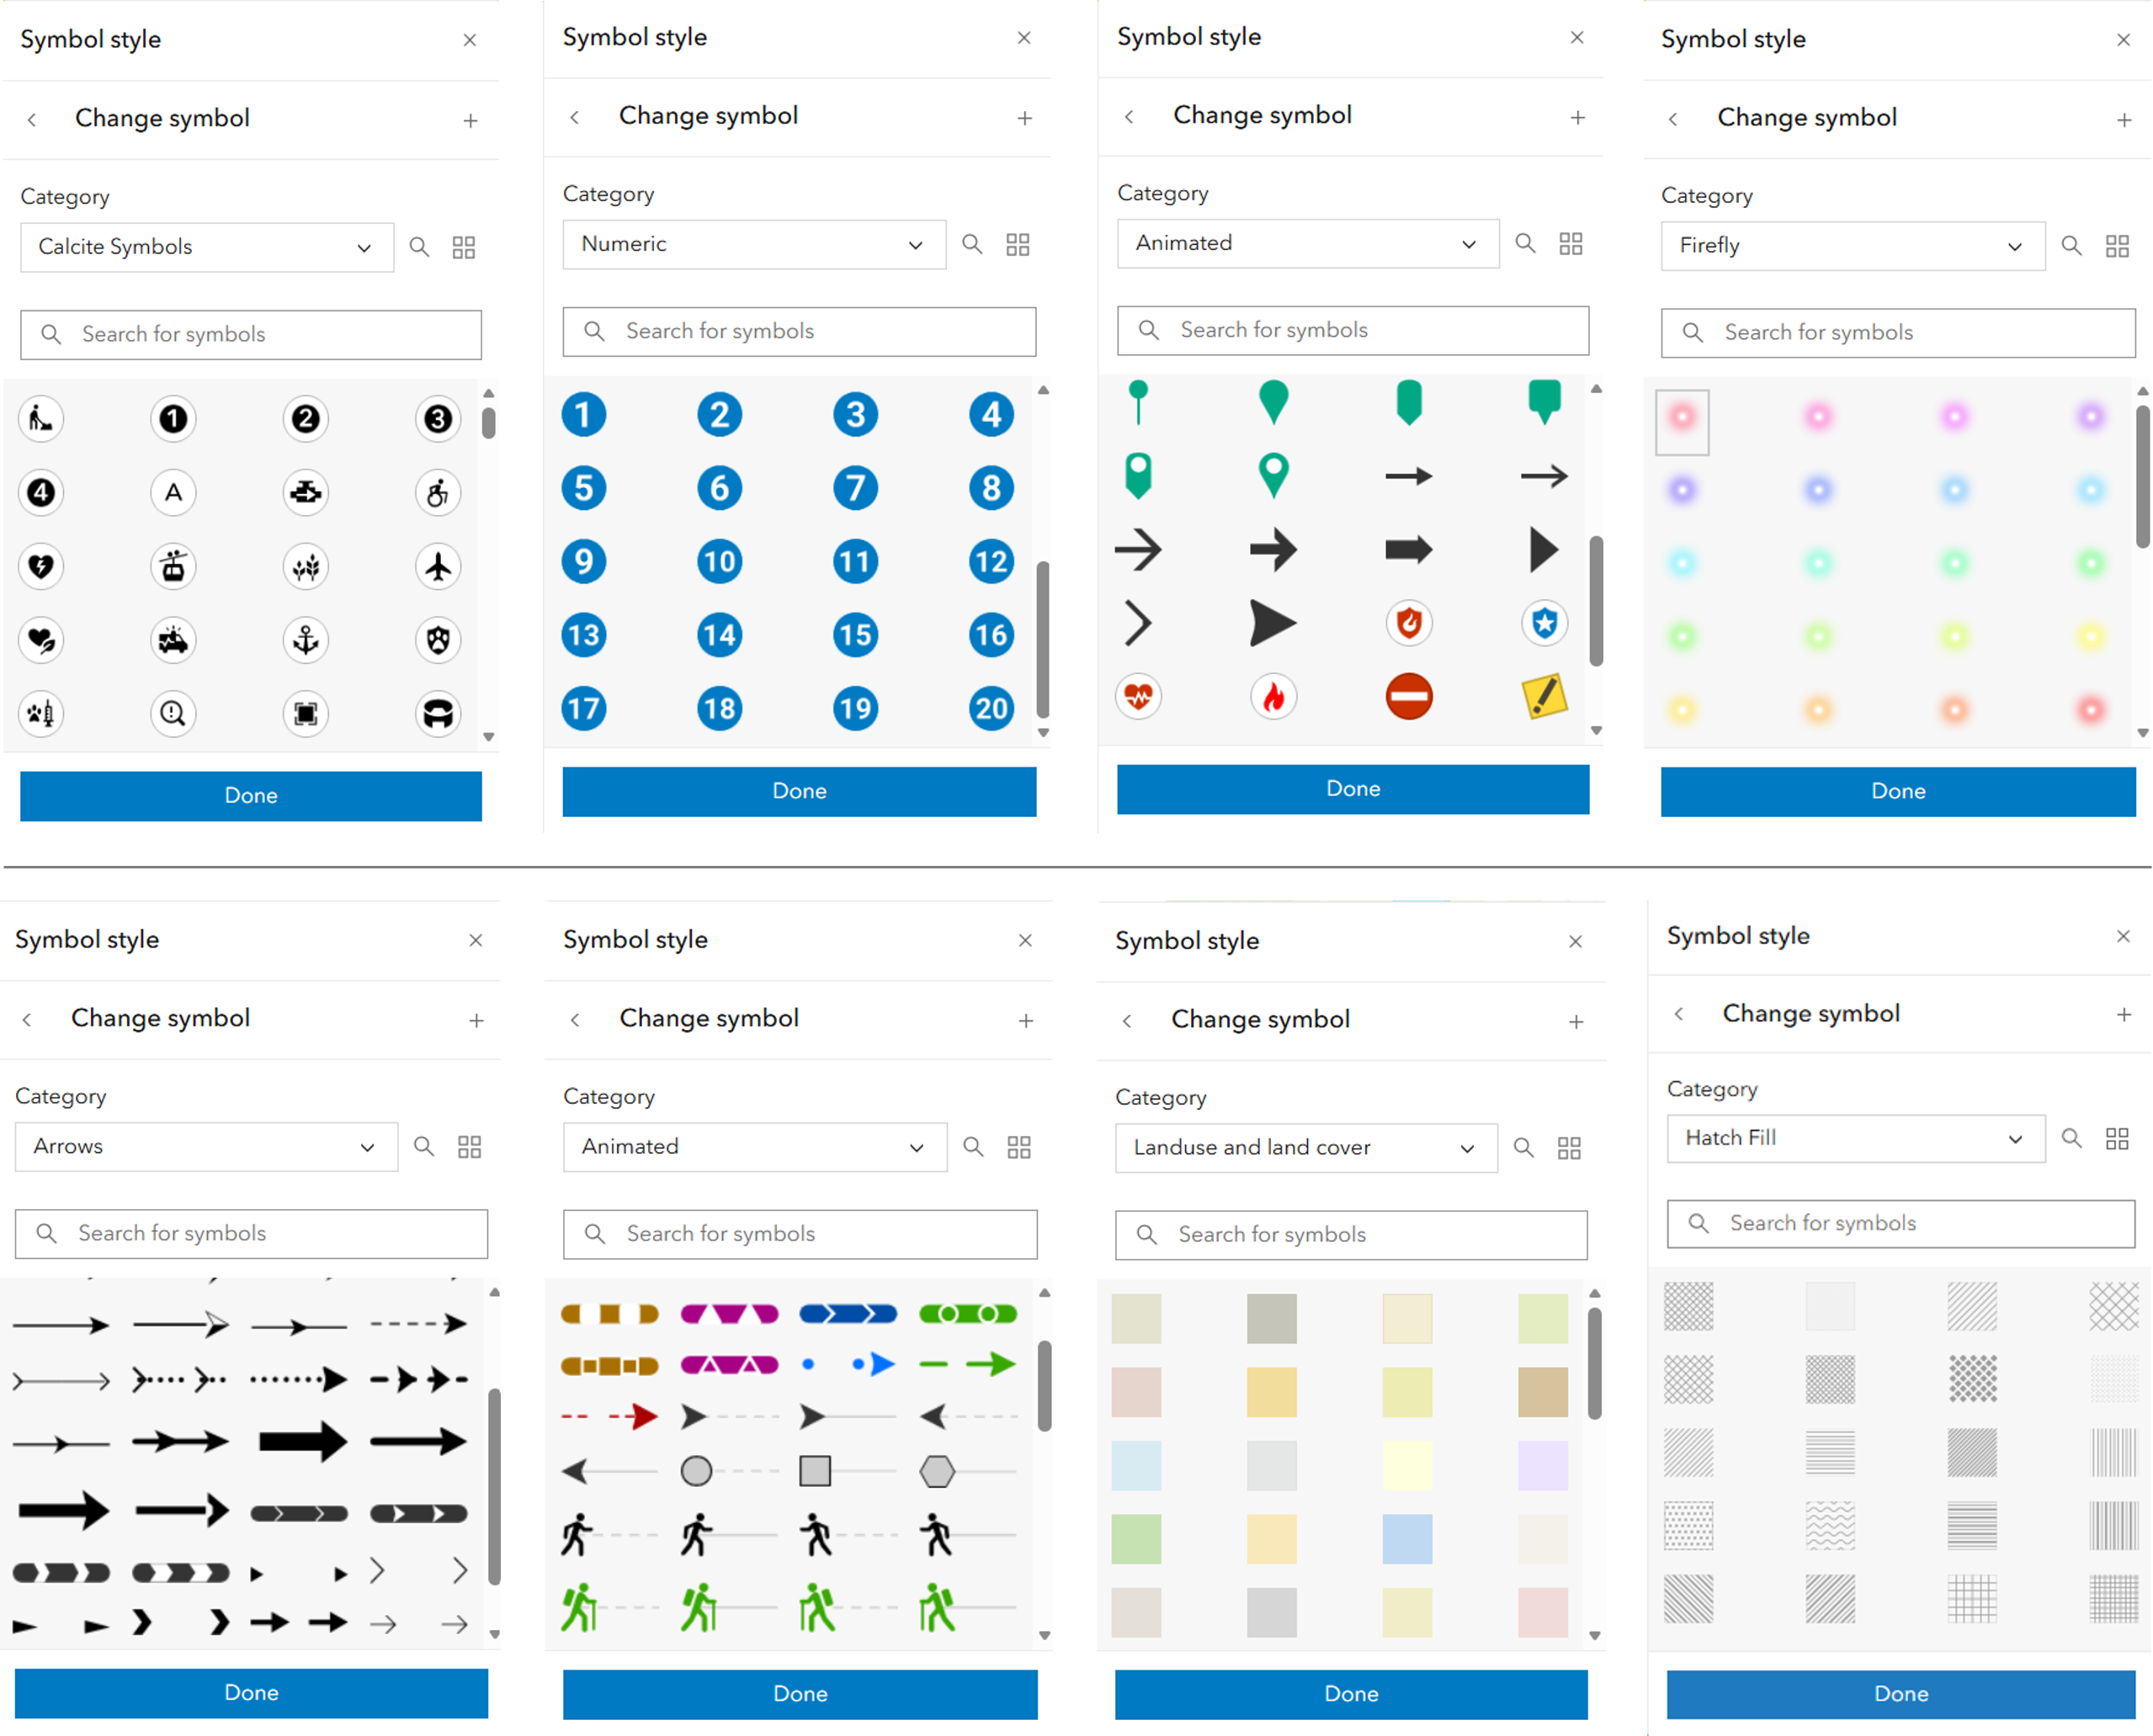
Choose from a significantly expanded collection of more than 2,500 symbols across points, lines, and polygons to create informative and visually compelling maps. Many symbols are drawn from the ArcGIS Pro 2D symbol gallery, bringing greater consistency to the symbol choices available across desktop and web mapping workflows. The expanded galleries include more than 600 Esri’s designed symbols, vector Firefly symbols, numeric points, pins, points of interest, shapes, and galleries from solutions including government and public safety symbols. New vector symbols also extend beyond points, with additional options for lines and polygons, including land-use and land-cover symbols.
Finding the right symbol is easier too. Symbols include consistent names, categories, and descriptive tags that make them easier to search and filter. And because these are editable vector symbols, you have greater flexibility to customize properties such as color and other supported styling options to complement your map. The expanded galleries are also available in Sketch, giving you more options when quickly adding features and points of interest to your map.
Point Symbol Offsets
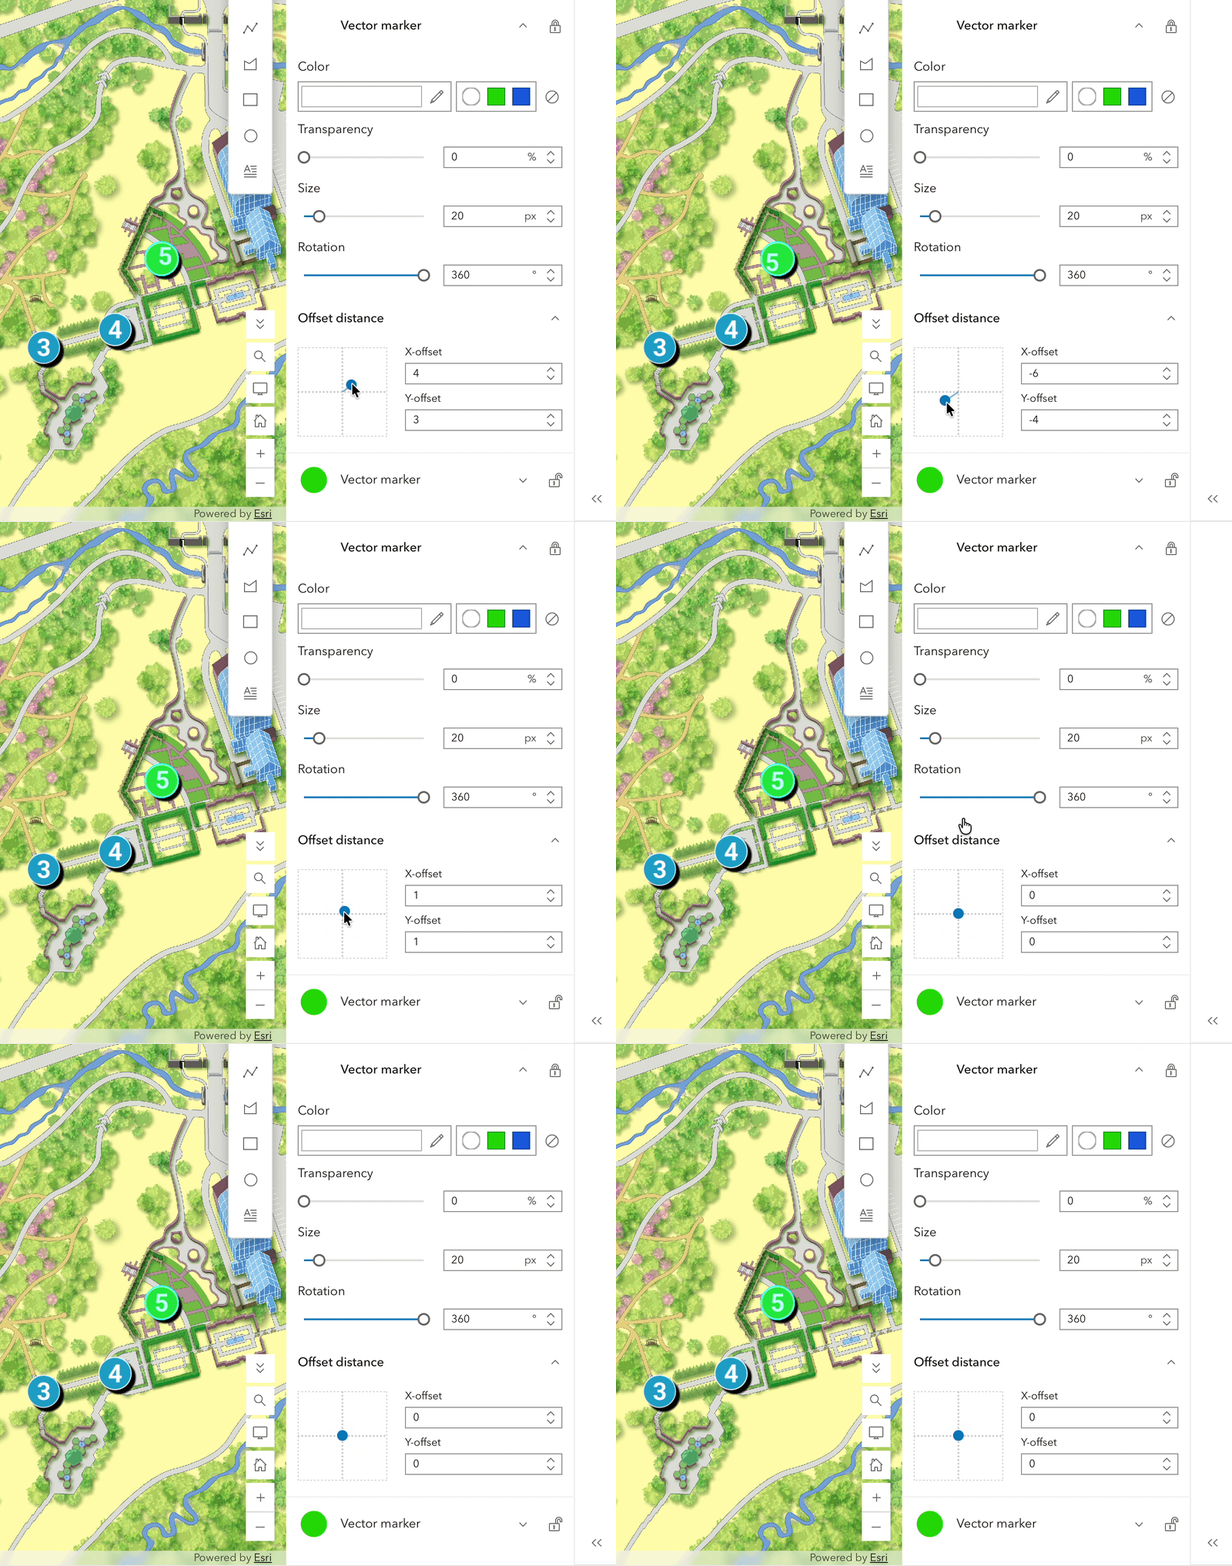
Gain greater control over the placement of point symbols with support for symbol offsets in Map Viewer. You can adjust the position of a symbol relative to its geographic location, helping improve readability, reduce visual conflicts, and create more polished cartographic displays. Offset support also provides greater flexibility when working with the growing collection of vector symbols available in Map Viewer. Symbols that use offsets can be brought into your map and further customized, allowing you to fine-tune their appearance rather than being limited to predefined positioning. This gives you more control to adapt sophisticated symbols to the specific needs of your map.
Richer Background Symbol Styling
Map Viewer expands support for richer background symbol styling, allowing more sophisticated symbol designs to be preserved and displayed in web maps. This gives you greater flexibility when working with detailed, multilayer symbols and helps maintain a consistent cartographic appearance across ArcGIS.
Halos for Point Symbols
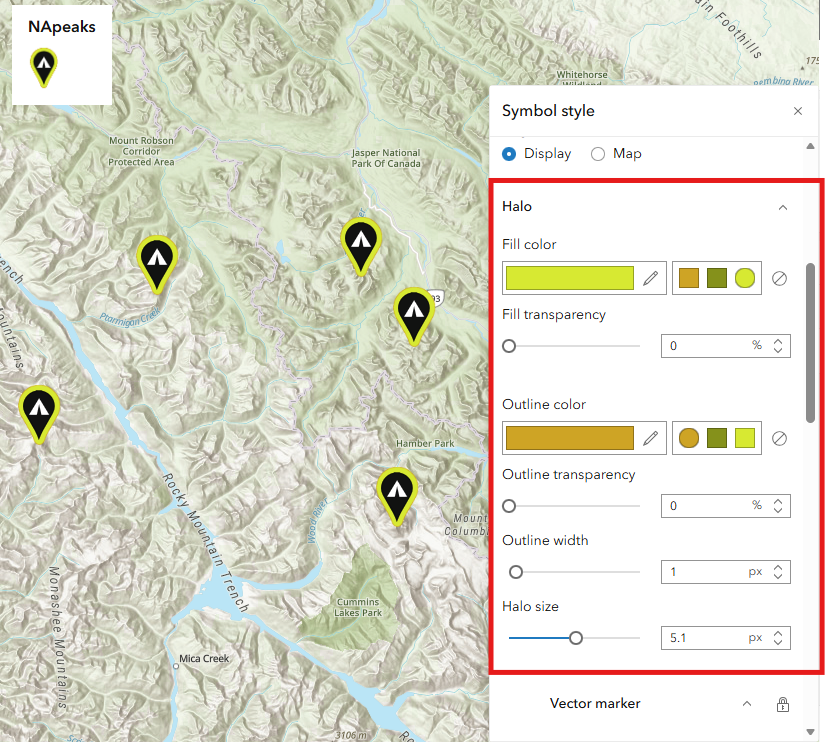
Make important locations easier to identify by adding halos to point symbols. For example, when mapping different types of locations, you can add a halo to a specific symbol class to help those features stand out from other symbols and the basemap. Customize the halo’s size, fill, and outline to create anything from subtle separation to a more distinctive visual treatment. Halos authored in ArcGIS Pro are also supported in Map Viewer, helping preserve your cartographic designs. Whether highlighting priority locations, facilities, or other important features, halos give you greater control over visual hierarchy and make key information easier to see. To learn more about configuring the color and size of the halo effect on point symbols, see Use style options.
Labeling and Text Formatting Tags
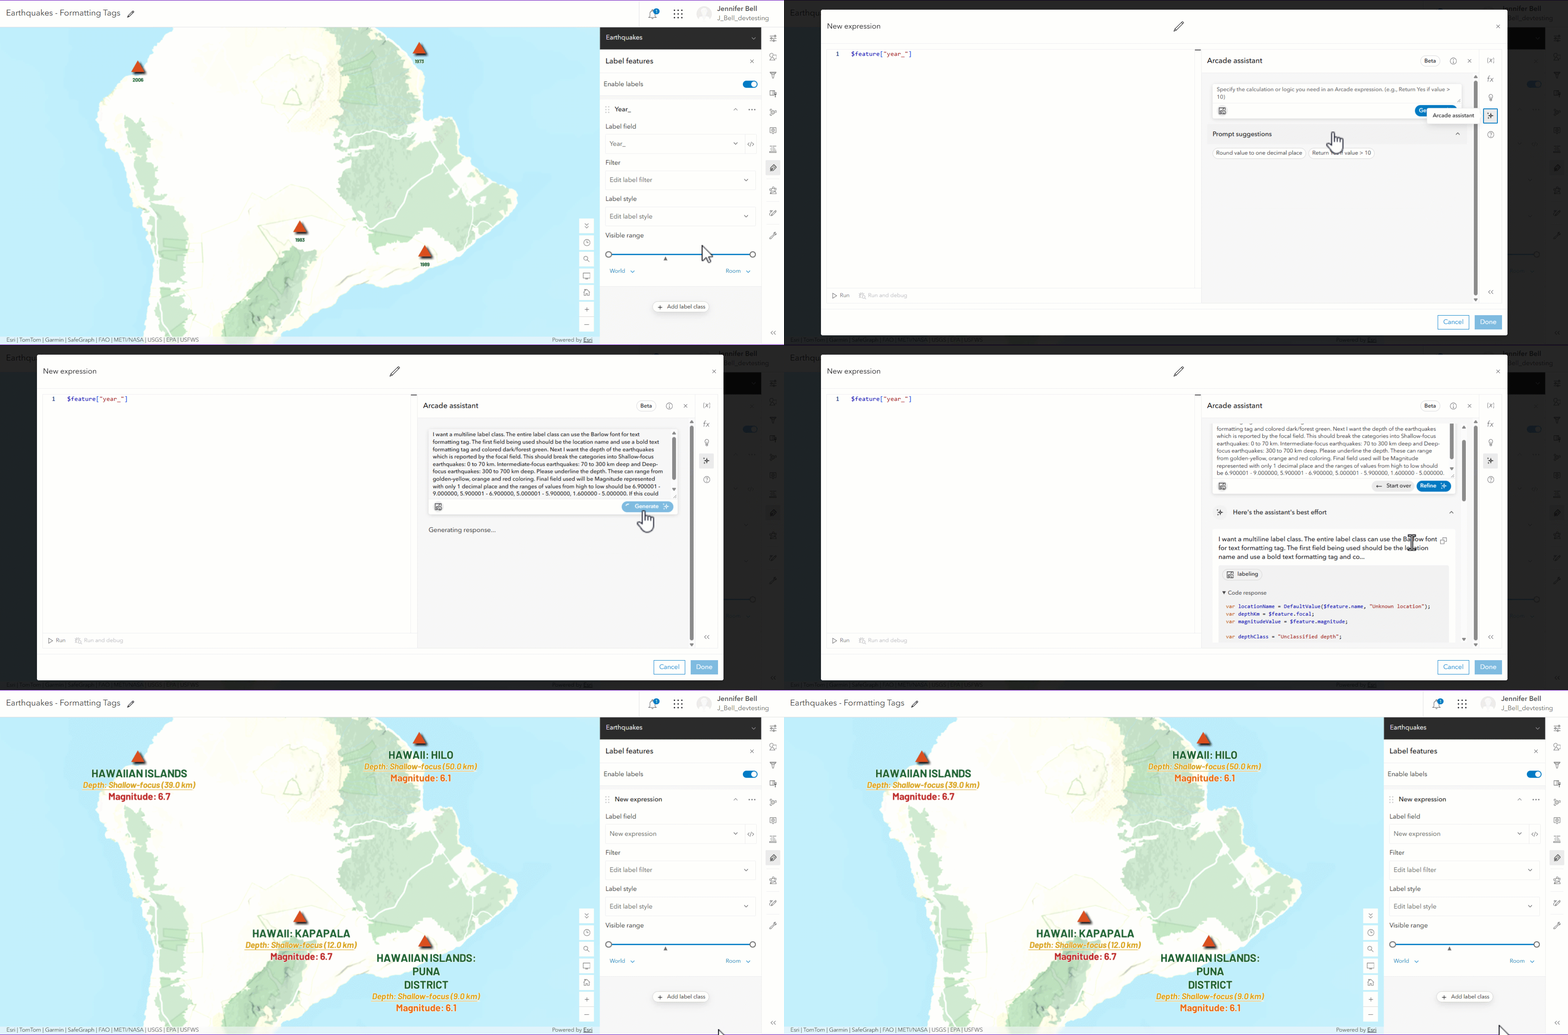
Create more informative and visually distinctive labels with new support for text formatting tags in Map Viewer. Using Arcade expressions, you can apply different formatting to individual parts of a label, including font, font size, color, bold, italics, underline, and character spacing. You can also combine information from multiple fields and format individual values differently within the same label. This makes it easier to create sophisticated, multi-styled labels within a single label class. For example, you can emphasize important values with different colors, sizes, or fonts based on feature attributes without creating separate label classes and filters for each variation. With greater control over how information is presented, you can create cartographically rich labels that communicate more while simplifying the labeling workflow.
Pop-ups Attachment Carousel
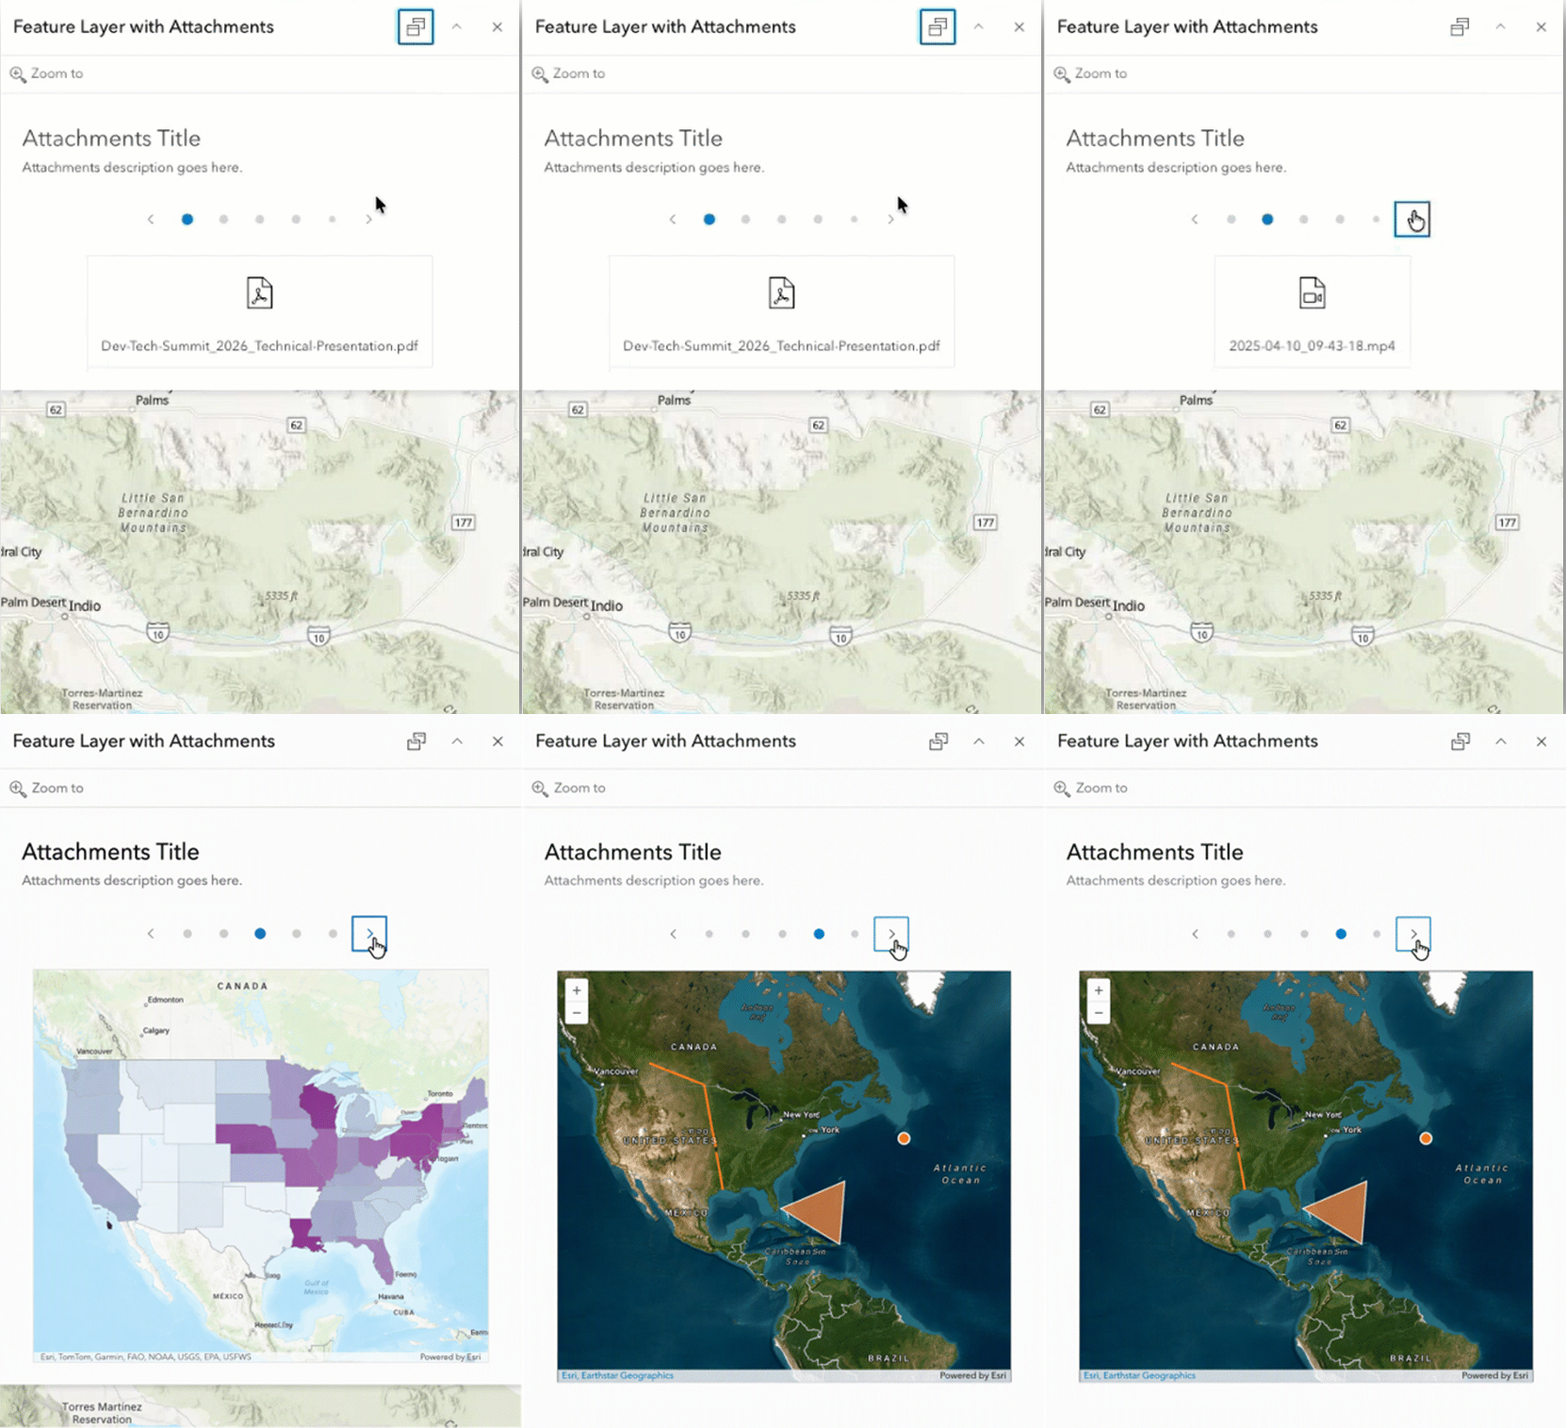
With the new carousel layout, you can browse multiple attachments in your pop-up one at a time instead of scrolling through the entire collection. This gives attachments prominence while providing more space for accompanying pop-up content. To learn more, see Add attachments when configuring pop-ups.
Sketch – Multipoint Tool
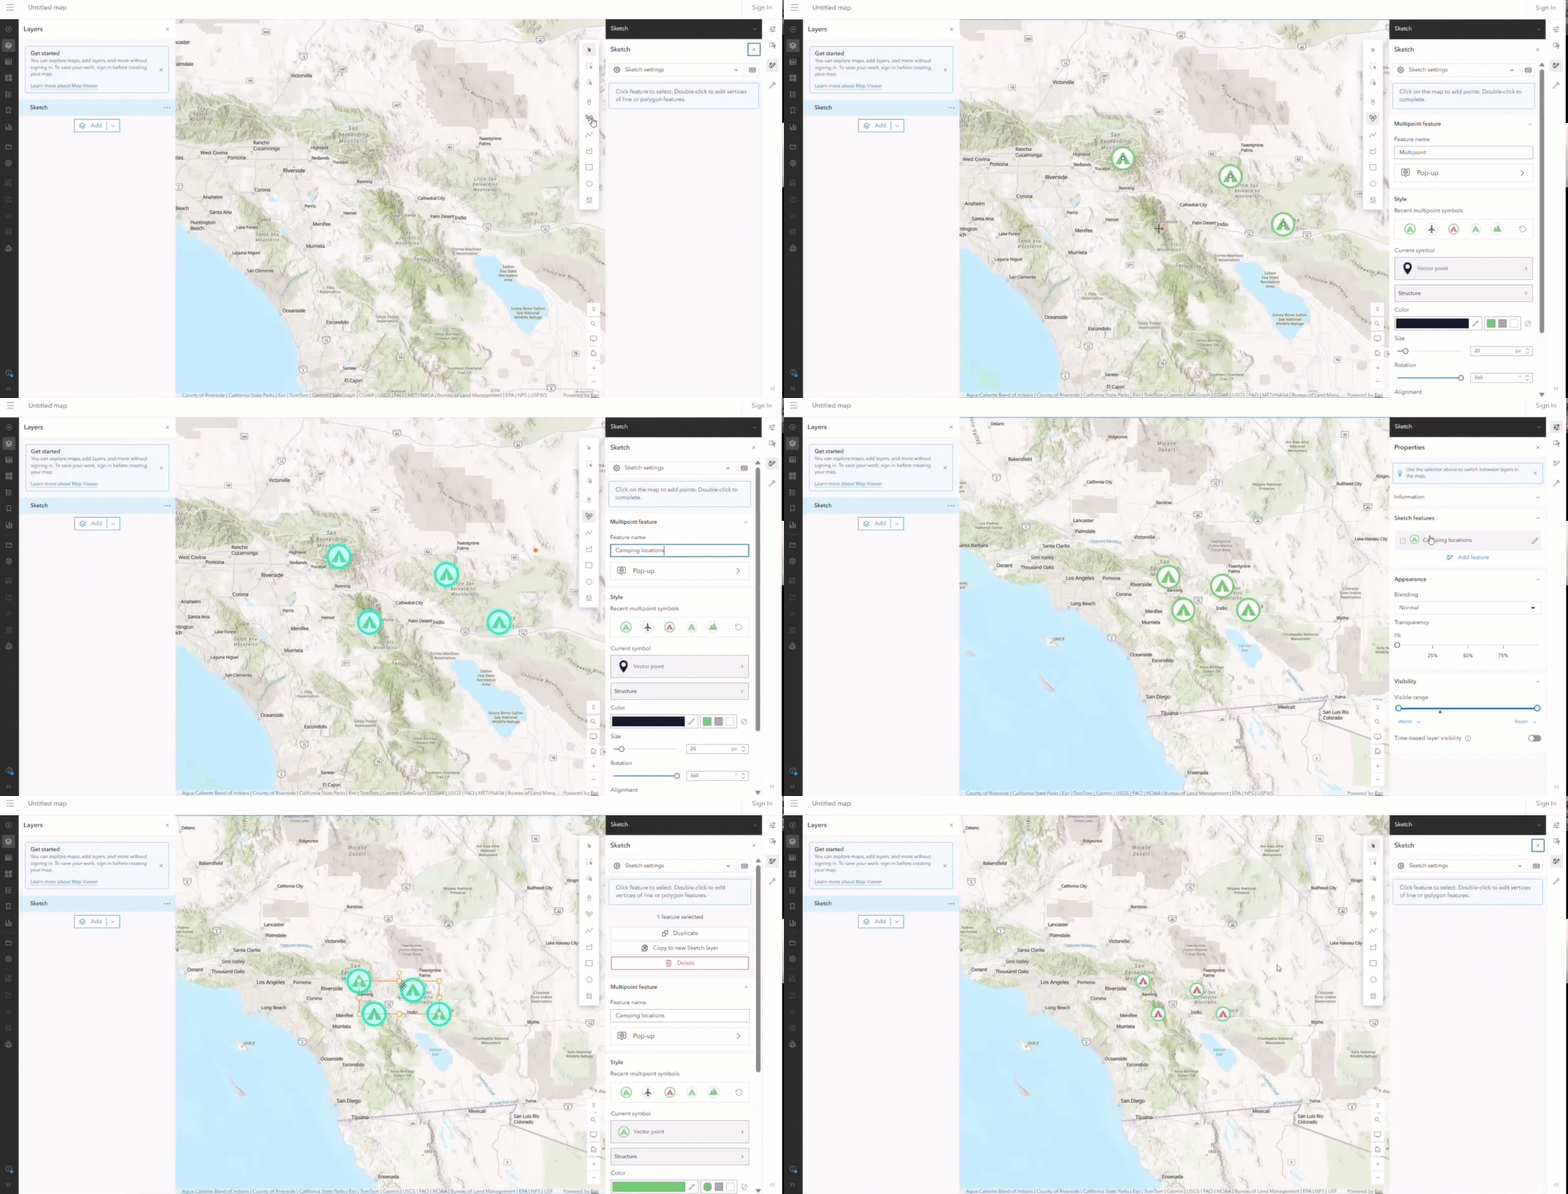
The addition of the multipoint tool in Map Viewer enhances the sketch experience for users who place multiple points of the same type. Instead of creating and managing each point as a separate feature, you can group multiple locations into a single feature that shares the same name, symbol, and properties. Individual point positions can still be adjusted independently, giving you the flexibility to refine each location while managing the collection as one feature. The properties pane also provides a cleaner, legend-like list instead of repeating the same symbol for every point, reducing clutter and making larger sketches easier to navigate and manage. For example, you can represent trees along a road, fire hydrants throughout a neighborhood, or sampling sites within a study area as one multipoint feature.
Aggregation: Cluster Styling Enhancements
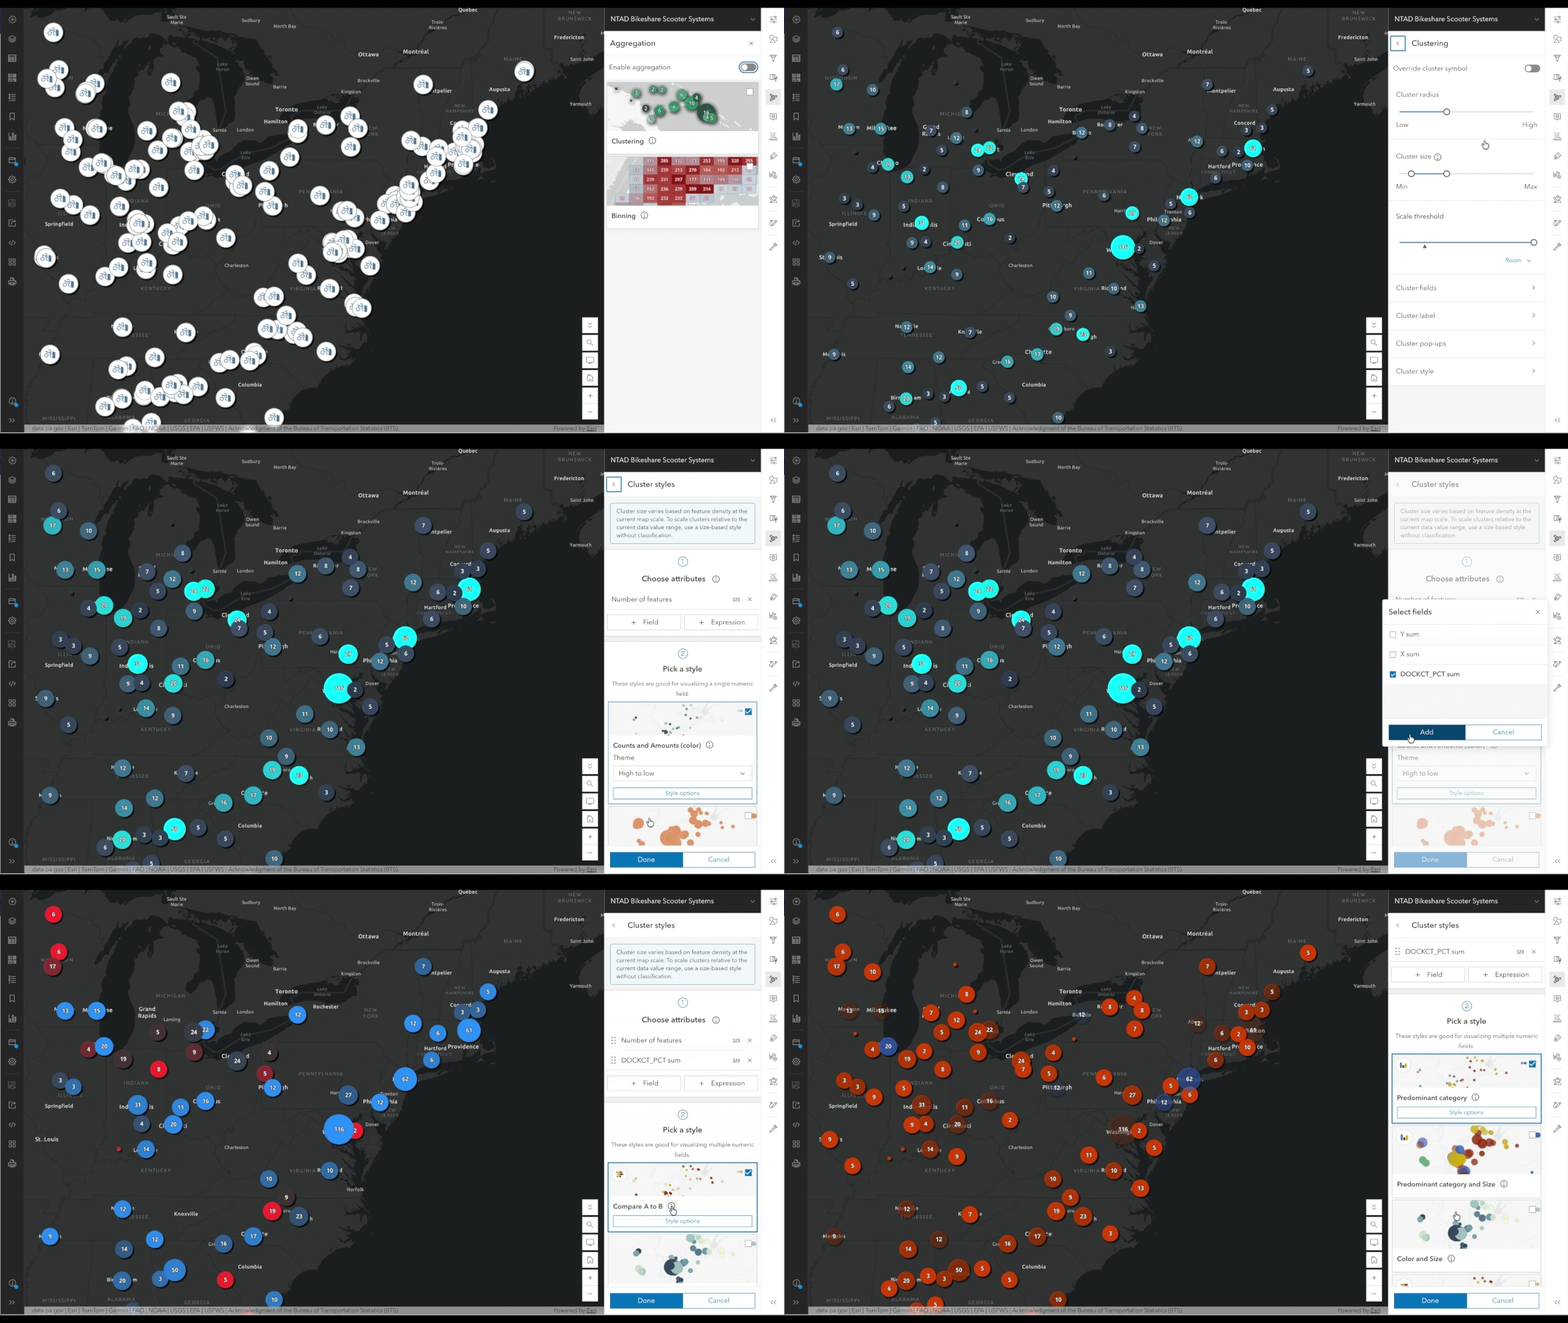
Independent Cluster Styling gives map authors greater flexibility and control over how clustered features are displayed in Map Viewer. Clusters can now be styled independently from the source layer using aggregate attributes. Summary statistic fields and Arcade expressions can drive both the type and size of clusters, making it easier to highlight patterns, concentrations, and meaningful differences in large datasets such as Parquet while preserving the appearance of individual features. For example, cluster color can represent a predominant category while cluster size communicates a numeric value such as total capacity, allowing multiple characteristics of the aggregated data to be visualized at once.
More importantly, clustering can reveal a different story than the individual features themselves. A public safety map might symbolize individual incidents by crime category, while coloring clusters by the proportion of incidents classified as violent. Similarly, an air quality map might distinguish individual sensors by type, while using cluster color to show the average measurement across the sensors represented by each cluster.
An intuitive example would be earthquakes. Individual earthquakes might be sized by magnitude and colored by depth, while clusters of earthquakes are sized by the number of earthquakes they represent and colored by the mean or median magnitude within each cluster. This allows the visualization to transition naturally from the characteristics of individual events to patterns within the aggregated data as the map scale changes.
This enhancement brings greater consistency to styling across clustering and binning, giving map authors more control over how aggregated data communicates patterns and trends while preserving the context and detail of individual features. To learn more, see how clusters and bins are styled using smart mapping style options.
Time Enhancements
Map Viewer introduces significant improvements for working with temporal data. You can now configure and modify time settings directly in Map Viewer, enable time on supported layers such as CSV and GeoJSON using existing date fields, and switch between multiple time fields without leaving the map. Time-aware experiences can also be shared more broadly, with Time Slider support now available in embedded maps and configurable applications, making it easier to explore and communicate patterns and change over time across the ArcGIS ecosystem.
New Time Slider
Time-enabled maps are getting a major refresh with the introduction of the new Time Slider. The new experience replaces the legacy time slider with a cleaner, more responsive interface that makes exploring data through time easier than ever. The redesigned control features a slimmer visual design that takes up less screen space while providing a more intuitive way to navigate temporal data. Whether you’re analyzing historical trends, monitoring events over time, or visualizing change across a time-enabled dataset, the new slider offers a smoother and more consistent experience. The Time Slider in Map Viewer has been enhanced to provide greater control and a smoother temporal analysis workflow. When working with layers that contain multiple time fields, the Time Slider automatically updates to reflect the selected field and its corresponding time extent.
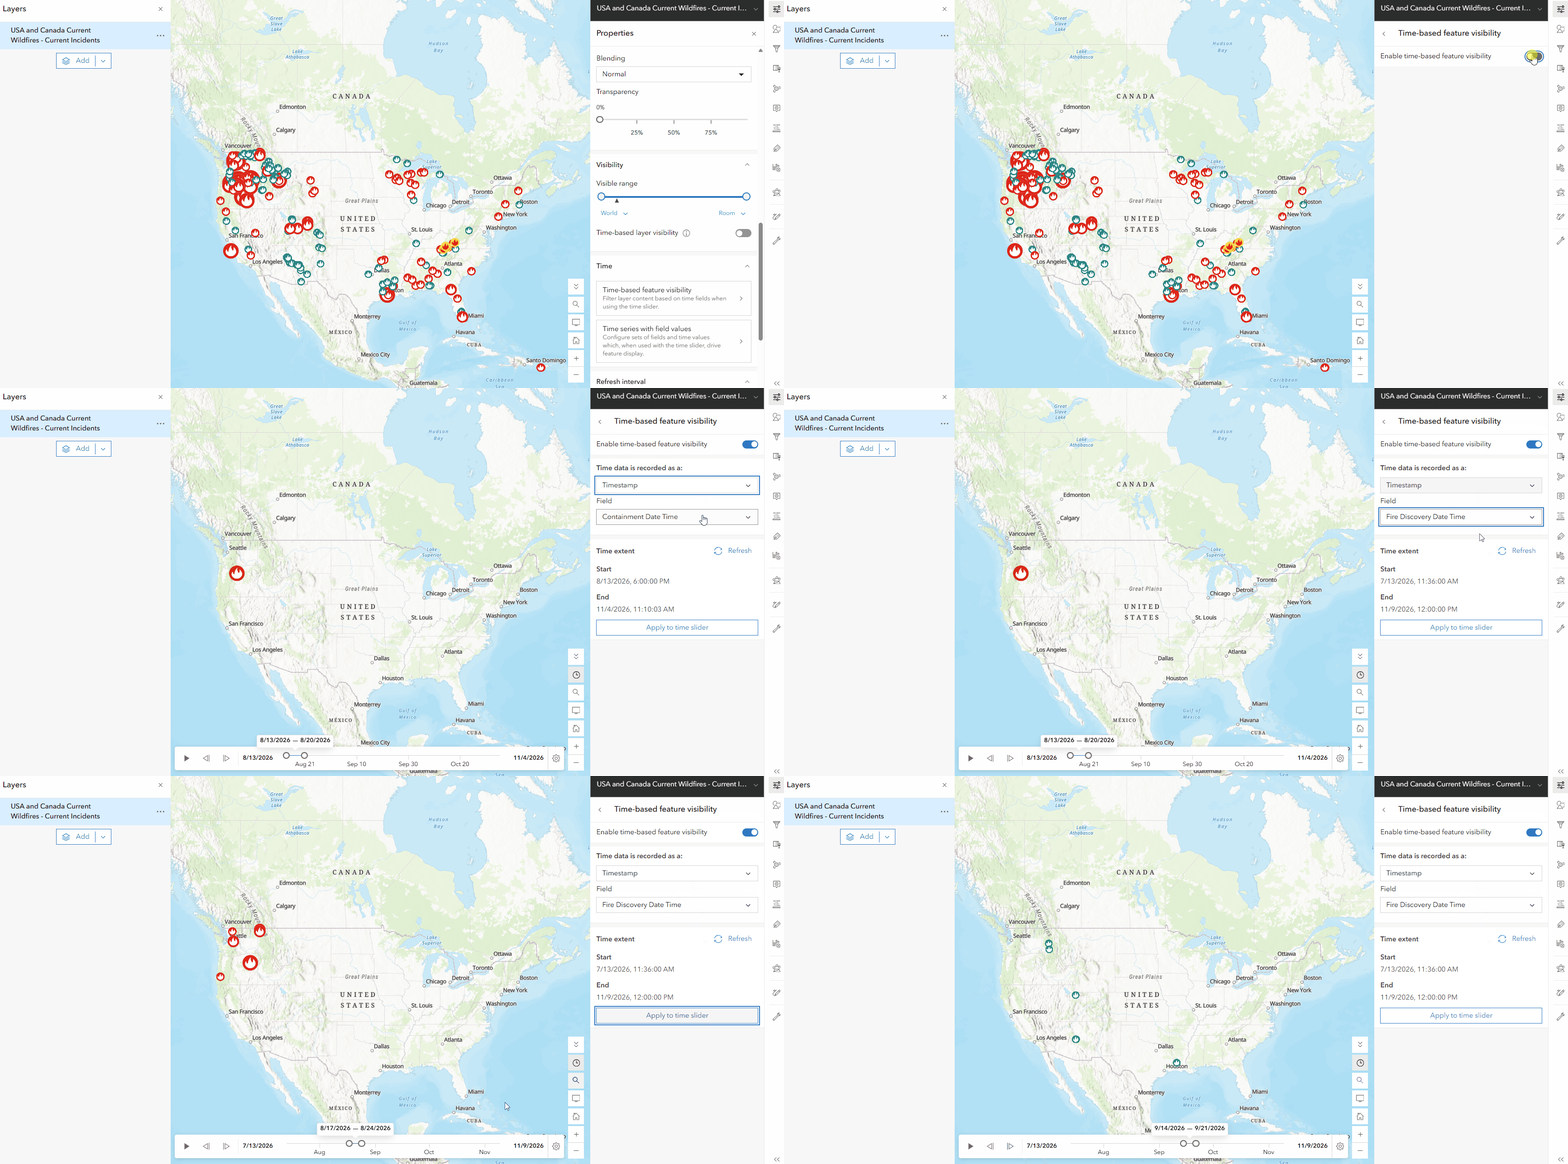
Time-enable Layers and Configure in Map Viewer
Working with temporal data is now more flexible and accessible in Map Viewer. You can configure time directly from layer settings without needing to own the layer or switch to the item details page. Layers containing date fields can be made time-aware even if time information was never previously configured, making it easier to explore temporal patterns in existing data. Map Viewer also allows you to view and update a layer’s time extent, choose between multiple date or time-range fields, and automatically update the Time Slider to match the selected field. In addition, time-based feature visibility can now be configured directly within the map, and support has been expanded beyond hosted feature layers to include layer types such as CSV and GeoJSON, allowing more datasets to take advantage of time-enabled visualization and analysis workflows.
Map Viewer now extends time-enabled workflows beyond hosted feature layers, making it easier to explore temporal data from a wider range of sources. You can enable and configure time directly on supported layers that contain date fields, including CSV and GeoJSON layers, without first creating a hosted feature layer or preconfiguring time settings. This enhancement brings greater flexibility to working with external and file-based data, allowing you to quickly visualize, filter, and analyze changes over time regardless of where your data originates. By removing previous limitations, more datasets can now take advantage of the Time Slider and other time-aware mapping capabilities directly within Map Viewer.
Time-Enabled Parquet
Map Viewer continues to expand support for modern data formats with enhanced time capabilities for Parquet-based data. Authors can now work with time-enabled Parquet datasets and visualize temporal patterns using time-series workflows directly in Map Viewer. These enhancements make it easier to explore large-scale, cloud-native datasets over time, identify trends, monitor change, and create dynamic visualizations that support data-driven decision-making.
Time Series Calculation Methods
Gain deeper insight into how your data changes over time with new calculation methods for time series in Map Viewer. Calculate changes and percent changes from the first or previous time interval or compare values with the average to more easily identify trends and patterns in your data. Calculations are configured directly within the time series, reducing the need for additional calculated fields, data pipelines, or Arcade expressions. Once configured, the results can be used across styles, labels, and pop-ups, making temporal analysis easier to create, visualize, and communicate throughout your map.


SHARE AND COLLABORATE
Embedded and App Experience Enhancements
Time-enabled maps can now be shared and experienced more consistently across the ArcGIS ecosystem. The Time Slider is now supported in embedded Map Viewer experiences and configurable map applications, allowing users to interact with temporal data outside of Map Viewer while preserving the same time-based context. As maps are shared or embedded in other applications such as Instant Apps or Dashboards, their temporal controls remain available, making it easier for audiences to explore changes over time without leaving the experience. Additional responsive design improvements are also being introduced to optimize the Time Slider for smaller screens, ensuring a more intuitive and accessible experience across devices.
LAYERS
Parquet Feature Layer Enhancements
Map Viewer continues to expand support for Parquet feature layers, with new capabilities that make it easier to work with, visualize, and manage this modern data format. For a deeper look at the latest enhancements, see the What’s new for Parquet feature layers blog. Below are some of the key updates now available in Map Viewer.
Explore Parquet Feature Layers Over Time
Map Viewer continues to expand support for modern data formats with enhanced time capabilities for Parquet-based data. Authors can now work with time-enabled Parquet datasets and visualize temporal patterns using time-series workflows directly in Map Viewer. You can also use relative date filters (see, Filter expressions) to focus the map on dynamically changing time periods, such as the last 7 days or the past month. To learn more see Configure time settings.
Explore Parquet Data with Charts
Map Viewer expands support for Parquet feature layers by bringing charts into the data exploration workflow. You can create bar charts, line charts, pie charts, and histograms directly from Parquet feature layers, providing new ways to explore distributions, compare values, and uncover patterns in large datasets. Chart selections are also integrated with Map Viewer’s selection experience, helping connect what you discover in a chart with the corresponding features in the map and other supported components.
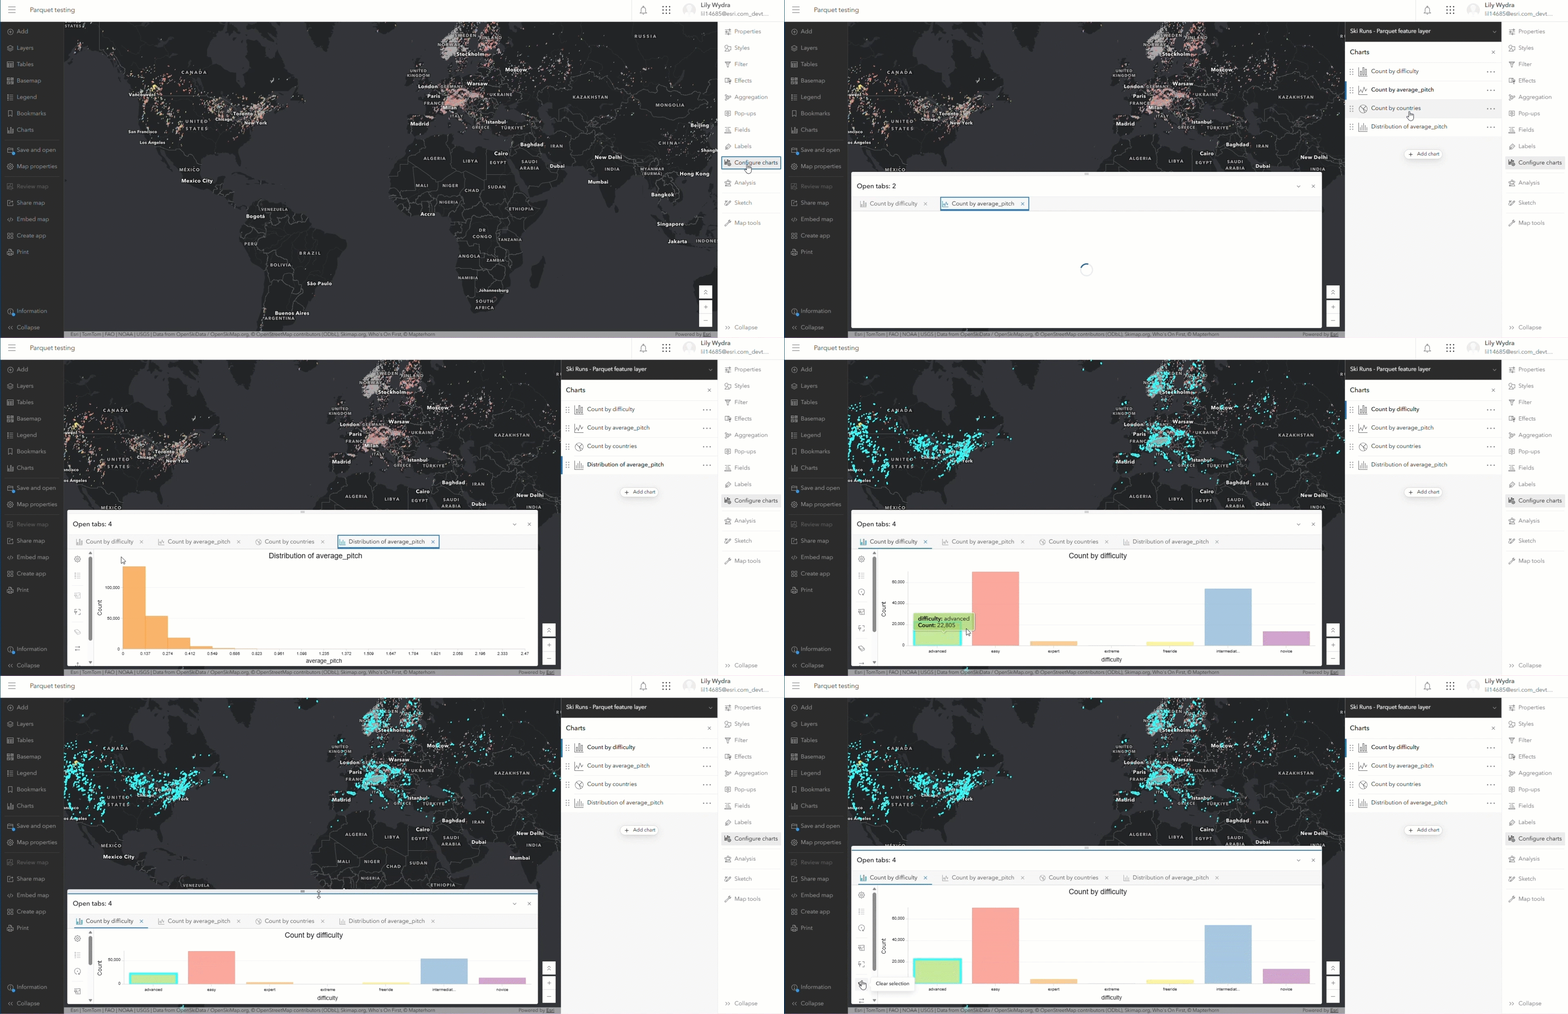
Keep Parquet Layers Up to Date
You can configure a refresh interval for Parquet feature layers so the map can automatically retrieve updated data at the frequency you specify. This is especially useful for datasets that are updated regularly using data pipelines and helps reduce the need to manually refresh the map. To learn more see Set refresh interval
Layer Information
View information about a Parquet feature layer (beta) and open its item page directly from the properties page in Map Viewer, making it easier to access additional layer details and information without having to search for the item separately.
Save Parquet Feature Layers (beta)
You can now use Save and Save as with Parquet feature layers in Map Viewer, making it easier to preserve your layer configuration such as style, pop-ups, labels, charts, and reuse it across different web maps and applications where they’re consuming parquet feature layers. Using the Save as option creates a new item, but it does not make a copy of the data and instead continues to reference the data from the source Parquet feature layer. To learn more see Save and duplicate layers
Annotation and Dimension Layers
Support for dimension and annotation feature layers, including the ability to save their configurations within a web map, was introduced in June 2026. Dimension feature layers allow measurement of length or width to be displayed in Map Viewer, helping users understand important distances and dimensions directly in the context of the map. Annotation feature layers allow carefully authored text placed on a map to be individually positioned and edited to clearly identify or describe features, helping preserve the cartographic intent of maps as they are brought into web workflows. Text formatting tags help preserve the intended appearance of annotation in Map Viewer. Now, with Save and Save as support, layer configurations can also be saved to the feature layer item, making it easier to preserve and reuse your work.
Styling Support for Video Layers
You can now style video layers in Map Viewer, giving you greater control over how video content appears alongside other information in your map. Adjusting the visual appearance can help emphasize important details and make the video easier to interpret. With more control over video layer styling, you can create clearer, more effective maps that bring video and geographic information together.
EXPLORE AND EDIT DATA
Dynamic Choice Inputs
Map Viewer now supports dynamic choice inputs in forms, making data collection and editing more flexible and helping streamline data entry across different workflows. This enhancement helps make forms more responsive to different workflows and supports a more streamlined experience for users entering and updating information. Dynamic choice is a new input type that allows form authors to generate a focused list of choices for users that is powered by an Arcade expression. In addition, the feature table now supports annotation and dimension layers, extending the types of layer information you can work with in the table.
Edit Using Templates
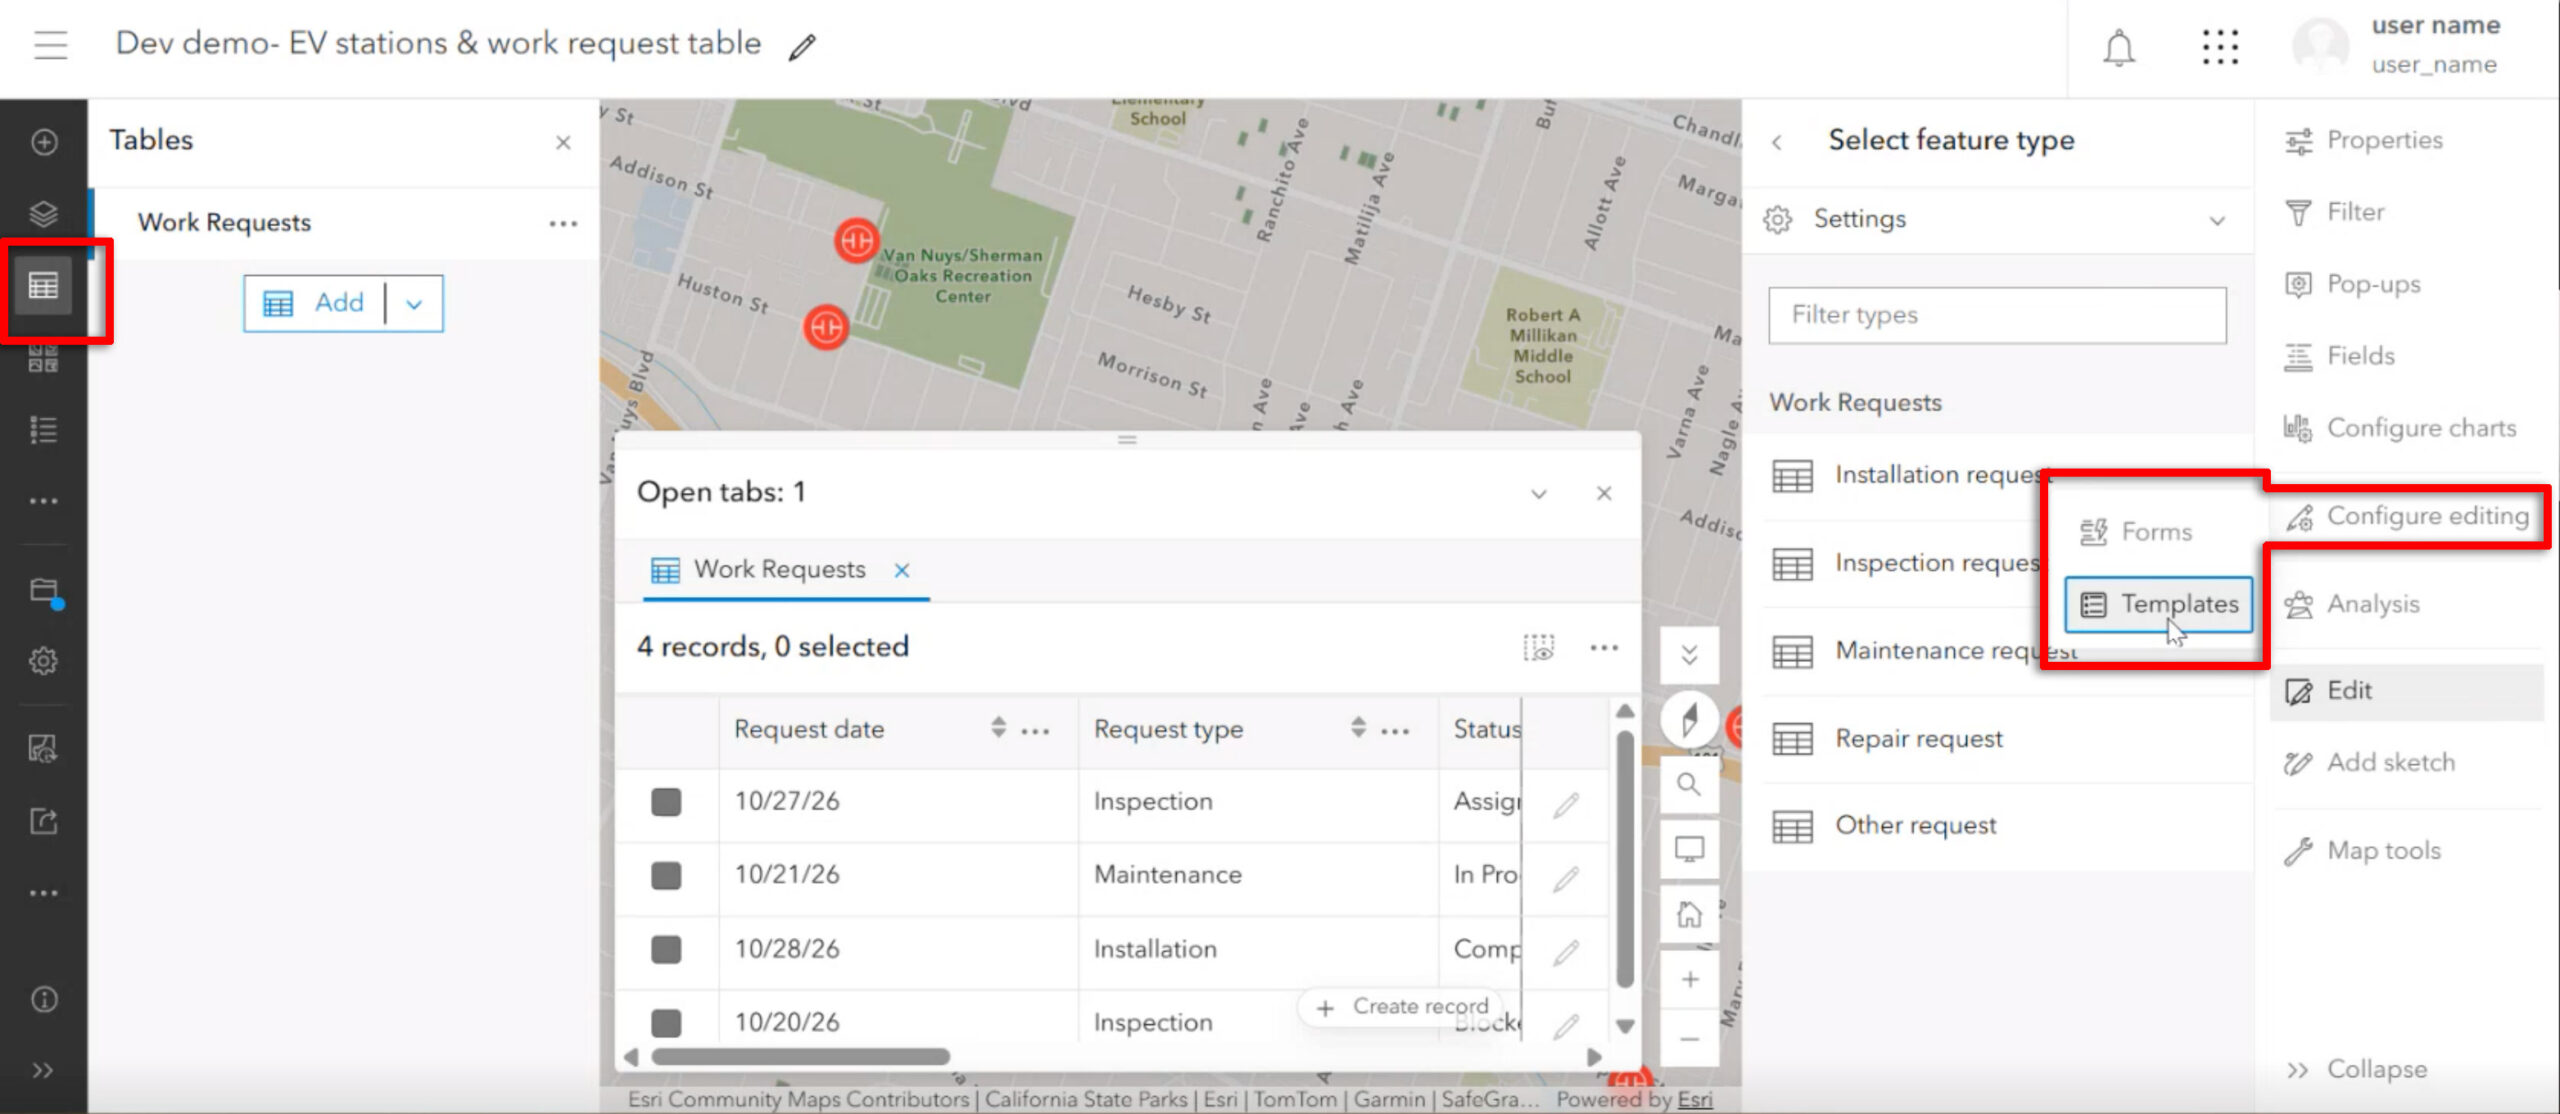
Editing workflows are now more seamless across ArcGIS with enhanced support for table templates. You no longer need to configure table templates in ArcGIS Pro—now, you can create and manage templates for tables directly in Map Viewer. This includes opening and organizing templates, reordering or duplicating them, and updating properties such as display names and default values. When creating a new table record, simply select a template to automatically populate predefined field values, making data entry faster and more consistent. You can also use the Create record button directly from the table to add records, whether or not templates are present. These improvements make it easier to set up and maintain efficient editing workflows entirely within Map Viewer.
ANALYZE SPATIAL DATA
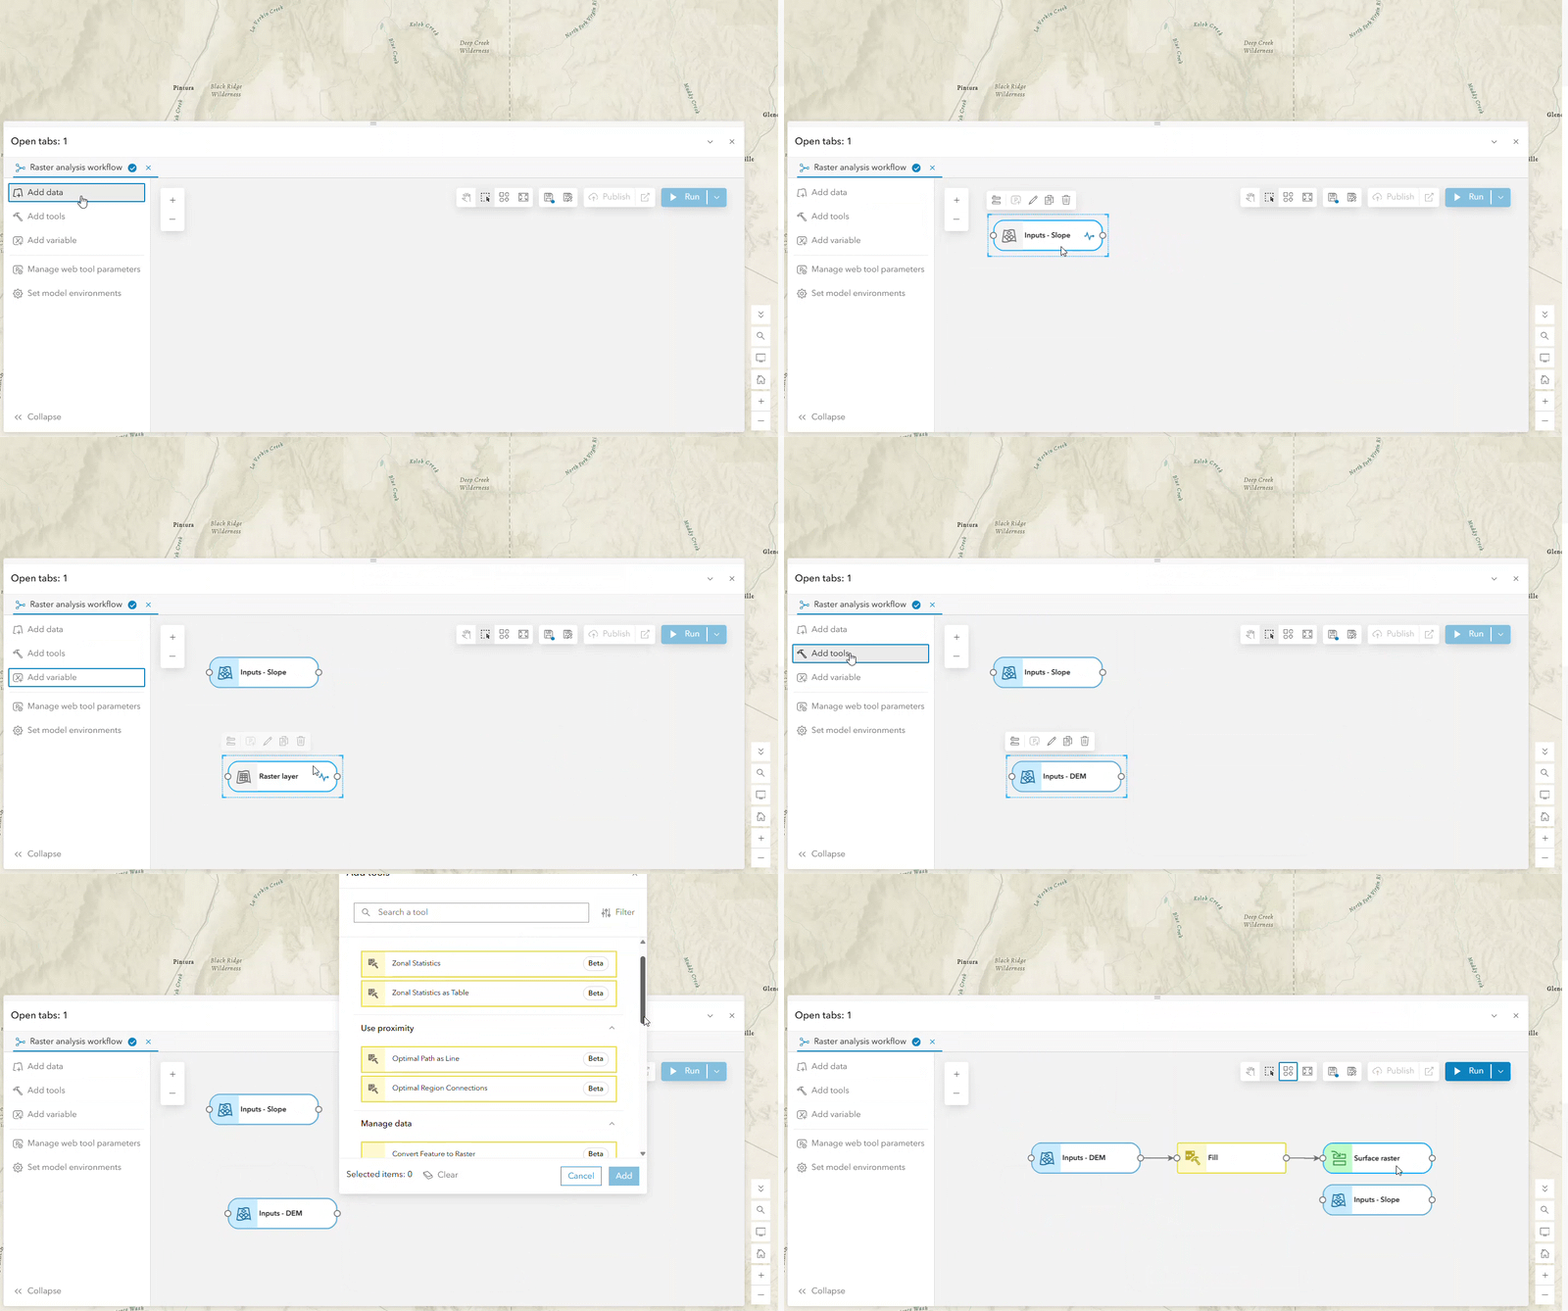
Raster Analysis in ModelBuilder (beta)
Raster Analysis in ModelBuilder (beta) expands ModelBuilder beyond feature analysis to support unified workflows that combine raster and feature analysis in a single model. Users can work with raster and feature datasets as inputs and outputs, access 14 Map Viewer raster analysis tools, and choose between Standard and Raster Optimized analysis sessions. Both session types will use the existing credit rate during Beta, allowing users to explore the new capabilities without pricing changes. Join the Early Adopter Community (EAC) to ask questions, share experiences, connect with other participants, and provide feedback to help shape future development.
Model Item Details and “Open in Map Viewer” for Model Items
Working with saved models is becoming more seamless with support for model item details and Open in Map Viewer. You can view information about a model as an ArcGIS item and open it directly in Map Viewer when you are ready to continue working. This provides a smoother experience for finding, managing, and returning to your analysis workflows across ArcGIS.
Web Tool Validation
A Validate button is now available for custom web tools created from geoprocessing services. Clear errors, warnings, and informational messages are there to help you identify input or configuration issues before running a tool, helping prevent avoidable failures and improve the reliability of analysis results. To learn more, see Use custom web tools.
USABILITY
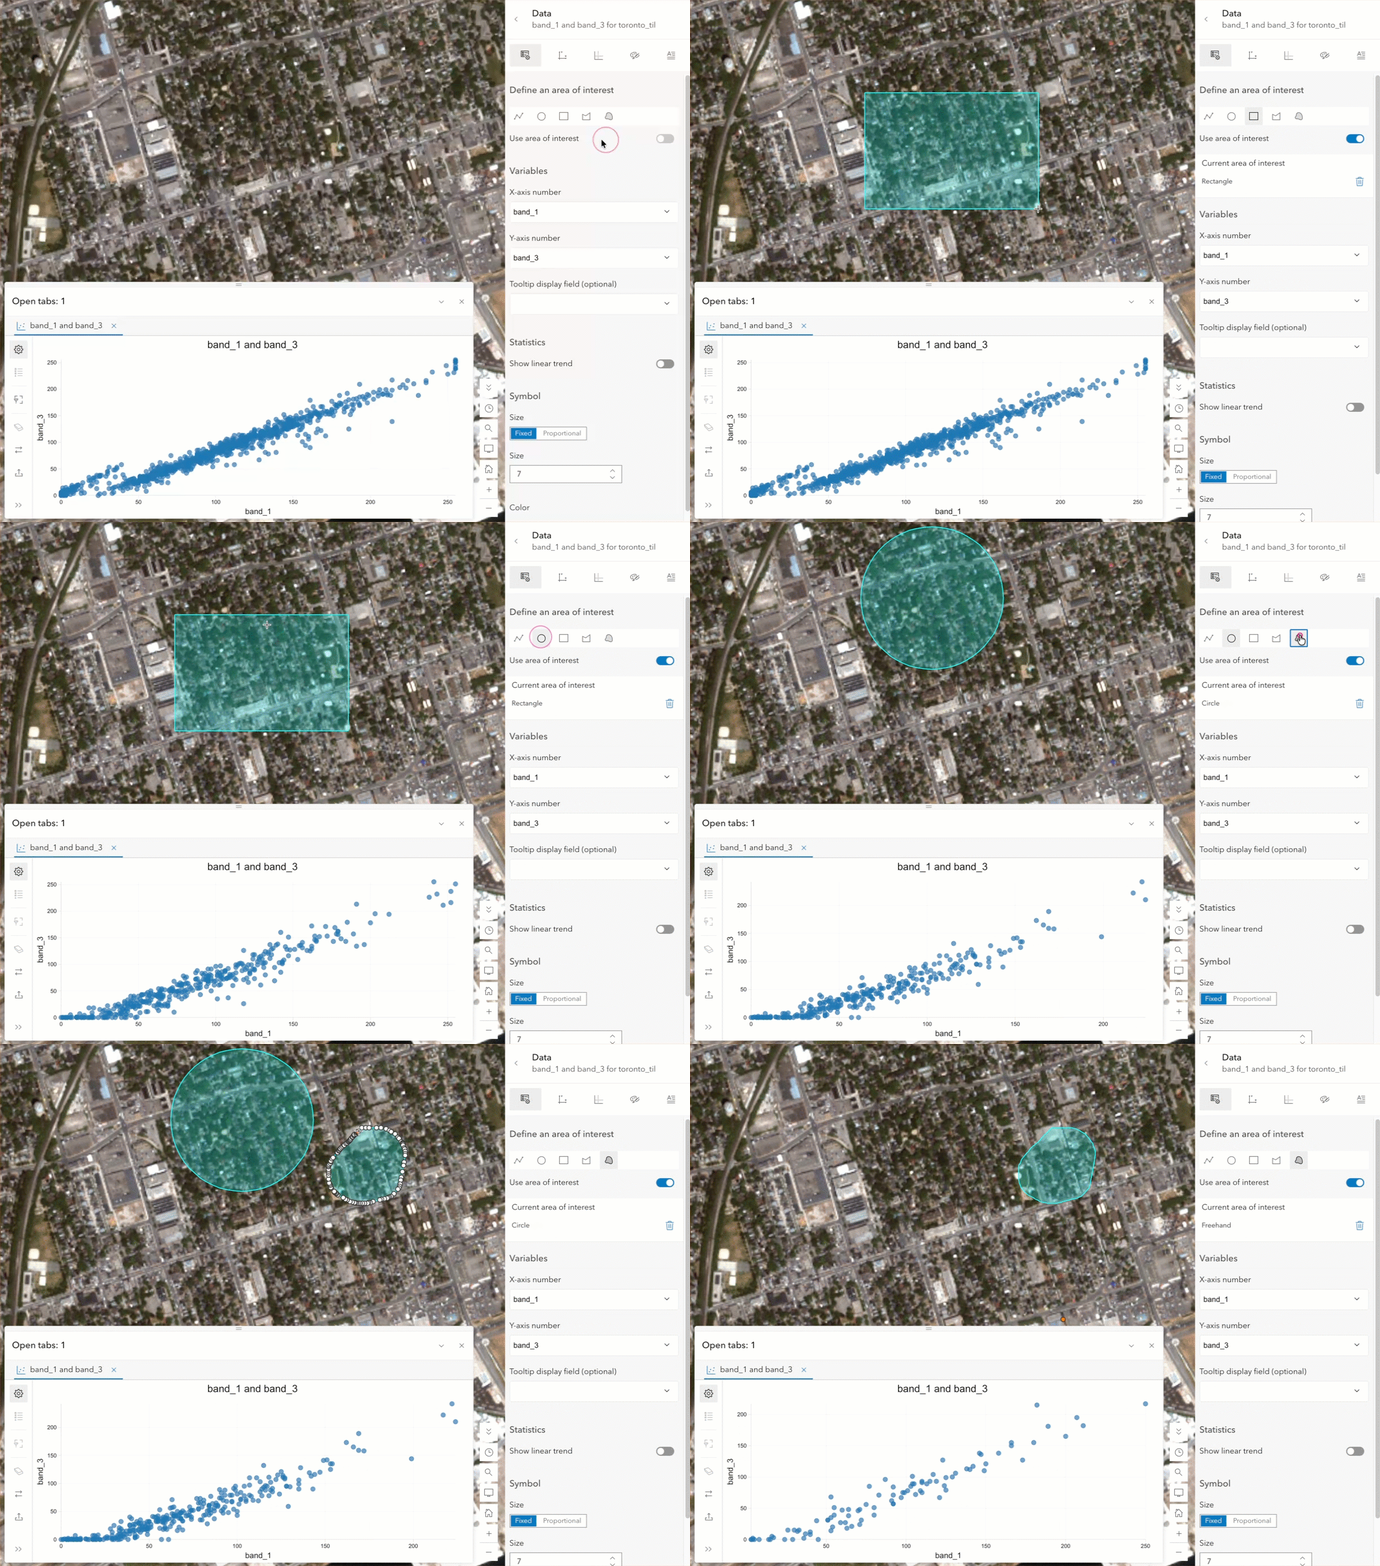
Define an Area of Interest for Imagery Scatterplots
You can now define an area of interest (AOI) when working with scatterplots for imagery layers. Instead of filtering the chart only by the current map extent, you can sketch a more precise area on the map and immediately see the scatterplot update to reflect data within that area. The AOI is preserved as you move between charts and can be turned on or off, giving you more flexibility when exploring imagery data.
Hover Text in Charts and Improved Chart Navigation
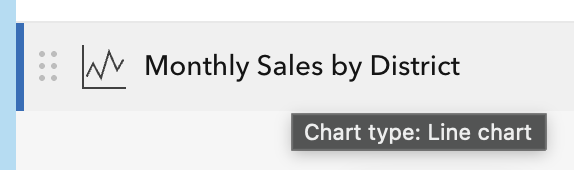
Hover text makes identifying the chart type easier in the chart list, while the new resizable tab experience gives you more flexibility to adjust the chart height to fit your visualization needs. The ability to resize tabs was frequently requested by users at the Esri User Conference, making this enhancement a direct response to your feedback.
Resizable Center Panel
The center panel in Map Viewer can now be resized, giving you more control over exactly how much the center-app takes up in the map view. Expand the panel when you need more room to work with settings, options, or longer content, or reduce its size to keep more of your map visible. This makes it easier to tailor the Map Viewer interface to your workflow and work comfortably with the information you need.
Looking Ahead
Several additional enhancements are planned for future release — bulk actions, geospatial PDF, track visualization and many more. Stay tuned as Map Viewer continues to grow.
Thank You
Thank you to the following teammates for their contributions to this blog article:
Lauren Ballantyne, Bekah Bollin, Jeremy Bartley, Maxwell Debella, Phoebe Gelbard, Emily Garding, Heather Gonzago, Mark Harrower, Zara Matheson, Taylor McNeil, Jessica Parteno, Debapriya Paul, Amanda Ring, Jian Lang, Sarmistha Chatterjee, Jimmy Chen, Russell Roberts, Ian Youth and Chris Whitmore.




Commenting is not enabled for this article.