ArcGIS Online lets you understand the world around you by using interactive maps to connect people, locations, and data. You get smart, data-driven styles and intuitive analysis tools that deliver location intelligence. ArcGIS Online gives you the ability to make maps and apps to share your insights with your organization or the world. You can use it as a complete, cloud-based solution or to extend and complement the capabilities of ArcGIS Pro and ArcGIS Enterprise.
Don’t have an ArcGIS account? See Create an ArcGIS Account.
The December 2021 update includes new functionality in Map Viewer and other enhancements and new functionality throughout the ArcGIS Online website. Highlights are provided below.
Quick links
Use the links below to jump to sections of interest.
- Map Viewer
- Scene Viewer
- ArcGIS Instant Apps
- ArcGIS Dashboards
- ArcGIS Experience Builder
- ArcGIS Web AppBuilder
- Sharing and collaboration
- Data management
- Accounts and administration

Map Viewer
Earlier this year the new Map Viewer came out of beta and has been evolving, introducing many new features and capabilities. Administrators and members are encouraged to configure the new Map Viewer as their primary map viewer to take advantage of these new capabilities.
Both map viewers are available, and some workflows (such as analysis) require Map Viewer Classic. For help in deciding which to use, see Which map viewer should I use?
The primary map viewer is configured by the administrator in the Map section of the organization settings. Individual members can set their own viewer preference. Both Map Viewer and Map Viewer Classic can be opened via the app launcher regardless of the primary viewer specified.
With this update, Map Viewer has been enhanced with new capabilities and features, including the following:
Effects
Using effects, you can enhance your maps using creative visualizations. For example, you can apply a bloom effect to point features to highlight them or make the labels on a map stand out by applying a drop shadow effect. Effects can be applied to basemaps and operational layers, and can be combined with other settings such as blending.
In addition to applying effects to a whole layer, you can now use filters to apply effects to specific features in a layer. For example, you can apply the Bloom + Gray effect to a fire perimeter layer to emphasize fires that occurred during a specific year (shown below). When working with specific features, effects are now paired, bringing together commonly used and visually effective options.
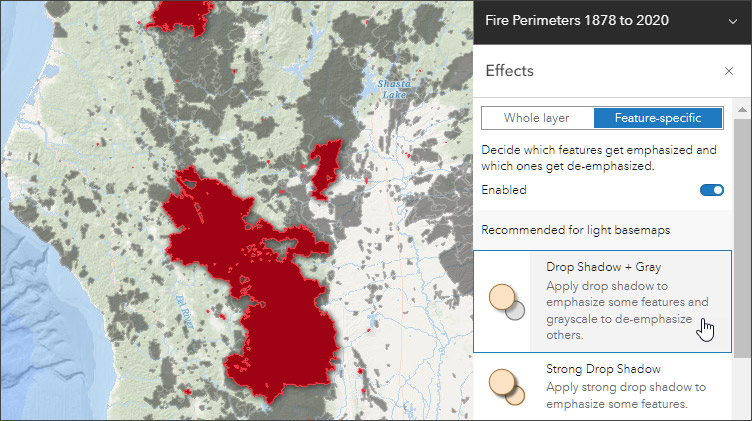
For more informaton, see Use effects.
Pop-ups
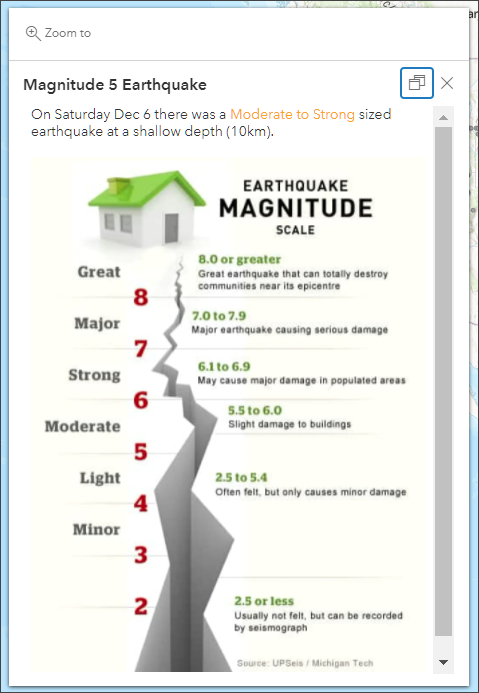
ArcGIS Arcade support in pop-ups has been enhanced. New Arcade elements are supported using templates, making it easier to create Arcade-driven charts, use rich text (shown below), and manage and manipulate data from multiple related tables. See Add Arcade elements for more information.
Arcade can now be applied to clusters to display the results of calculations and other information about the data. For example, if your map layer shows traffic collision data, you can create an expression to display the number of fatalities represented in each cluster and whether that number has increased or decreased since the previous reporting period. For more information, see Configure clustering.
HTML can now be displayed and edited in pop-ups, allowing you to create custom information displays. For more information, see Configure pop-ups and Supported HTML.
Layers
Over 160 new color ramps are now available, providing more flexibility, accessibility, and variety when styling layers. See Apply styles for more informaton.
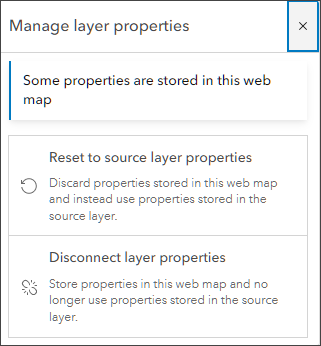
You can view the status of layer properties, letting you learn whether the map overrides any saved layer configurations. You can also choose to disconnect or reconnect to saved layer configurations. For more information, see Set layer properties.
GeoJSON
Based on JavaScript Object Notation (JSON), GeoJSON is an open standard geospatial data interchange format that represents simple geographic features and their nonspatial attributes. It uses a geographic coordinate reference system, World Geodetic System 1984, and units of decimal degrees. With this update, you can now add GeoJSON layers from a URL to Map Viewer.
Other URL layers
Map Viewer has enhanced support for layers added from a URL. You can filter OGC WFS layers and CSV layers.
Sketch layers
A sketch layer lets you interactively add features to your map such as stamps, lines, polygons, rectangles, circles, and text. Descriptive information can be added to each feature that will appear in pop-ups. Multiple sketch layers can be added and are stored with the map.
With this update, the sketch tool has been added to the Settings (light) toolbar (it also remains available from Add in the Contents (dark) toolbar). Sketch elements can now be snapped to hosted feature layers and also to WFS, CSV, and GeoJSON layers.
For more information, see Create sketch layers.

Image layers
Map Viewer now includes enhanced imagery layer support, including the ability to configure pop-ups, apply raster function templates as a custom rendering rule, and use time-enabled tiled imagery layers.
Labels
Use the XY Slider to see your label placement update in the map as you adjust it to find the best position.
Labels on lines has been updated with the ability to control how a label repeats along features. You can now disable label repetition completely, or use a distance interval. Line labels also support label overrun, which allows labels that are larger than the feature being labeled to be displayed on the map.
A new FGDC GeoAge font has been added to label styles, a standard font for geologic map symbolization.
For more information, see Configure labels.
Tables
For feature layer tables, you can now select rows in the table and zoom to the location of the extent of all the selected features on the map.
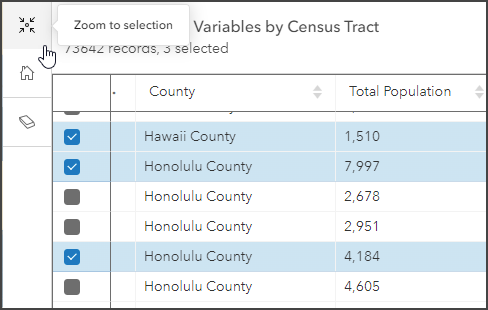
For more information, see Show tables.

Scene Viewer
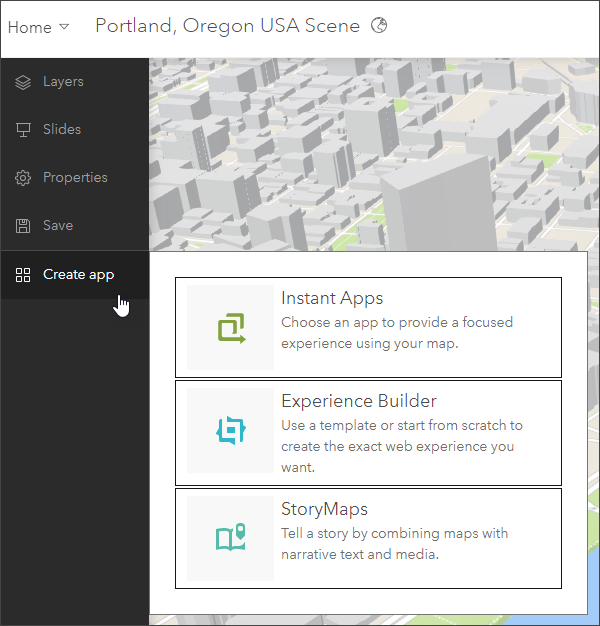
Use Scene Viewer in ArcGIS Online for creating, viewing, and exploring 3D scenes. You can now create an app directly in Scene Viewer. Choose Instant Apps, Experience Builder, or StoryMaps to create apps and stories with custom configured capabilities.

ArcGIS Instant Apps
ArcGIS Instant Apps are the latest generation of configurable apps, featuring a streamlined experience that lets you build apps quickly and easily using express setup mode, or you can switch to full setup mode to select additional tools and settings.
All Instant Apps are available via a searchable gallery that can be opened in several ways:
- From the Overview tab for a map or scene item, click Create Web App and choose Instant Apps.
- From Content, click Create app then choose Instant Apps.
- Using Map Viewer or Scene Viewer, click Create app in the Content (dark) toolbar, then choose Instant Apps.
- Using Scene Viewer, click Create app in the Designer toolbar, then choose Instant Apps.
New in this release
The following Instant Apps were introduced in beta with the September 2021 update. They are now fully released.
Slider animates historical, live, or future data based on numeric values or time to show how data evolves.
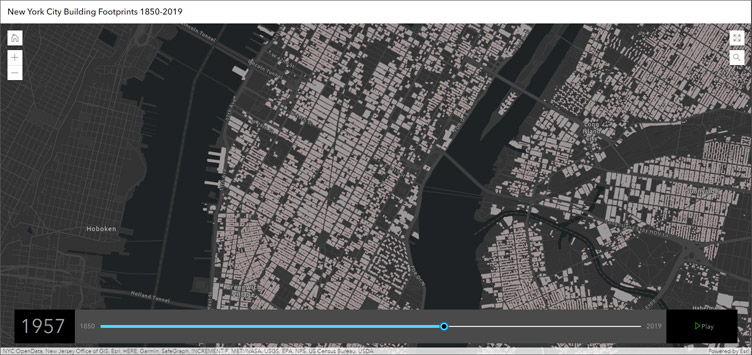
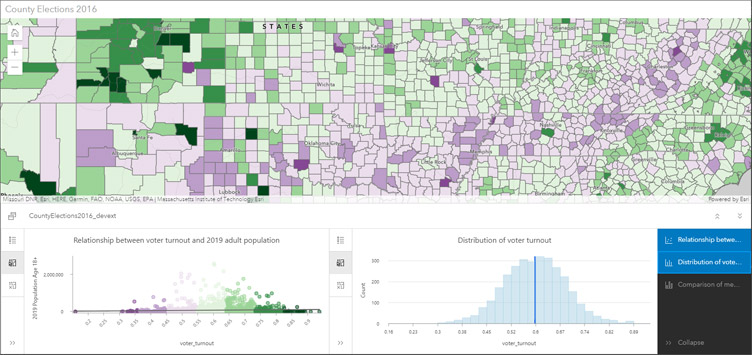
Chart Viewer displays bar charts, line charts, histograms, and scatterplots to complement the map. Up to ten charts can be included in the app and each can be viewed alongside your map or side by side with other charts for comparison.
Countdown displays a list of locations in a map ranked by values for a specified field.
Beta in this release
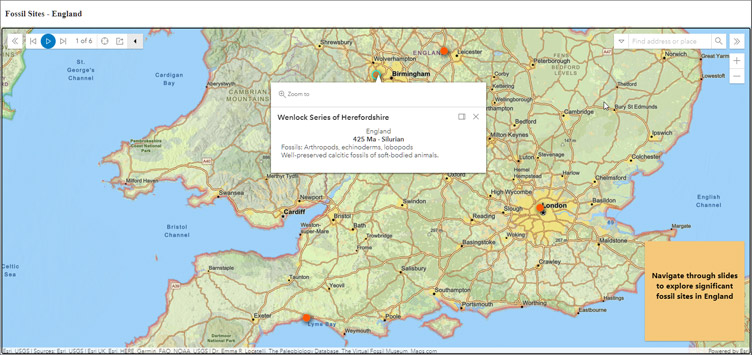
Exhibit enables you to create a linear, interactive story using author-defined slides. Each slide can have unique layer visibility and basemaps that differ from the web map. You can also apply filters and use sketches to tell your story effectively.
Additionally, you can add the find location tool to most apps and allow exporting results to PDF in Nearby and Zone Lookup. For more information, see What’s new in Instant Apps.

ArcGIS Dashboards
ArcGIS Dashboards enables users to convey information by presenting location-based analytics using intuitive and interactive data visualizations. Dashboards are used to help make decisions, visualize trends, monitor status in real time, and inform their communities.
ArcGIS Dashboards includes several updates. The Table element is now available, allowing you to visualize your data in a more granular way. Choose between a grouped value table for showing statistics, or a feature table for showing more raw values. You can configure the way your table is displayed using the default options, or use advanced formatting expressions to do even more with your tables.
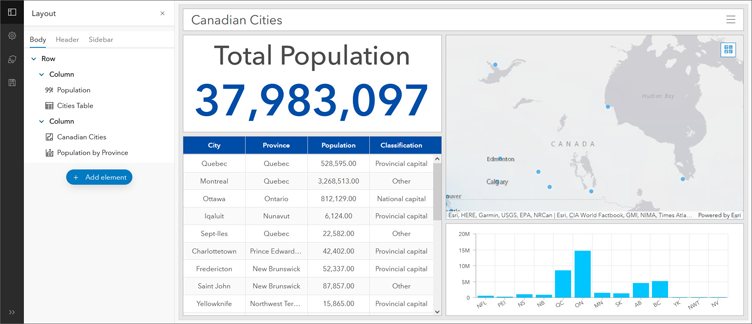
Additionally, the user interface for authoring dashboards has been redesigned and includes a new layout panel. The layout panel allows you to view and manage your dashboard’s layout more easily. In the panel, you can see and manage all your existing elements, and add new ones to your dashboard.
For more information, see What’s new in ArcGIS Dashboards.

ArcGIS Experience Builder
Use ArcGIS Experience Builder to build modern mapcentric or non-mapcentric web apps and webpages without writing any code. Engage your audience through compelling web experiences on any screen size. Start from scratch or choose from an extensive library of templates that you can easily customize. Add advanced functionality with widgets you can drag, drop, and configure. Enjoy fully flexible layout options to build any web experience for any purpose.
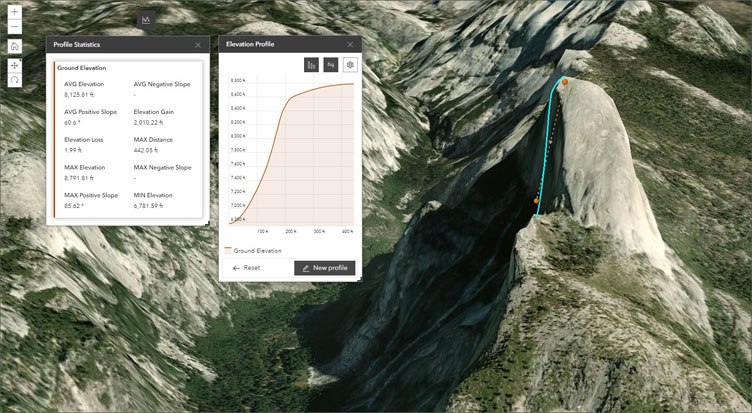
Two new widgets are available in ArcGIS Experience Builder. Elevation Profile generates and displays an elevation profile from an input path in a web map or scene.
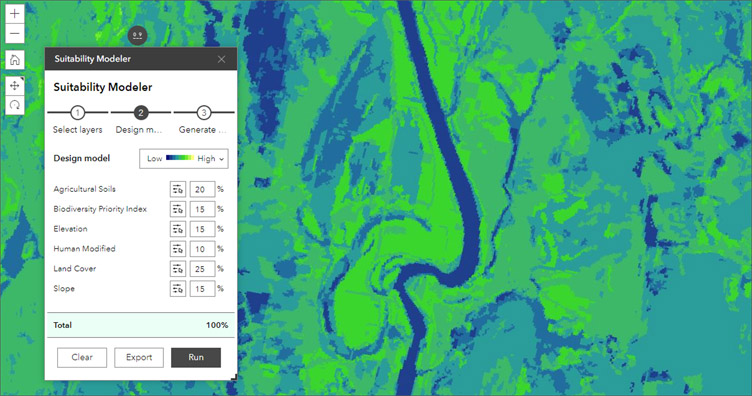
Suitability Modeler finds the best location for an activity, predicts susceptibility to risk, and identifies where something is likely to occur. Other enhancements include support for pie charts, displaying page and view names in the URL, and more.
For more information, see What’s new in Experience Builder.

ArcGIS Web AppBuilder
ArcGIS Web AppBuilder delivers a way for you to easily create web apps that run on any device, using a gallery of ready-to-use-widgets. You can customize the look of your apps with configurable themes and can host your apps online or on your own server.
ArcGIS Web AppBuilder includes updates to the Parcel Drafter widget, which now supports adding a warning message that guides users to adjust a misclose distance value while editing a parcel.

For more information, see What’s new in ArcGIS Web AppBuilder.

Data management
Create a feature layer
The experience for creating new feature layers has been enhanced. When creating a blank layer, you can immediately add multiple layers of different types (point, line, polygon, or table).
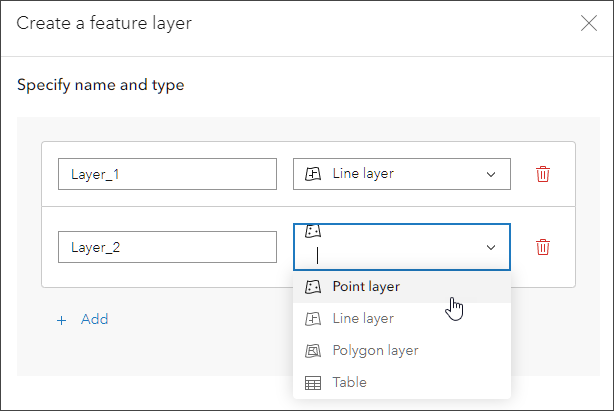
Search and sorting has been improved when you create feature layers from an existing layer, making it easier to find the layers you want.
When creating feature layers from a template, you can preview the layers and fields before choosing the template.
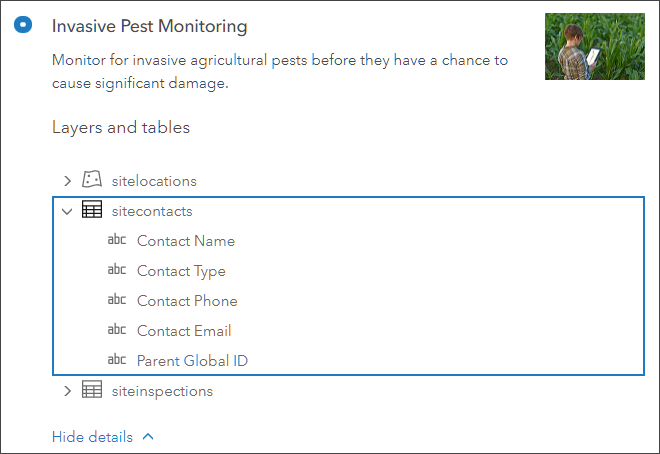
Hosted feature layer views
Hosted feature layer views enable you to apply different edit or sharing settings, styles, or filters to any hosted feature layer, keeping a relationship with the original layer so that any updates to the original layer cascade out to all view layers.
The workflow for creating hosted feature layer views has been improved, with the view definition now set as part of the view creation process. You can create a filtered view of your layer using attributes, by drawing a shape, or by using a shape from another layer. Specific fields can be chosen for the view and sharing and editing permissions.
You can still alter the view definition later from the hosted feature layer view’s details page, but now your hosted feature layer view contains the right content as soon as you create it.
For more information, see Create hosted feature layer views.
Attribute editing forms
If your map contains editable feature layers, you can now author and configure forms editors can use when they update field values in the web map. Configured forms are stored with the web map. For more information, see Create forms for attribute editing.

Sharing and collaboration
Layer status
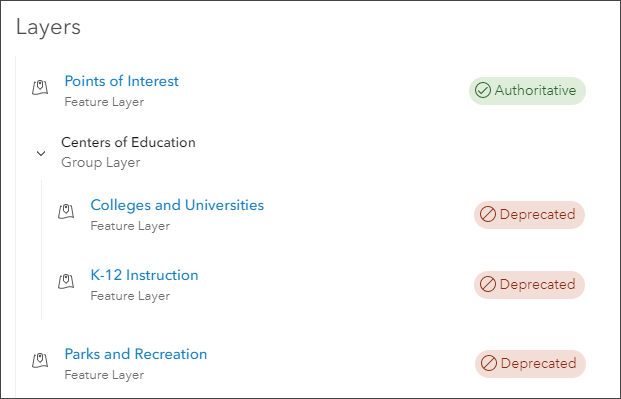
The status of layers is displayed when viewing map item details, helping you keep your maps current and working properly. Layer status information displays which layers are badged as authoritative or deprecated.

Accounts and administration
Security
For enhanced security in the organization, administrators can now restrict member access to only approved external apps. In addition, organizations can block member access to Esri apps while they are in beta.
Credit budgeting
Administrators now see improved information showing credit consumption in order to avoid credit overspending. A subscription is moved to a restricted state when an organization uses all of its credits. With a restricted subscription, access to some items and workflows that consume credits—such as premium content and batch geocoding—is blocked. For more information see Understand credits and the FAQs.
Home page
If you have not yet updated your home page using the new home page editor, you will see a reminder.
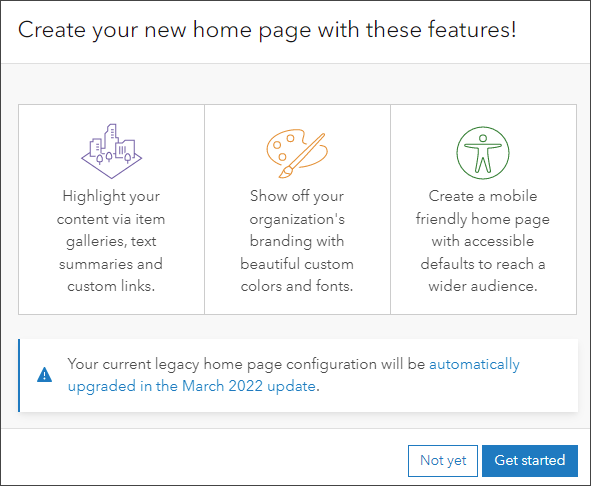
If you started using ArcGIS Online before June of 2020, you’ll need to switch from the legacy home page to the new home page. All legacy home pages will be automatically moved to the new page with the March 2022 update. All ArcGIS Online organizations created after June 30, 2020 only have the new home page, so there is no need to transition.
For more information, and to provide feedback, see Let’s transition to the new ArcGIS Online home page.

More information
For more information and additional details about this release, see the What’s new help topic or view all posts related to this release.
For other information, see the ArcGIS Online blog articles and ArcGIS Online at the Esri Community.
For news, updates, and information about other products, see the ArcGIS Blog and product resources at the Esri Community.

Commenting is not enabled for this article.