Forests are unique places – often peaceful and quiet in nature but teaming with life. They support a delicate ecosystem that provides raw materials and recreational opportunities for humans, but also serve as a habitat for diverse species and wildlife. For forestry organizations, the management of productive timberlands with a high standard of environmental stewardship is key to maintaining this balance.
A core function of any active forestry company is the monitoring of sensitive wildlife species in the areas in which they operate. These activities often include sending out armies of wildlife biologists with pen and paper to complete surveys and record observations. Collected information is then used to plan future activities and, in some cases, submitted to regulatory agencies to remain in compliance with regulations.
For organizations that work in heavily regulated areas or manage large swaths of land, a myriad of challenges makes monitoring wildlife using traditional methods difficult to scale. Using the power of location, the ArcGIS platform offers a streamlined workflow that allows wildlife surveys and observations to be completed in a much more efficient manner. The platform also provides near real-time status updates of wildlife monitoring activities, enabling faster and better-informed decision making on forest activities in sensitive areas. This blog will cover how you can use out-of-the-box tools to enhance productivity and efficiently manage endangered species activities.
Workforce Coordination and Management
Prior to any planting, treatment, or harvesting activity, an organization must gain an accurate understanding of the potential impacts the activity may pose to the surrounding environment so any detrimental effects can be minimized. This often involves performing a comprehensive wildlife assessment in the area of interest to identify locations where threatened or endangered species are present. In many cases, there are established sites where a threatened or endangered species has been previously observed. It is important to visit these sites at an ongoing basis to determine if planned activities pose a potential impact.
A large area of forestland may contain hundreds or thousands of these sites that need to be visited. Coordinating a mobile field workforce in remote areas to complete this work presents numerous challenges:
- Providing each worker with a personalized list of activities
- Ensuring every location gets visited and properly documented
- Working in disconnected environments
Workforce for ArcGIS is a coordination and management tool that addresses many of these challenges. With Workforce, a dispatcher in the office can assign work to each field worker, track the progress of completed work, and address unplanned issues that arise over the course of the job. Workers in the field can use the mobile app to view a digital to-do list, update the status of assignments as they are completed, and launch other apps to navigate, view maps, and collect data – all completely offline.
Create a Workforce Project
Workforce for ArcGIS is a project-based application in both ArcGIS Online and ArcGIS Enterprise. To create a project to coordinate and manage inventory and survey activities, follow the steps outlined below.
Step 1: Open the Workforce for ArcGIS Web app. Sign in to your ArcGIS organizational account.
You’ll need at least a Creator license with privileges to create content. If you don’t have the appropriate account, contact your administrator or join the Learn ArcGIS organization for a free trial.
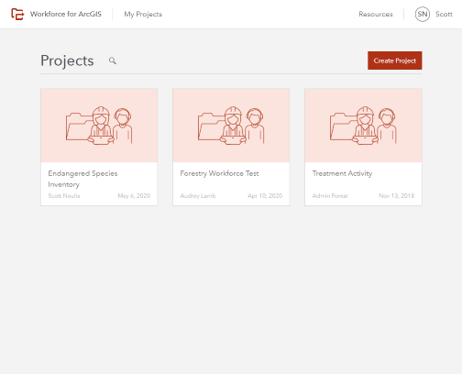
The Projects page appears, showing any projects that you’ve created or that you participate in as a dispatcher or mobile worker.
Step 2: Create a new project.
Give your project a name and a summary and click Create Project.
During project creation, the project and the maps and layers it uses are created for you. In addition, a folder and a group are created in your ArcGIS organization for this project. By default, you are added to the project as a dispatcher.
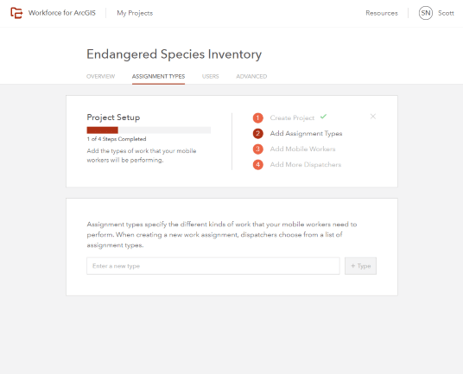
Step 3: Add assignment types.
Assignment types let you define the work that is being done in the project. Think of an assignment as a task or activity. A project must have at least one assignment type. You can add these after the project is configured and remove them if unused.
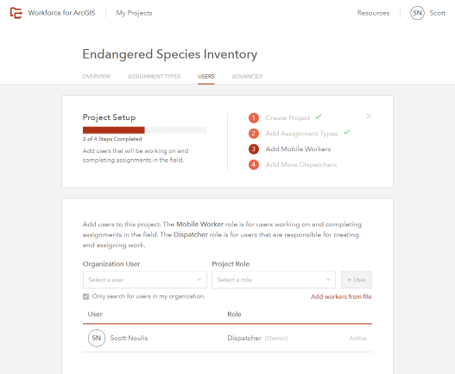
Step 4: Provide roles and add users to participate in the project.
Roles define where the project can be used: dispatchers use the web app and mobile workers use the mobile app. Users can be added from a list of members in your organization. Simply search for the desired member and add them under the desired role.
Details can be provided for each user in the project. Contact information, job title, and notes can be added or removed at any time.
Step 5: Customize the map.
Although your project is now ready to be used, you can configure the maps used by the web app and the mobile app with your own layers to provide additional context. This will allow dispatchers to see and search for features in the map and use them to create assignments. It will also allow mobile workers to view operational data in relation to their assignments. Launch each map from the workforce project folder in your Content to customize as desired.
Step 6: Configure additional settings.
In the Workforce app, hover over the existing project and click Configure. Click the Advanced tab of your project. Next to App Integration, click Expand to see the apps that mobile workers can use with Workforce. Navigator integration is enabled by default, where Collector, Explorer, and Survey123 integration are not enabled and require configuration.
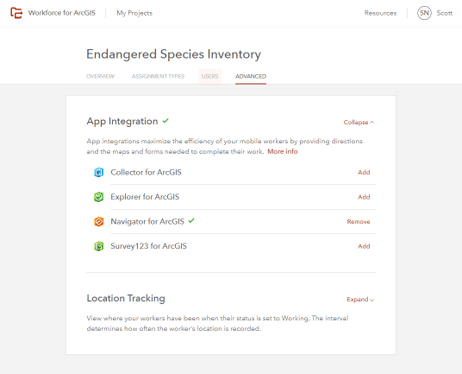
For this workflow, mobile workers may choose to launch an Explorer map to better understand their surroundings and view information about stands and survey sites while in the field before collecting data. We’ll get to this in the next section.
Your Workforce project is now ready to use. Assignments can be loaded into Workforce in bulk or created from the map. Since each wildlife monitoring site must be visited at a regular interval, assignments can be created at each location with specified due dates, assigned to the right person, and tracked as visits are completed. For more information on administering projects and dispatching work, visit the Workforce for ArcGIS Resource page.
Data Collection
Threatened and endangered species monitoring surveys can be very detailed and require a lot of data to be collected. The type of activity – a planned site visit versus an unplanned observation, for example – can determine the specific information that needs to be captured. Location, date and time, weather conditions, presence of the species, and notes are just a few of the key observations that must be documented.
The accuracy of the information captured is equally as important as the content that is recorded. Data that is incorrectly entered or not recorded at all can skew the results and cause headaches down the line. For example, a nesting area that was misidentified or not documented correctly can postpone or delay activities and, in some cases, result in significant fines and legal action. To remedy this, organizations are moving away from traditional methods of data capture using pen and paper in favor of a more digital approach.
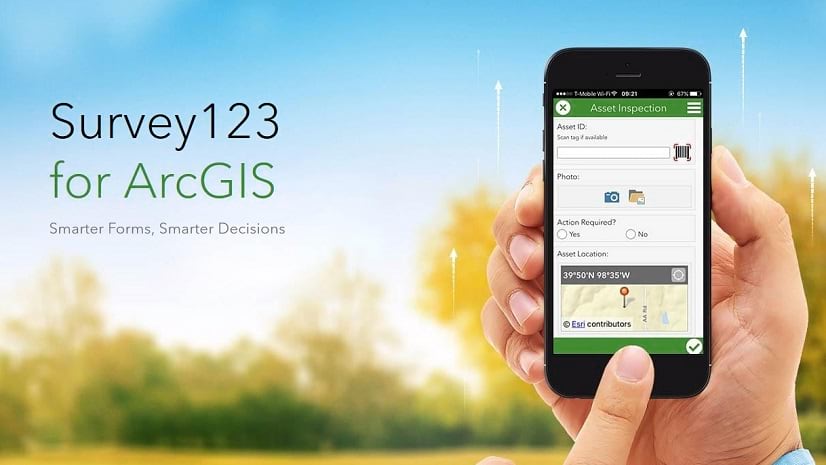
For this reason, it is important to have a flexible data collection tool that can be configured to meet any need – from strict reporting standards to tailored specifications. Survey123 provides a form-centric data collection experience that meets these needs. Forms can be designed with predefined questions, logic, easy-to-fill answers, and attachments to support rapid and accurate data collection both online and offline.
Configure Survey123 for Field Data Collection
Survey123 forms can be authored using the Survey123 Website or Survey123 Connect and shared to ArcGIS Online or ArcGIS Enterprise. Workers in the field then consume these forms through the Survey123 field app on a mobile device. A wildlife survey data model and form template can be downloaded and configured for use with the following steps.
Step 1: Open the ArcGIS Online Group. Hover over each item and click Download.
Step 2: Sign in to your ArcGIS Online or ArcGIS Enterprise Portal. Under the Content tab, click Add Item and select the option From your computer.
Step 3: Browse to the location on your computer where the files were downloaded to and select the Observation_Sites file. Ensure the Publish this file as a hosted layer option is checked. Add appropriate tags and click Add Item.
A new hosted feature layer will be created that contains one layer and one table. The Observation Sites layer will contain point features that represent observation locations. The SiteVisits table will store the information collected during each visit. The table is related to the layer with a 1-to-Many relationship so subsequent visits to a site can be stored without overwriting existing information or duplicating features. Survey123 will be used to capture site visit information and write into the table. To configure this, a survey form needs to first be created and published.
Step 4: Download and install Survey123 Connect for ArcGIS (if not already installed).
This is the desktop application used to author and publish survey forms. Launch the program when installation is complete.
Step 5: Sign in to your ArcGIS Online or Enterprise Portal.
Step 6: Create a new survey.
In the My Survey Designs tab, click New Survey. Specify a title and select the File option. Browse to the SiteVisit Excel file downloaded in Step 1 and click Create Survey. A new survey form is created locally on your device. The form is already configured with questions that correspond to the fields in the SiteVisits table. Additional settings have been configured to refine the appearance of the form and incorporate logic. To learn more about authoring forms using Connect, see this resource.
Step 7: Link the survey form to the hosted layer you published.
Click the Settings tab in the Excel form. Update the Submission url parameter with the Item ID of the new hosted feature layer. Copy the Item ID in the url from the item details page in Portal and paste it in place of <itemID>. Save the form.
By default, when a new form is published a hosted feature layer is created to store submitted records. The submission url is used to redirect a submitted record from Survey123 into an existing feature layer.
Step 8: Verify the form looks and behaves as desired in the Form Preview window.
Step 9: Publish the survey.
A message will display confirming that the form will write into an existing layer. Click Publish Survey. A new form item will be published in your Content folder. Open ArcGIS Online to view the item.
Configure Survey123 to Work with Explorer
To enhance productivity, forms can be launched from other mobile applications like Explorer for ArcGIS or Collector for ArcGIS. In the previous section, we discussed App Integration in Workforce. In this case, a biologist may start out in Workforce to manage the activity, open Explorer to view stand information and observation sites, and then launch a form to complete a site visit. To configure a web map to open a Survey123 form, follow the steps outlined below.
Step 1: Create a web map that contains all relevant information.
Add the Site Observation layer created in the previous section. Append existing observation sites into the layer or create new records. Add additional layers that represent stands, ownership, and any other important information.
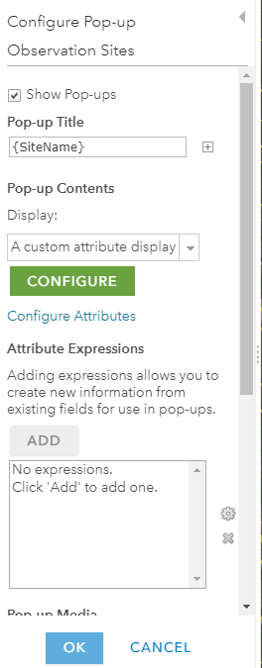
Step 2: Configure a custom pop-up.
Select the layer that contains the observation sites in the Contents pane and Configure Pop-up. Set the display option to A custom attribute display and click Configure. Add text to the popup and reference the desired fields by adding attribute placeholders.
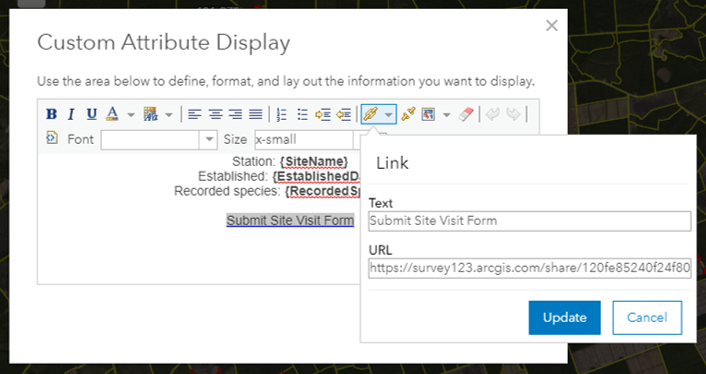
Step 3: Add a hyperlink to launch the form.
In the custom attribute display, add the text “Submit Site Visit Form”, highlight it, and create a link. This link will be used to launch a form for the selected feature in the web map. Survey123 supports URL parameters to open the app and form using the specified scheme – https://survey123.arcgis.com/share/<itemID>
Navigate to the item details page of the existing Survey123 form and copy the item ID in the URL. Paste the item ID into the hyperlink in the custom attribute expression.
Step 4: Add URL parameters.
Each feature contains information that we want to pass into the Survey123 form. Auto-filling answers to questions in the form reduces data entry error and speeds up data collection. This can be done by using URL parameters.
Configure the hyperlink to pass the {SiteName} and {GlobalID} values from the site feature into the form. This will ensure the information we submit in the form are properly linked to the correct feature. Ensure the popup correctly launches the form and passes the values you specified.
Step 5: Save the map.
Step 6: Integrate the map with Workforce.
Under App Integration in the project settings, add a map to use with Explorer. Select the map that contains the custom attribute expression and the popup and associate it to the correct assignment type.
Step 7: Collect data.
Ensure an assignment has been assigned to you as a mobile worker. Login to the Workforce mobile app, Explorer, and Survey123 on your device with your ArcGIS account. In Workforce, select the assignment from the To-do list. Click the Action button and select Explore at Assignment. Explorer should launch with the web map containing the wildlife inventory and survey data. Select an observation site feature on the map. In the pop-up, click the hyperlink to launch the survey form.
Survey123 will open and you will be prompted to download the form. Verify attribute values from the observation site were passed into the form and auto filled for the selected questions. Complete the remainder of the form and submit the survey when finished. Optionally return to workforce to finish assignment and start the next one.
Monitoring and Situational Awareness
Tracking inventory and survey activities is important for an organization to understand how their assets and resources are being impacted. The ability to monitor the progress of field crews and process collected data quickly and efficiently enables more confident decision making and a quicker response to issues that arise.
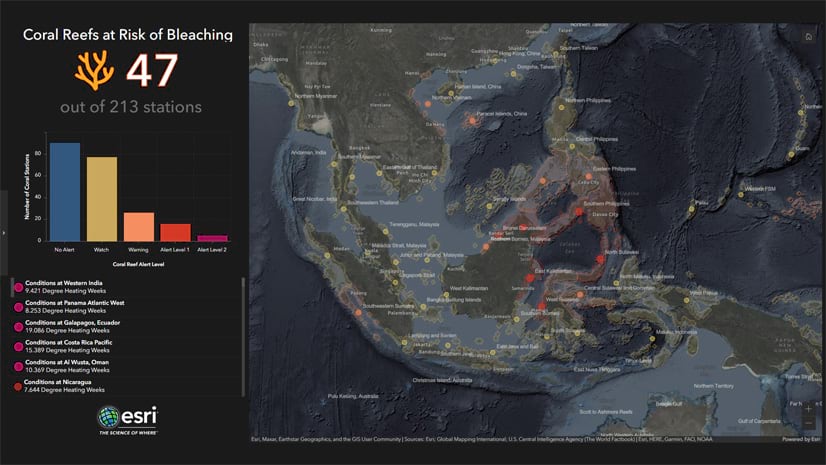
ArcGIS Dashboards can be configured to provide a common operating picture of your threatened and endangered species monitoring activities. Data collected in the field is automatically fed into the dashboard so users can see the latest information from site visits and field observations through maps, indicators, lists, and charts. The overall progress of the field workforce can be measured by comparing planned and completed activities.
Step 1: Create a Dashboard.
From your ArcGIS Online home page, click the App Launcher and select Dashboards. Click Create Dashboard. Enter a title, tags, and a summary.
Step 2: Add a map to the dashboard layout.
Click the Add Element button and select Map. Browse to your desired web map.
Step 3: Configure additional dashboard elements.
Dashboards can include indicators, charts, lists, and more. The elements you add to your dashboard will depend on the information you are trying to convey. Elements are linked to a source layer from the map and are data driven – meaning the features in the selected layer will influence how the element looks and the information it contains. Additional information for configuring elements can be found here.
Below is a sample dashboard that is configured to monitor threatened and endangered species inventories and surveys.
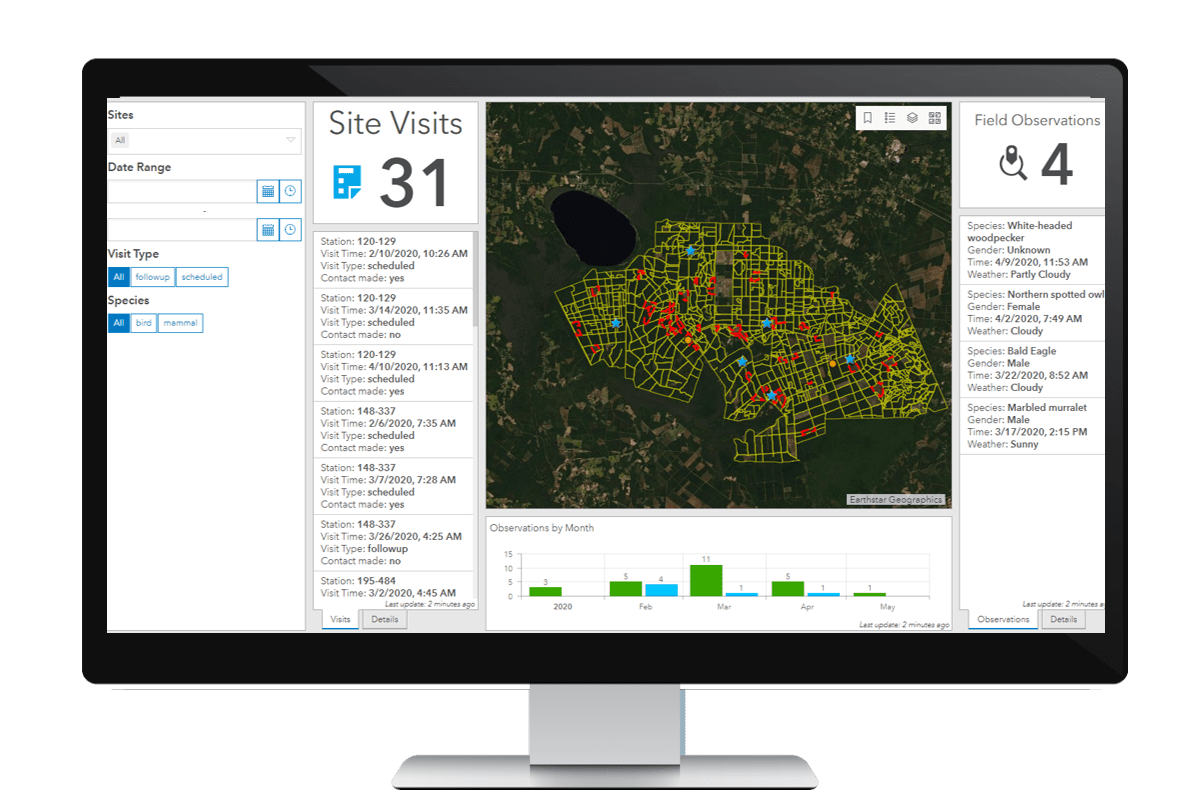
Using the ArcGIS platform to support endangered species monitoring activities can help streamline workflows, increase efficiency and accuracy during data collection, and support enhanced decision making. This enables your organization to responsibly manage timberlands while protecting the delicate ecosystems that lie within.


Article Discussion: