Imagery can be hosted, visualized, analyzed, and shared in ArcGIS Online, helping organizations manage and share their imagery data without the need for infrastructure. Once your imagery data is organized, ArcGIS Online supports analysis workflows—including deep learning.
This release introduces several enhancements to the user experience for imagery in ArcGIS Online, including:
- Overwrite imagery workflow using ArcGIS API for Python
- Additional Living Atlas imagery layers for raster analysis
- Default raster analysis processing extent has changed to map display extent
- Hyperspectral imagery layer support
- Dynamic range adjustment improvement for tiled imagery layers
- Image Collection Explorer widget in Experience Builder
Overwrite imagery layer workflow using ArcGIS API for Python
You can use the ArcGIS API for Python to overwrite existing tiled or dynamic imagery layers when their source data changes. This lets you replace imagery while preserving the item details in ArcGIS Online, ensuring your maps and applications always use the most current data.
You can overwrite an existing imagery layer if you are signed in to your ArcGIS Online organization with the account that owns the imagery layer being overwritten. You cannot overwrite an existing imagery layer owned by another member of your organization.
Use this notebook example to try it on your ArcGIS Online organization.
Overwrite Hosted Imagery Layers in ArcGIS Online
Note: Dynamic imagery layers created as image collections cannot be overwritten using this workflow. However, they can still be updated using the add_image and delete_image with the ArcGIS API for Python.
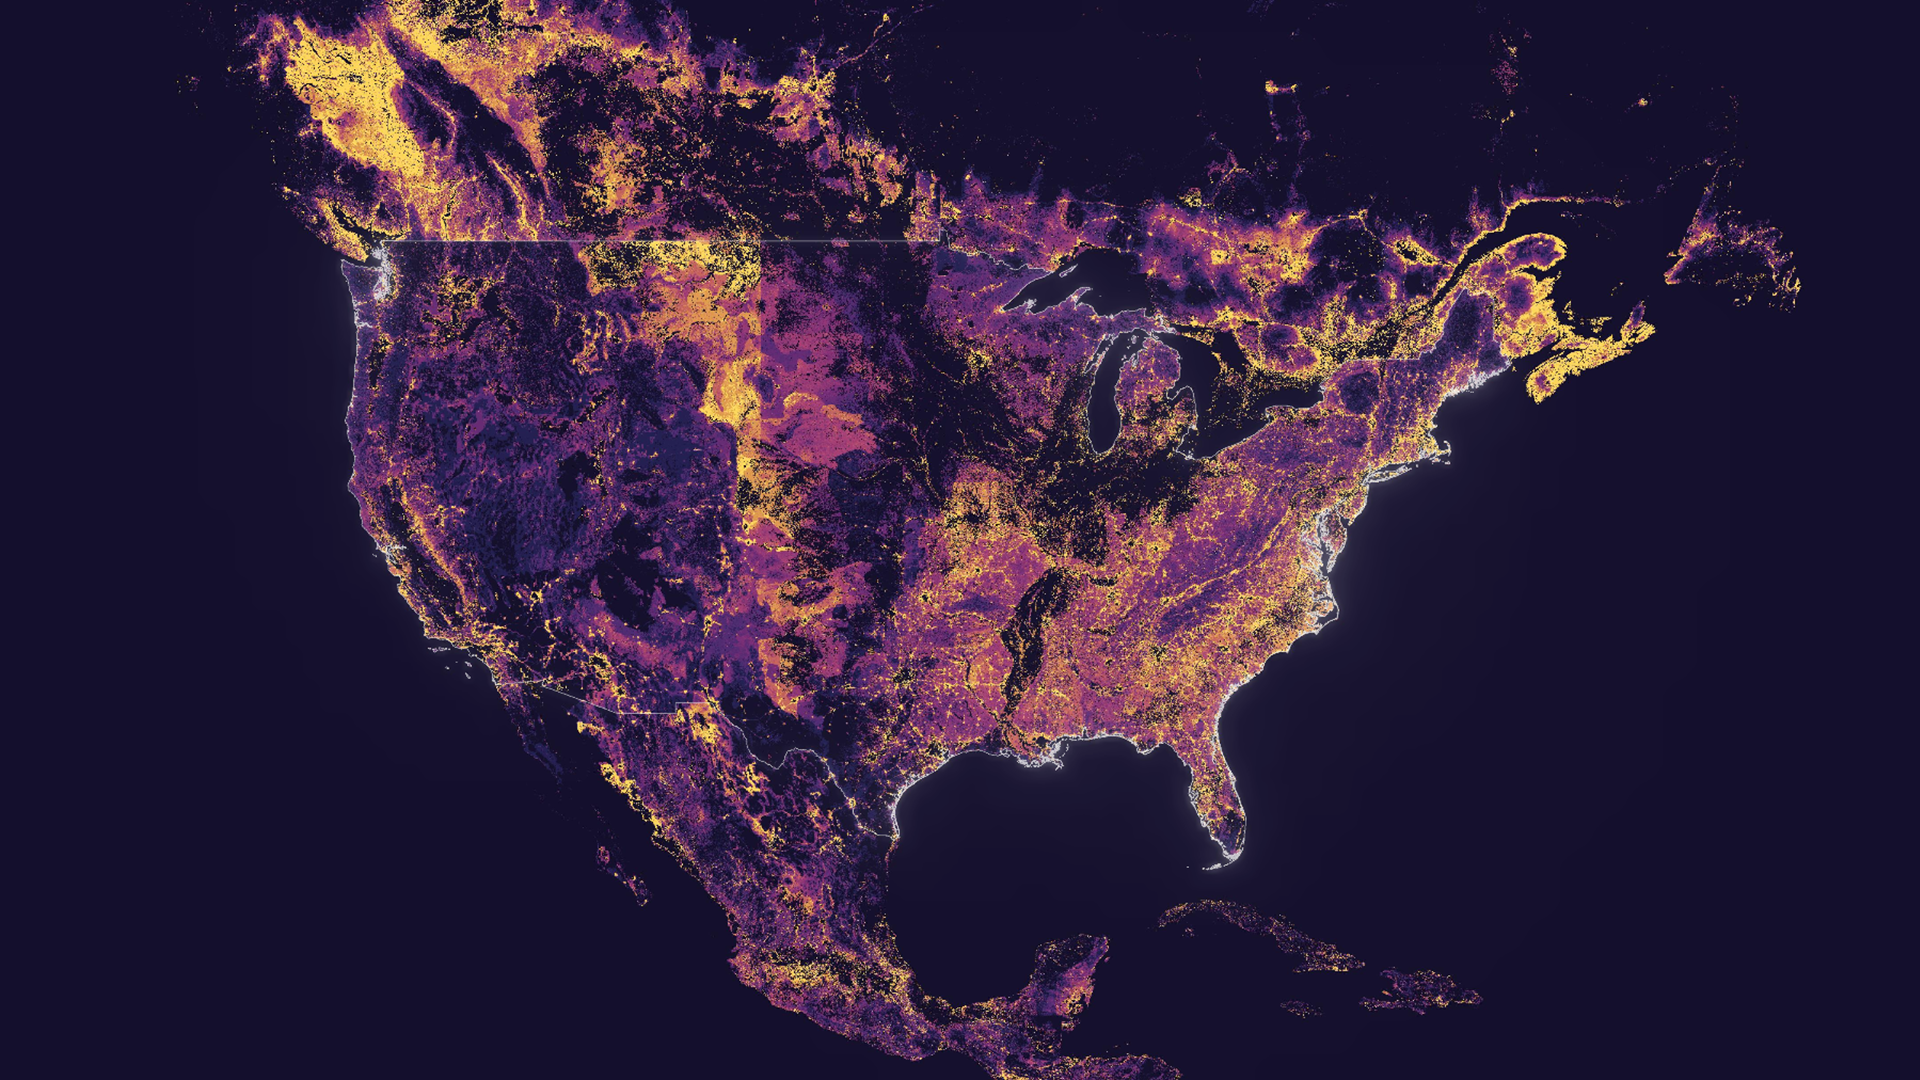
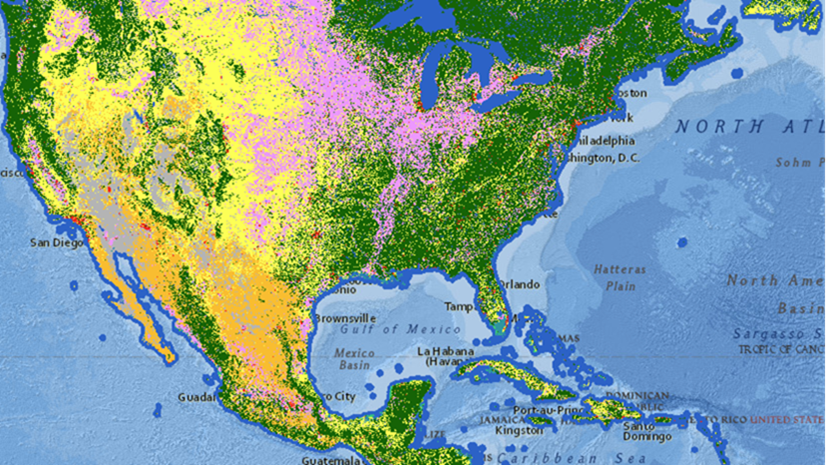
Additional Living Atlas imagery layers for raster analysis
ArcGIS Living Atlas of the World has included a variety of global Earth observation imagery layers. These layers have empowered users across industries to perform powerful visualization and analysis directly within ArcGIS Online without the need to download large datasets.
When users persist the results of analysis, those imagery layers are subject to the conditions set by the layer publishers as described here, such as whether analysis is enabled or not, and the request size limit setting.
This optimization was introduced in a previous release on a select set of ArcGIS Living Atlas imagery layers, and additional imagery layers have now been added to that original set. You can now perform raster analysis more efficiently on select ArcGIS Living Atlas imagery layers, enabling support for significantly larger areas of analysis. This capability is currently available for imagery layers belonging to the Living Atlas Imagery Layers Optimized for Analysis group. For more information about the optimization and how to enable it, please refer to the blog, ArcGIS Living Atlas ready-to-use imagery layers for analysis.

Default raster analysis processing extent has changed to map display extent
This release introduces a new parameter to define the default processing extent for raster analysis in Map Viewer. By default, the display extent of your web map is now used when performing raster analysis.
You can access and modify this setting in the Analysis settings pane. Under Processing extent environment, you’ll find the option Use a different processing extent for raster analysis, which is turned on by default.
Note: Non-raster analysis uses the Analysis processing extent parameter, which is set to run on the full extent of your analysis input by default.

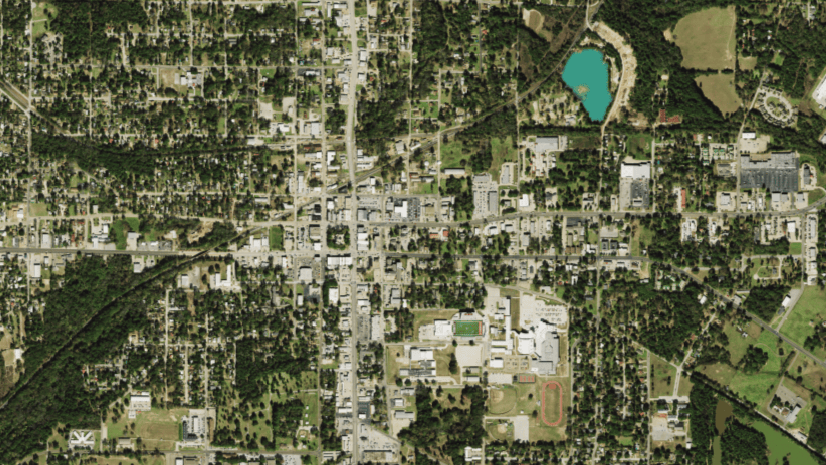
Hyperspectral imagery layer support
You can now visualize hyperspectral imagery data using both tiled and dynamic imagery layers in Map Viewer. Access and combine different bands to style your imagery and create insightful visualizations.

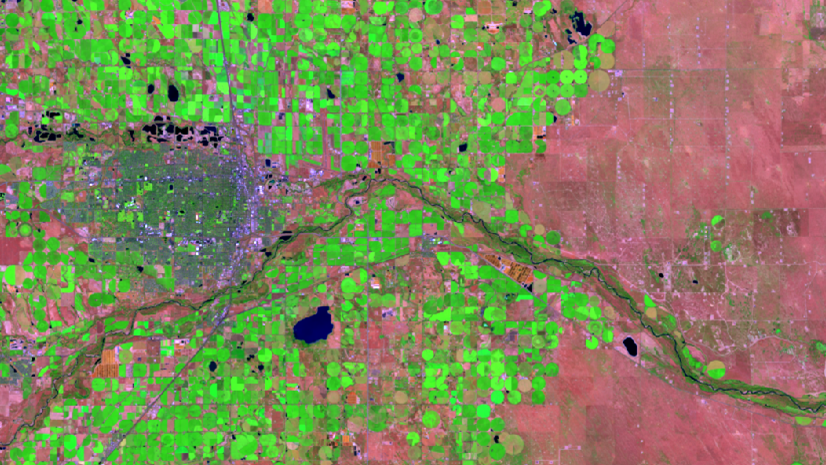
Dynamic range adjustment improvement for imagery layers
Tiled imagery layers using the Dynamic Range Adjustment (DRA) setting will now display faster in Map Viewer, improving overall performance and visualization quality. When the stretch type is set to Minimum Maximum or Standard Deviation and DRA is enabled, the display performance will improves as demonstrated in the following visualization.

Image Collection Explorer widget in Experience Builder
The Image Collection Explorer widget has been added to Experience Builder to allow you to explore imagery layers in your application. With this widget, you can explore the input imagery that comprise the imagery layer for imagery layers that have an attribute table. The metadata of the input imagery is visible and can be used to filter the input images to locate particular imagery based on specific criteria. You can also add those selected images as a new layer.

Ready to take the next step?
As an ArcGIS Online user, you can start exploring these new imagery capabilities today. The Product Team is interested in your thoughts and ideas as you explore. Influence the direction of future releases when you visit us and leave a comment via the Imagery in ArcGIS Online community on Esri Community.
Interested in seeing how others are using imagery in ArcGIS Online? Check out stories from Skytec, LLC, the City of Johns Creek, and the National Trust from the UK. You can also read a case study from the National Trust.
As an ArcGIS Online user, you can start exploring these new imagery capabilities today. Read blogs on the latest practices and tools such as, mapping mangrove dynamics with raster functions or mapping urban heat islands with Landsat imagery. Explore the tutorial gallery for step by step guides, such as how to identify infrastructure at risk of landslides.


Article Discussion: